What to Learn Before Data Analytics : Beginner Prep Guide
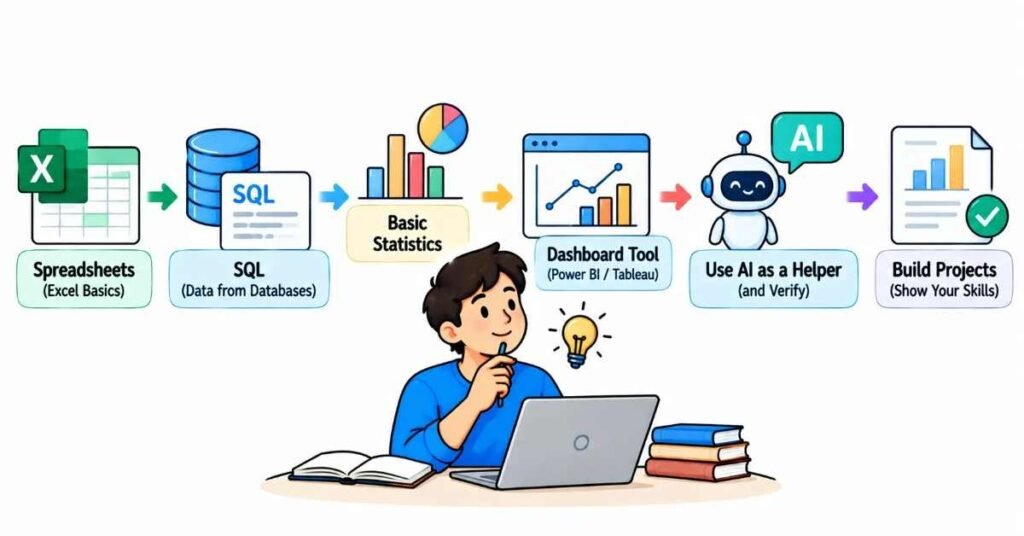
Recommended Learning Path
What Is a Data Analytics?
Understanding What Data Analytics is for Beginners
What Should You Learn Before Starting AI-Powered Data Analytics?
Before starting AI-powered data analytics, practise reading tables, using simple spreadsheet formulas, interpreting percentages and averages, and checking whether an answer makes sense. Learn a little database vocabulary too. You do not need to finish SQL, Python, statistics, and machine learning before your first lesson.
Introductory programs can teach technical tools from the beginning. Google’s beginner analytics certificate, for example, requires no previous experience or specific tool knowledge while including spreadsheets and SQL in its curriculum. Check your chosen course separately rather than assuming every provider starts at the same level.
Quick Answer
Prepare beforehand | Usually better learned through structured lessons |
Reading rows, columns, headings, and units | Multi-table SQL queries |
Simple formulas, sorting, and filtering | Complex data transformations |
Percentages, averages, and median | Statistical modeling |
Recognizing missing or duplicate records | Python-based analysis workflows |
Explaining a result in plain language | Machine-learning techniques |
Checking AI-generated answers | Advanced automation |
This is a suggested preparation plan, not a formal eligibility list. If your course is advanced, its expectations may be different.
Learn to read a table before calculating anything
Open a small practice spreadsheet and ask, “What does one row represent?”
It could represent a customer, an order, or a single item within an order. That distinction matters. If one order contains three products and occupies three rows, counting rows does not necessarily count orders.
Next, examine the columns:
- Does “amount” mean revenue, cost, or a payment?
- Are all values in the same currency?
- Is a blank cell unknown, not applicable, or zero?
- Is the date an order date or a delivery date?
Write a short description for each column. You are learning to understand the records before asking a tool to process them.
Practise a handful of spreadsheet operations
You do not need to memorize a long function list. Start with a few operations you can explain:
- Sort records without separating values from their rows.
- Filter a category or date range.
- Calculate a total and a simple average.
- Write a formula using cell references.
- Identify repeated IDs.
- Create a small category summary.
Once those feel familiar, try a PivotTable. Microsoft describes PivotTables as tools for calculating, summarizing, and analysing worksheet data.
For preparation, aim to explain the result rather than decorate it. A plain table with correct totals is more useful than a polished chart built on the wrong records.
Refresh the statistics you use in everyday comparisons
Start with percentages, percentage change, average, and median.
Here is an invented example. Five completed service requests took 1, 1, 2, 2, and 14 hours to resolve. Their average resolution time is four hours, while the median—the middle value after sorting—is two hours.
Neither number should be chosen just because it looks better. They communicate different aspects of the same records. The unusually long request pulls the average upward.
Practise explaining:
- What calculation did you use?
- What does it summarize?
- What detail might it hide?
You can build formal statistical knowledge during training. For now, concentrate on reading simple measures carefully.
Understand what a database and query are
You do not need to write advanced SQL before a beginner course, but a few terms can make lessons easier to follow:
- Database: an organized collection of data.
- Table: records arranged into rows and columns.
- ID: a value used to identify a record or entity.
- Query: an instruction requesting or working with data.
Then turn an everyday question into a precise request:
“Show completed orders from September, grouped by delivery area.”
That sentence introduces the reasoning behind filtering and grouping before you worry about syntax.
Google’s introductory curriculum includes SQL despite requiring no prior tool knowledge, demonstrating that SQL can be something taught during a beginner program rather than something mastered beforehand.
Learn how to question an AI-generated answer
For this guide, AI-powered analytics means using AI assistance within analysis—not handing responsibility for the result to a chatbot.
Practise writing requests that include:
- The question you want answered.
- The meaning of the columns.
- Any exclusions or assumptions.
- The calculation or output you need.
For example:
“Using this synthetic order table, summarize completed orders by area. Exclude cancelled records. Explain how you handled missing area names.”
Then check whether the output follows those instructions.
Microsoft warns that ambiguous or unstructured data can lead AI systems to produce inaccurate or misleading responses. It also notes that preparing the data does not guarantee a specific output every time.
Verification is therefore part of preparation, not an optional step after generating an answer.
Use synthetic or suitably public practice data. Do not upload private college, customer, or employer records without authorization.
A practice task: compare a student club’s events
Create a synthetic spreadsheet for events in Hyderabad or Vijayawada. Include event ID, category, registrations, attendees, and spending.
Answer one question: “Which event used its budget most efficiently?”
Before calculating, decide what efficiency means. Is it:
- Cost per attendee?
- Attendance rate?
- A different measure related to the event’s purpose?
Then:
- Check that each row represents one event.
- Calculate attendance rate using attendees divided by registrations.
- Calculate cost per attendee where attendance is greater than zero.
- Keep undefined calculations separate instead of forcing a number.
- Write a short explanation of the comparison.
- State what the spreadsheet cannot tell you, such as whether attendees found the event valuable.
You can ask AI to critique your explanation, but compare its suggestions with your calculations. This exercise is an illustrative recommendation, not a real FLM case study.
What can wait until the course begins?
For an introductory program that explicitly teaches from scratch, avoid postponing enrollment until you have already learned its entire syllabus.
Depending on the curriculum, lessons may introduce:
- SQL syntax and joins.
- Dashboard development.
- More detailed statistics.
- Python or another programming language.
- AI-assisted workflows.
- Larger project work.
Ask the provider which topics start from zero. The presence of “AI” in a title does not establish the course’s actual starting level.
If you are considering FLM, review its AI Powered Data Analytics learning option and confirm which fundamentals are taught before assuming you must learn them independently.
Proposed FLM perspective: bring questions, not a collection of certificates
A recommendation for FLM’s reviewer to approve: finish your preparation with three small pieces of work:
- A spreadsheet you have checked.
- A calculation you can explain.
- A question your data cannot answer.
These provide a useful starting point for lessons. They also reveal specific gaps more clearly than watching many unrelated tutorials.
If you prefer Telugu explanations, keep a bilingual notebook for technical terms. Practise recognizing the English labels that appear in your tools while explaining the underlying ideas in the language you understand best.
Common preparation mistakes
- Switching between several tools without finishing one exercise.
- Memorizing formulas without understanding their inputs.
- Treating missing data as zero automatically.
- Assuming a chart explains why something happened.
- Accepting generated calculations because they sound confident.
- Studying advanced topics simply because they contain “AI.”
FAQs
- Should I learn Excel before data analytics?
Basic practice can help: reading tables, filtering records, and checking calculations. Advanced Excel knowledge is not a universal entry requirement; verify your course’s starting level. - How much statistics should I know beforehand
For the preparation suggested here, revise percentages, averages, median, and simple comparisons. Advanced programs may require more. - Must I learn SQL first?
Not if the beginner course teaches it from the beginning. Google’s introductory program is one example of a curriculum that includes SQL without requiring prior tool knowledge. - Is Python necessary before starting?
Only if your selected course lists it as a prerequisite. Do not assume every introductory and advanced course has the same requirements. - Should I learn AI prompting before spreadsheets?
Practise understanding records and checking calculations first. A more detailed prompt cannot guarantee a correct answer from unclear data. - How do I know whether I am prepared enough?
Try the event exercise. If you can explain the columns, check a calculation, and identify a limitation, you have a useful foundation. This is a learning check, not an official admission test.