Data Analytics Interview Preparation Guide

1. 200+ Technical Interview Questions & Answers
- Introduction to Data Analytics (Questions 1-5)
- AI Overview and Generative AI (Questions 6-15)
- Data Pre-Processing and Cleansing (Questions 16-25)
- Exploratory Data Analysis (EDA) (Questions 26-35)
- Statistics for Data Analytics (Questions 36-45)
- Excel and Copilot for Data Analysis (Questions 46-55)
- SQL for Data Analysts (Questions 56-65)
- Power BI for Business Intelligence (Questions 66-75)
- Tableau for Data Visualization (Questions 76-85)
- Python for Data Analysis (Questions 86-95)
- Big Data Analytics (Questions 96-105)
- Advanced Excel Questions (Questions 106-115)
- Advanced SQL Concepts (Questions 116-125)
- Power BI DAX and Advanced Topics (Questions 126-135)
- Tableau Advanced Concepts (Questions 136-145)
- Python for Data Analysis (Advanced) (Questions 146-155)
- Statistics Application Questions (Questions 156-165)
- Real-World Scenario Questions (Questions 166-175)
- Tool Selection and Best Practices (Questions 176-180)
- Data Ethics and Governance (Questions 181-185)
- Communication and Business Skills (Questions 186-190)
- Career and Professional Development (Questions 191-195)
- Industry-Specific Questions (Questions 196-200)
- Emerging Trends and Future Skills (Questions 201-205)
⚡ Become a Job-Ready Data Analyst
Master SQL, Excel, Power BI, Tableau, Python & Generative AI tools with our
Data Analytics Course.
Section 1: Introduction to Data Analytics
Q1. What is data analytics in simple terms?
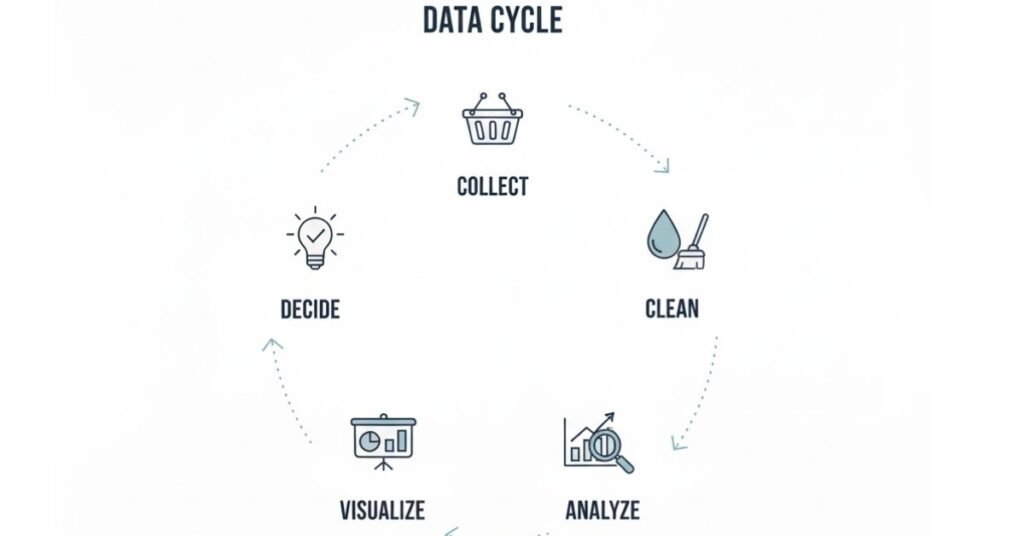
Think of data analytics as detective work with numbers. You collect information, examine it carefully, find patterns, and use those patterns to make smart decisions. For example, if a shop owner notices more customers buy ice cream on hot days, that’s data analytics helping them stock up when it matters most.
Q2. Can you explain different types of data?
Data comes in various forms. Structured data is organized like an Excel sheet with rows and columns. Unstructured data includes things like social media posts, videos, or emails that don’t fit neatly into tables. Semi-structured data falls in between, like JSON files that have some organization but aren’t as rigid as databases.
Q3. What are the main techniques used in data analysis?
There are four primary techniques. Descriptive analysis tells you what happened in the past, like last month’s sales figures. Diagnostic analysis explains why something happened. Predictive analysis forecasts what might happen next based on trends. Prescriptive analysis suggests actions you should take to achieve desired outcomes.
Q4. Why is analytical thinking important for data analysts?
Analytical thinking helps you break down complex problems into smaller, manageable pieces. Instead of getting overwhelmed by huge datasets, you learn to ask the right questions, identify what matters, and connect the dots between different pieces of information to find meaningful insights.
Q5. What tools do data analysts commonly use?
Modern data analysts work with Excel for basic analysis, SQL for database queries, Python for programming and automation, Power BI and Tableau for creating visual dashboards, and increasingly AI tools like ChatGPT and Copilot to speed up their work and generate insights faster.
Section 2: AI Overview and Generative AI
Q6. How would you explain AI to someone who knows nothing about it?
AI is like teaching computers to think and learn like humans do. Instead of following strict instructions for every single task, AI systems can recognize patterns, make decisions, and improve over time. Think of it as giving a computer the ability to learn from experience, just like you learned to ride a bicycle.
Q7. What’s the difference between AI, Machine Learning, and Deep Learning?
AI is the broadest concept – making machines intelligent. Machine Learning is a subset where computers learn from data without being explicitly programmed for every scenario. Deep Learning goes deeper, using neural networks that mimic how human brains work to solve complex problems like image recognition or language understanding.
Q8. What is Generative AI and how is it different from regular AI?
Traditional AI recognizes and classifies things – like identifying whether a photo contains a cat or dog. Generative AI creates new content – it can write essays, generate images, compose music, or even write code. Tools like ChatGPT and DALL-E are examples of Generative AI creating new content based on prompts.
Q9. Can you explain what Large Language Models (LLMs) are?
LLMs are AI systems trained on massive amounts of text from the internet. They understand language context and can generate human-like responses. Think of them as extremely well-read assistants who’ve processed billions of sentences and can now help with writing, answering questions, coding, and analysis tasks.
Q10. What is prompt engineering?
Prompt engineering is the skill of asking AI tools the right questions in the right way to get better results. Just like asking a colleague clearly gets better help, well-crafted prompts give AI systems enough context and direction to produce more accurate and useful outputs.
Q11. How does AI help in data collection?
AI automates data gathering from multiple sources – scraping websites, extracting information from documents, monitoring social media feeds, and pulling data from APIs. This saves analysts countless hours and ensures data collection happens consistently without human error.
Q12. What role does AI play in data cleansing?
AI tools can automatically detect missing values, identify outliers that don’t fit patterns, spot duplicate entries, and suggest corrections. Instead of manually reviewing thousands of rows, AI handles repetitive cleaning tasks while you focus on strategic analysis work.
Q13. Explain how AI assists in exploratory analysis.
AI quickly generates summary statistics, creates visualizations, identifies correlations between variables, and highlights unusual patterns in data. Tools like Copilot can analyze your dataset and suggest which relationships are worth investigating further, acting as your analytical partner.
Q14. What are the limitations and biases of AI?
AI systems learn from historical data, which means they can inherit human biases present in that data. They can’t understand context like humans do, may generate incorrect information confidently, and struggle with tasks requiring genuine creativity or ethical judgment. Always verify AI outputs, especially for critical decisions.
Q15. What is the difference between ChatGPT, Copilot, and Gemini?
ChatGPT by OpenAI excels at conversational AI and content generation. Microsoft Copilot integrates deeply with Office products like Excel and Power BI, helping with data analysis workflows. Google Gemini combines search capabilities with generative AI and works well with Google Workspace tools. Each has strengths depending on your specific needs.

Section 3: Data Pre-Processing and Cleansing
Q16. What characteristics define real-world raw data?
Real-world data is messy. It contains missing values where information wasn’t captured, duplicates from multiple entries, inconsistent formatting like dates written differently, outliers that are unusually high or low, and errors from human input mistakes. Cleaning this data is essential before analysis.
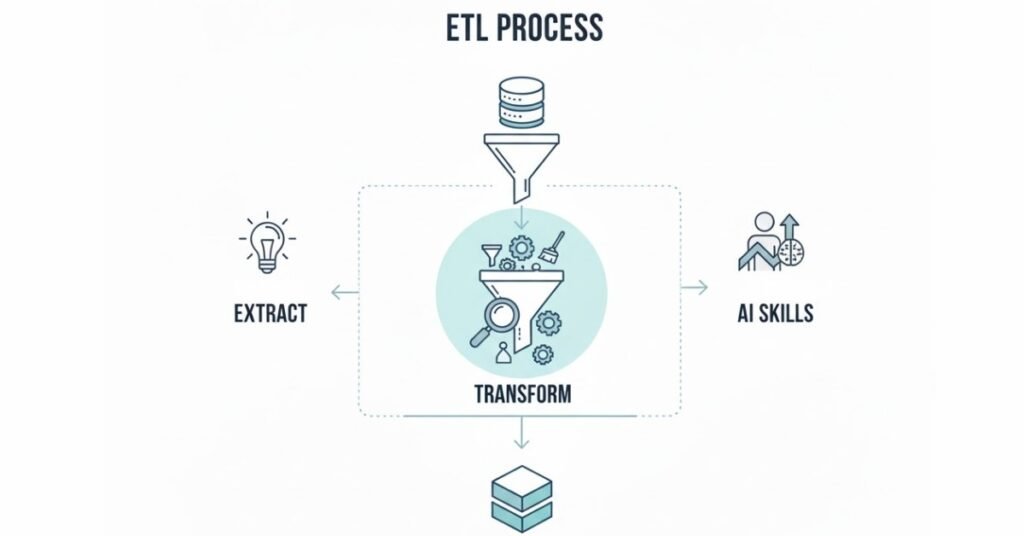
Q17. What is the ETL process?
ETL stands for Extract, Transform, Load. Extract means pulling data from various sources like databases or files. Transform involves cleaning, formatting, and restructuring that data into a usable format. Load means putting the processed data into a destination system where it can be analyzed.
Q18. How do you handle missing data?
Several strategies exist. You can remove rows with missing values if there aren’t many. You might fill gaps with averages or most common values. Sometimes you use predictive models to estimate missing values. The choice depends on how much data is missing and why it’s missing.
Q19. What’s the difference between batch and real-time processing?
Batch processing analyzes data in chunks at scheduled times, like generating monthly sales reports overnight. Real-time processing analyzes data as it arrives, like fraud detection systems checking every transaction immediately. Batch is cheaper but slower, while real-time provides immediate insights but costs more.
Q20. What does data transformation involve?
Data transformation reshapes information to make it analysis-ready. This includes converting data types, standardizing units of measurement, creating new calculated fields, normalizing values to consistent scales, aggregating details into summaries, and restructuring data layouts to match analysis requirements.
Q21. How does Microsoft Copilot help with data cleansing?
Copilot understands natural language requests like “remove duplicates” or “fill missing values with averages.” It can automatically detect data quality issues, suggest cleaning steps, execute transformations, and explain what it did. This speeds up cleaning work significantly compared to manual methods.
Q22. What are common data sources for analytics?
Data comes from databases (SQL, NoSQL), flat files (CSV, Excel), APIs that provide structured data feeds, web scraping from websites, IoT sensors generating continuous measurements, social media platforms, cloud storage systems, and enterprise applications like CRM or ERP systems.
Q23. How do you identify outliers in a dataset?
Statistical methods like calculating values beyond three standard deviations from the mean work well. Visual methods using box plots clearly show outliers as points outside the whiskers. Domain knowledge helps too – if you’re analyzing salaries and see someone earning one dollar, that’s likely an error worth investigating.
Q24. What is data aggregation?
Data aggregation combines detailed information into summaries. Instead of individual daily sales transactions, you might aggregate to weekly or monthly totals. Common aggregation functions include summing values, counting occurrences, finding averages, and identifying minimum or maximum values within groups.
Q25. Why is data quality important?
Poor quality data leads to incorrect conclusions and bad business decisions. The principle “garbage in, garbage out” applies – if your input data is flawed, your analysis results will be unreliable. Investing time in data quality upfront saves money and reputation downstream when decisions are made.w334
Section 4: Exploratory Data Analysis (EDA)
Q26. What is Exploratory Data Analysis?
EDA is like getting to know your data before diving into detailed analysis. You examine the structure, check data types, calculate basic statistics, create visualizations, and look for patterns or anomalies. It’s your first impression that guides what deeper analysis makes sense.
Q27. Why do we need exploratory analysis?
EDA helps you understand what you’re working with before making assumptions. You discover data quality issues, spot interesting relationships, identify which variables matter most, understand distributions and ranges, and uncover unexpected patterns that might completely change your analysis approach.
Q28. What’s the difference between graphical and non-graphical EDA?
Non-graphical EDA uses summary statistics like means, medians, counts, and percentiles to understand data numerically. Graphical EDA creates charts and plots to visualize distributions, trends, and relationships. Both approaches complement each other – numbers provide precision while visuals reveal patterns.
Q29. What are common chart types used in EDA?
Histograms show distribution of single variables. Scatter plots reveal relationships between two variables. Box plots display ranges and outliers. Bar charts compare categories. Line graphs show trends over time. Heatmaps visualize correlations between multiple variables. Each chart type answers different questions about your data.
Q30. How do you identify patterns in data?
Look for trends where values consistently increase or decrease. Check for seasonality where patterns repeat at regular intervals. Examine clusters where data points group together. Spot correlations where variables move together. Use visualization to make these patterns visually obvious.
Q31. What does data distribution tell you?
Distribution shows how values spread across the range. Normal distributions are bell-shaped with most values near the center. Skewed distributions lean toward one end. Understanding distribution helps you choose appropriate analysis methods and identify whether data behaves as expected.
Q32. How does AI assist with exploratory analysis?
AI tools quickly generate comprehensive EDA reports, create multiple visualizations automatically, identify statistically significant patterns, suggest which variables correlate strongest, highlight anomalies that need attention, and provide natural language summaries of findings that non-technical stakeholders can understand.
Q33. What is correlation and why does it matter?
Correlation measures how two variables move together. Positive correlation means they increase together, like temperature and ice cream sales. Negative correlation means one increases while the other decreases, like temperature and hot chocolate sales. Understanding correlations helps predict behavior and find relationships.
Q34. How do you handle categorical data differently from numerical data?
Numerical data uses mathematical operations like averaging or summing. Categorical data requires frequency counts, mode calculations, and grouping operations. You visualize numbers with histograms and scatter plots, while categories work better with bar charts and pie charts. Analysis approaches differ significantly.
Q35. What insights can you gain from examining data ranges?
Data ranges show the spread between minimum and maximum values. Narrow ranges suggest consistency while wide ranges indicate variability. Unexpected ranges often reveal data quality issues – like ages over 150 or negative prices. Understanding ranges helps set realistic expectations for analysis.

Section 5: Statistics for Data Analytics
Q36. Why do data analysts need statistics?
Statistics provides the mathematical foundation for drawing conclusions from data. It helps you determine whether patterns are genuine or just random chance, quantify uncertainty in predictions, compare different groups objectively, and make evidence-based recommendations with confidence levels attached.
Q37. What’s the difference between descriptive and inferential statistics?
Descriptive statistics summarize what happened in your data – like average sales or customer counts. Inferential statistics use sample data to make predictions or draw conclusions about larger populations – like predicting next quarter’s sales based on current trends or determining if a marketing campaign truly improved conversions.
Q38. Explain mean, median, and mode in practical terms.
Mean is the average – add all values and divide by count. Median is the middle value when sorted. Mode is the most frequent value. If five people earn 30k, 35k, 40k, 45k, and 200k, the mean is 70k (affected by the outlier), median is 40k (typical), and there’s no repeating mode.
Q39. What is standard deviation?
Standard deviation measures how spread out values are from the average. Low standard deviation means values cluster tightly around the mean – like heights of kindergarteners being similar. High standard deviation means values vary widely – like incomes across all professions. It quantifies consistency or variability.
Q40. What is a normal distribution?
Normal distribution creates the classic bell curve where most values cluster around the average and fewer values appear at extremes. Many natural phenomena follow this pattern – heights, test scores, measurement errors. The normal distribution has predictable properties that make statistical analysis easier.
Q41. How do you interpret correlation coefficients?
Correlation coefficients range from -1 to +1. Values near +1 indicate strong positive correlation – variables increase together. Values near -1 show strong negative correlation – one increases while the other decreases. Values near zero suggest no linear relationship. Above 0.7 or below -0.7 generally indicates strong correlation.
Q42. What is hypothesis testing?
Hypothesis testing is a structured way to determine if observed patterns are statistically significant or just random chance. You start with a null hypothesis (no effect exists), collect data, calculate probabilities, and decide whether evidence is strong enough to reject the null hypothesis in favor of an alternative explanation.
Q43. What are Type I and Type II errors?
Type I error means rejecting a true null hypothesis – like declaring a treatment works when it actually doesn’t. Type II error means failing to reject a false null hypothesis – like saying a treatment doesn’t work when it actually does. Both errors have consequences that analysts must balance.
Q44. What is regression analysis used for?
Regression analysis models relationships between variables to make predictions. Simple linear regression predicts one variable based on another, like predicting house prices from square footage. Multiple regression uses several predictors. It quantifies relationships and creates formulas for forecasting future values.
Q45. How does AI help with statistical analysis?
AI tools automatically calculate complex statistics, run hypothesis tests, perform regression analysis, generate statistical reports, visualize distributions and relationships, interpret results in plain language, and recommend appropriate statistical tests based on data characteristics and analysis goals.

Section 6: Excel and Copilot for Data Analysis
Q46. Why is Excel still important for data analysts?
Excel remains universally accessible, requires no coding knowledge, handles moderate datasets efficiently, integrates with other tools easily, allows quick ad-hoc analysis, creates professional visualizations, and most business professionals already understand it. It’s often the starting point before moving to specialized tools.
Q47. What are pivot tables and when should you use them?
Pivot tables dynamically summarize large datasets by dragging fields into rows, columns, and values. They’re perfect for answering questions like “what’s the total sales by region and product category?” or “how many customers fall into each age group?” They transform detailed data into digestible summaries quickly.
Q48. Explain VLOOKUP in practical terms.
VLOOKUP searches for a value in the first column of a table and returns corresponding information from another column. Imagine having a customer ID and needing their email address from a different table. VLOOKUP finds that ID and retrieves the associated email automatically.
Q49. What’s the difference between VLOOKUP and INDEX-MATCH?
VLOOKUP only searches left to right and struggles with large datasets. INDEX-MATCH is more flexible, searches in any direction, handles changing column positions better, and performs faster on big tables. INDEX finds the row, MATCH finds the column, and together they retrieve any cell value.
Q50. How do Excel formulas differ from DAX in Power BI?
Excel formulas calculate row by row or across ranges within single sheets. DAX (Data Analysis Expressions) operates on entire columns and tables, understands relationships between tables, calculates across filtered contexts, and provides more powerful aggregation functions designed specifically for business intelligence scenarios.
Q51. What are the most useful Excel functions for data analysts?
SUMIF and SUMIFS for conditional totals. COUNTIF for counting matching records. IF statements for logic. TEXT functions like LEFT, RIGHT, and CONCATENATE for string manipulation. DATE functions for time calculations. Statistical functions like AVERAGE, MEDIAN, and STDEV for analysis. IFERROR for handling errors gracefully.
Q52. How does Copilot enhance Excel productivity?
Copilot understands natural language requests like “calculate year-over-year growth” and writes the formulas for you. It suggests analysis approaches, creates pivot tables from descriptions, generates visualizations, explains complex formulas in plain English, and automates repetitive data manipulation tasks with simple prompts.
Q53. What is conditional formatting and how is it useful?
Conditional formatting automatically colors cells based on their values – like highlighting sales above target in green and below target in red. It creates data bars, color scales, and icon sets that make patterns instantly visible without reading individual numbers. Your eyes quickly spot what matters.
Q54. How do you connect Excel to external data sources?
Excel’s Get Data feature connects to databases, web APIs, SharePoint lists, text files, and cloud services. Power Query then transforms that connected data – cleaning, reshaping, and combining sources. Connections can refresh automatically, ensuring your Excel analysis always reflects current information.
Q55. What are Excel array formulas?
Array formulas perform calculations on multiple values simultaneously, returning either single results or arrays of results. They’re powerful for complex calculations that traditional formulas can’t handle, like finding values matching multiple criteria or performing matrix operations. Modern Excel’s dynamic arrays make them easier to use.

Section 7: SQL for Data Analysts
Q56. Why must data analysts learn SQL?
SQL is the universal language for retrieving data from databases where most business information lives. Analysts can’t always rely on someone else extracting data for them. SQL skills mean independence – you directly query databases, combine tables, filter millions of rows, and get exactly the data needed for analysis.
Q57. What’s the difference between SQL and NoSQL databases?
SQL databases organize data in structured tables with predefined relationships, like customer tables linking to order tables. NoSQL databases store data more flexibly in documents, key-value pairs, or graphs. SQL excels for transactional business data while NoSQL handles unstructured data and scales horizontally more easily.
Q58. Explain the SELECT statement basics.
SELECT specifies which columns you want. FROM indicates which table contains the data. WHERE filters rows meeting conditions. ORDER BY sorts results. A basic query looks like: SELECT customer_name, total_spent FROM customers WHERE total_spent > 1000 ORDER BY total_spent DESC. This retrieves high-spending customers sorted by amount.
Q59. What are SQL joins and why are they important?
Joins combine data from multiple tables based on related columns. INNER JOIN returns only matching records. LEFT JOIN keeps all records from the left table plus matches from the right. RIGHT JOIN does the opposite. FULL JOIN includes everything. Joins let you assemble complete pictures from normalized database structures.
Q60. How do GROUP BY and aggregate functions work together?
GROUP BY clusters rows sharing common values. Aggregate functions like SUM, COUNT, AVG, MIN, and MAX then calculate across those groups. For example, “SELECT region, SUM(sales) FROM orders GROUP BY region” gives total sales per region. It’s essential for summary reporting and analysis.
Q61. What’s the difference between WHERE and HAVING clauses?
WHERE filters individual rows before grouping happens. HAVING filters grouped results after aggregation. Use WHERE to exclude specific records like “WHERE year = 2024.” Use HAVING to filter aggregated results like “HAVING SUM(sales) > 100000” to show only high-performing groups.
Q62. What are subqueries or nested queries?
Subqueries are queries inside other queries. The inner query runs first, its results feeding into the outer query. For example, finding customers who spent above average requires calculating the average first (subquery), then filtering customers against that value (main query). They break complex logic into manageable steps.
Q63. Explain window functions in SQL.
Window functions perform calculations across sets of rows related to the current row without collapsing them into groups. RANK assigns rankings, LAG accesses previous rows, LEAD accesses next rows, ROW_NUMBER assigns sequential numbers. They’re powerful for running totals, moving averages, and comparative analysis.
Q64. What are Common Table Expressions (CTEs)?
CTEs use the WITH clause to create temporary named result sets that exist only during query execution. They make complex queries readable by breaking logic into named steps. Instead of nested subqueries that are hard to understand, CTEs organize queries like paragraphs in an essay.
Q65. How does AI like Gemini help with SQL?
AI tools generate SQL queries from natural language descriptions, explain complex queries in plain English, debug syntax errors, optimize query performance, suggest better approaches, and even analyze query results. You describe what data you need, and AI writes the SQL code to retrieve it.
🗺️ Follow the Complete Data Analytics Roadmap
Beginner → Excel → SQL → Power BI → Tableau → Python → AI Tools.

Section 8: Power BI for Business Intelligence
Q66. What is Power BI and why is it popular?
Power BI is Microsoft’s business intelligence platform for transforming data into interactive visualizations and reports. It’s popular because it integrates seamlessly with Excel and other Microsoft products, has a user-friendly drag-and-drop interface, handles large datasets efficiently, and creates professional dashboards that update automatically when data changes.
Q67. What’s the difference between Power Query and Power BI Desktop?
Power Query is the data preparation engine that connects to sources, cleans data, and transforms it into analysis-ready format. Power BI Desktop is the full authoring environment where you also model relationships, create DAX calculations, build visualizations, and design reports. Power Query focuses on ETL while Desktop handles end-to-end BI development.
Q68. What is data modeling in Power BI?
Data modeling establishes relationships between tables so they work together logically. Instead of one massive table, you create separate tables for customers, products, and sales, then define how they relate. Good models follow star or snowflake schemas, improve performance, and make DAX calculations work correctly.
Q69. Explain star schema and snowflake schema.
Star schema has a central fact table (like sales transactions) connected directly to dimension tables (like customers, products, dates). Snowflake schema normalizes dimensions into multiple related tables. Star schemas are simpler and faster for queries. Snowflake schemas reduce data redundancy but increase complexity.
Q70. What is cardinality in relationships?
Cardinality defines how rows in related tables connect. One-to-many is most common – one customer makes many orders. Many-to-many relationships require bridge tables to avoid calculation issues. One-to-one relationships are rare. Understanding cardinality ensures your data model calculates correctly and filters propagate properly.
Q71. What are calculated columns versus measures in DAX?
Calculated columns compute values row-by-row during data refresh and store results in the model, increasing file size. Measures calculate dynamically when needed based on filter context, don’t store values, and perform better. Use calculated columns for static attributes like age categories and measures for dynamic aggregations like total sales.
Q72. What is filter context in DAX?
Filter context determines which data subset DAX measures calculate against. When you slice a report by region, measures automatically calculate for that region only. Understanding filter context is crucial because the same measure formula produces different results depending on slicers, filters, and visual selections applied.
Q73. What are time intelligence functions?
Time intelligence functions analyze data across time periods. TOTALYTD calculates year-to-date totals. SAMEPERIODLASTYEAR compares to last year. DATEADD shifts time periods. These functions require a proper date table but then enable powerful time-based analysis like month-over-month growth or quarterly comparisons with simple formulas.
Q74. How do you optimize Power BI performance?
Reduce data model size by removing unnecessary columns and rows. Use star schemas instead of snowflake. Choose proper data types. Create aggregated tables for large datasets. Optimize DAX calculations by avoiding calculated columns when measures work. Minimize visual counts per page. Use DirectQuery or composite models when appropriate.
Q75. How does Copilot integrate with Power BI?
Copilot in Power BI generates DAX measures from natural language, creates narratives summarizing visual insights, suggests questions to explore data further, builds quick visualizations from descriptions, and explains what your data shows in accessible language that non-technical stakeholders can understand and act upon.

Section 9: Tableau for Data Visualization
Q76. How does Tableau differ from Power BI?
Tableau excels at exploration and sophisticated visualizations with superior design flexibility. Power BI integrates better with Microsoft ecosystems and costs less for existing Office 365 users. Tableau handles larger datasets more smoothly. Power BI’s DAX is more powerful for complex business logic. Both create professional dashboards but serve slightly different needs.
Q77. What are dimensions and measures in Tableau?
Dimensions are qualitative fields that categorize data – like product names, regions, or dates. Measures are quantitative fields that you aggregate – like sales amounts, quantities, or profits. Tableau treats them differently: dimensions create headers and groups while measures get summed, averaged, or counted.
Q78. What’s the difference between continuous and discrete fields?
Continuous fields show infinite possible values along a spectrum, creating axes with smooth gradients – like temperature or sales amounts. Discrete fields have distinct separate values, creating headers and categorical bins – like product categories or months. The difference affects how Tableau visualizes and calculates with these fields.
Q79. What are Level of Detail (LOD) expressions?
LOD expressions calculate at specified granularity levels independent of visual filter context. FIXED calculations ignore filters. INCLUDE calculations add dimensions. EXCLUDE calculations remove dimensions. They solve complex scenarios like calculating customer lifetime value while showing individual transaction details, where normal calculations struggle.
Q80. How do Tableau parameters enhance interactivity?
Parameters are dynamic input values that users control through dropdown menus or sliders. They switch between metrics (show revenue or profit), adjust calculations (change threshold values), alter visual properties (control number of top items displayed), and enable what-if scenarios where users test different assumptions interactively.
Q81. What are sets in Tableau?
Sets are custom fields defining which members of a dimension belong based on conditions. Create a set of “Top 10 Customers” that automatically updates as data changes. Sets enable dynamic highlighting, show in/out comparisons, and create sophisticated filters that traditional filtering methods can’t accomplish.
Q82. Explain the order of operations in Tableau.
Tableau processes filters in sequence: extract filters, data source filters, context filters, dimension filters, measure filters, table calculation filters, and finally trend and reference lines. Understanding this order helps troubleshoot unexpected results when multiple filters interact with each other.
Q83. What are table calculations?
Table calculations compute against values already aggregated and displayed in the view, creating calculations like running totals, percent of total, rank, moving averages, and differences. They operate on the query results rather than the raw data, enabling sophisticated analysis on already summarized information.
Q84. How do you create effective dashboards in Tableau?
Effective dashboards answer specific business questions clearly. Limit to 3-5 key visuals to avoid overwhelming users. Use consistent colors and formatting. Make filters prominent and intuitive. Arrange logically with the most important information top-left. Add context with titles and annotations. Test with actual users and iterate based on feedback.
Q85. What is the difference between live connection and extract?
Live connections query the database in real-time, always showing current data but depending on database performance. Extracts create local snapshots that load much faster and enable offline access but require scheduled refreshes. Choose based on whether you need absolute real-time data versus faster performance.

Section 10: Python for Data Analysis
Q86. Why should data analysts learn Python?
Python automates repetitive tasks, handles datasets too large for Excel, performs advanced statistical analysis, creates customized visualizations, integrates with AI tools, and opens doors to machine learning. It’s versatile, has extensive libraries for data work, and once learned significantly increases your analytical capabilities and career options.
Q87. What are the key Python libraries for data analysis?
Pandas provides dataframes for tabular data manipulation. NumPy handles numerical arrays efficiently. Matplotlib and Seaborn create visualizations. SciPy offers statistical functions. Scikit-learn enables machine learning. Each library specializes in different aspects of data work, and together they form a complete analytical toolkit.
Q88. What is a Pandas DataFrame?
DataFrames are two-dimensional tables in Python similar to Excel sheets or SQL tables. They have labeled rows and columns, support mixed data types, enable filtering and grouping, handle missing values, and provide methods for data manipulation. They’re the primary data structure for analysis in Python.
Q89. How do you handle missing values in Pandas?
Methods include dropna() to remove rows or columns with missing values, fillna() to replace missings with specific values like mean or median, interpolate() to estimate values based on surrounding data, and forward fill or backward fill to propagate last known values. Choose based on your data context and analysis needs.
Q90. What’s the difference between loc and iloc in Pandas?
loc selects data by label – like df.loc[‘row5’, ‘column_name’]. iloc selects by integer position – like df.iloc for the 5th row and 3rd column. Use loc when working with meaningful labels and iloc when position matters, like selecting every other row.
Q91. How do you merge or join DataFrames in Pandas?
The merge() function combines DataFrames like SQL joins based on common columns. Inner join keeps only matches. Left join keeps all left DataFrame rows. Right join keeps all right rows. Outer join keeps everything. concat() stacks DataFrames vertically or horizontally. join() merges on index by default.
Q92. What are lambda functions and when are they useful?
Lambda functions are small anonymous functions defined inline without formal def statements. They’re perfect for quick operations like df[‘price’].apply(lambda x: x * 1.1) to increase prices by 10%. Use them for simple transformations that don’t need full function definitions with names.
Q93. How do you create visualizations with Matplotlib?
Basic workflow: import matplotlib.pyplot, prepare data, call plotting functions like plt.plot() for line charts or plt.bar() for bar charts, customize with labels, titles, colors, and legends, then plt.show() displays the result. It provides fine-grained control over every visual element.
Q94. What makes Seaborn different from Matplotlib?
Seaborn builds on Matplotlib with prettier default styles, simplified syntax for common statistical plots, better color palettes, and built-in themes. While Matplotlib offers more control, Seaborn creates publication-ready statistical visualizations with less code. They often work together – Seaborn for quick attractive plots, Matplotlib for customization.
Q95. How does AI assist Python coding for data analysis?
AI tools generate Python code from natural language descriptions, debug errors with explanations, suggest more efficient coding approaches, explain complex code in plain English, auto-complete code as you type, create entire analysis workflows, and answer specific Python questions instantly without searching documentation.

Section 11: Big Data Analytics
Q96. What qualifies as Big Data?
Big Data exceeds traditional database capacity in volume (massive size), velocity (rapid generation), variety (diverse formats), veracity (uncertain quality), and value (hidden insights). Think terabytes or petabytes of data – social media posts, IoT sensor readings, clickstream logs – that require distributed computing systems to process effectively.
Q97. What is Hadoop and why was it revolutionary?
Hadoop enabled processing enormous datasets by distributing work across clusters of commodity computers instead of requiring expensive supercomputers. Its HDFS (Hadoop Distributed File System) stores data across multiple machines, while MapReduce processes data in parallel. This democratized big data analytics by making it affordable and scalable.
Q98. How does MapReduce work conceptually?
MapReduce breaks big jobs into smaller pieces. The Map phase processes data chunks in parallel across multiple machines, extracting key information. The Reduce phase aggregates those results into final output. Like counting words in books – each person (mapper) counts their assigned book, then one person (reducer) totals everyone’s counts.
Q99. What is Apache Spark and how does it improve on Hadoop?
Spark processes data in-memory rather than writing intermediate results to disk like MapReduce does. This makes Spark up to 100x faster for iterative algorithms. Spark also unifies batch processing, streaming, SQL queries, machine learning, and graph processing in one framework with simpler APIs than Hadoop’s ecosystem.
Q100. What is Spark SQL?
Spark SQL applies SQL queries against large distributed datasets. You can query data in HDFS, Hive tables, Parquet files, and more using familiar SQL syntax while Spark handles parallelizing execution across clusters. It bridges the gap between traditional SQL analysts and big data technologies.
Q101. What is Apache Hive?
Hive creates a SQL-like interface on top of Hadoop, letting you query massive datasets using familiar SQL syntax called HiveQL. It’s perfect for analysts who know SQL but not complex programming. Hive translates your queries into MapReduce or Spark jobs behind the scenes, making big data accessible to traditional database users.
Q102. What’s the difference between vertical and horizontal scaling?
Vertical scaling means upgrading a single machine with more CPU, RAM, or storage – like buying a faster computer. Horizontal scaling adds more machines to distribute the workload – like hiring more workers. Big data requires horizontal scaling because one computer, no matter how powerful, can’t handle petabytes of information efficiently.
Q103. How does distributed computing help with large datasets?
Distributed computing splits massive jobs across multiple computers working simultaneously. Instead of one machine taking days to process terabytes, hundreds of machines each handle small chunks and complete the work in hours. It’s like having a hundred people each read one chapter instead of one person reading the entire encyclopedia.
Q104. What is HDFS and how does it store data?
HDFS (Hadoop Distributed File System) breaks files into blocks and stores copies across multiple machines for reliability. If one server fails, your data survives on others. Large files get split into 128MB or 256MB chunks, distributed across the cluster, enabling parallel processing and fault tolerance automatically.
Q105. What are the components of Apache Spark?
Spark Core handles basic operations and task scheduling. Spark SQL enables structured data queries. Spark Streaming processes real-time data feeds. MLlib provides machine learning algorithms. GraphX analyzes graph structures. This unified framework means you can handle diverse analytics tasks without switching between different tools.

Section 12: Advanced Excel Questions
Q106. How do Power Query transformations differ from formulas?
Power Query transformations are applied once during data refresh and don’t exist in cells. Formulas recalculate whenever data changes and live in specific cells. Power Query is better for repeatable ETL processes – like cleaning monthly imports. Formulas work better for dynamic calculations that need to respond to user inputs immediately.
Q107. What is Power Pivot and when should you use it?
Power Pivot extends Excel with database-like capabilities – creating relationships between tables, handling millions of rows, and using DAX for complex calculations. Use it when regular Excel limits are exceeded, when you need to combine multiple tables efficiently, or when building sophisticated data models that regular pivot tables can’t handle.
Q108. How do you create dynamic named ranges?
Dynamic named ranges automatically expand as data grows using formulas like OFFSET or Excel’s Table feature. Instead of updating range references manually each month when new rows appear, dynamic ranges adjust automatically. This makes formulas, charts, and pivot tables self-maintaining as your dataset expands.
Q109. What are array formulas and their modern alternatives?
Traditional array formulas required Ctrl+Shift+Enter and showed curly braces. Modern Excel’s dynamic arrays automatically spill results into multiple cells without special entry. Functions like FILTER, SORT, UNIQUE, and SEQUENCE return arrays naturally. They’re more intuitive and powerful for operations like extracting matching records or generating sequences.
Q110. How do you use Excel for statistical hypothesis testing?
Excel’s Data Analysis Toolpak provides t-tests, ANOVA, regression, and other statistical tests. Functions like T.TEST, CHISQ.TEST, and F.TEST perform hypothesis testing. You input sample data, specify test parameters, and Excel calculates p-values indicating whether results are statistically significant or due to chance.
Q111. What’s the difference between SUMIF and SUMIFS?
SUMIF handles one condition – like summing sales where region equals “North.” SUMIFS handles multiple conditions – summing sales where region is “North” AND product is “Laptops” AND month is “January.” SUMIFS syntax reverses the order, placing the sum range first, which confuses beginners but enables multiple criteria.
Q112. How do you handle circular references in Excel?
Circular references occur when formulas refer back to themselves directly or indirectly. Sometimes they’re intentional for iterative calculations like financial modeling. Enable iterative calculation in Excel options to resolve them. Otherwise, identify the circular chain using Excel’s trace precedents feature and restructure your formulas to break the loop.
Q113. What are Excel macros and when should you use them?
Macros record repetitive actions and replay them with one click, automating tasks like formatting reports, cleaning data, or generating charts. Use them for tasks you perform regularly with identical steps. However, modern alternatives like Power Query often handle data tasks better, and macros have security risks if received from untrusted sources.
Q114. How do you connect Excel to live SQL databases?
Excel’s Get Data feature connects to SQL servers using connection strings containing server address, database name, and authentication credentials. You can import tables, run custom SQL queries, or use stored procedures. Connections refresh on demand or scheduled intervals, ensuring your Excel analysis always reflects current database information.
Q115. What’s the purpose of data validation in Excel?
Data validation restricts what users can enter in cells, preventing errors at the source. Create dropdown lists limiting choices, set numeric ranges preventing impossible values, or require dates within specific periods. Validation improves data quality by making incorrect entries impossible rather than fixing them after entry.
Section 13: Advanced SQL Concepts
Q116. What are indexes and how do they improve query performance?
Indexes work like book indexes – instead of scanning every page, you jump to specific locations quickly. Database indexes store sorted copies of column values with pointers to actual rows. Queries using indexed columns run dramatically faster, especially with millions of rows. However, indexes slow down inserts and updates slightly and consume storage space.
Q117. What’s the difference between clustered and non-clustered indexes?
A table can have only one clustered index that physically orders rows by the indexed column – like a phone book sorted by last name. Non-clustered indexes create separate structures pointing to row locations – like book indexes pointing to page numbers. Clustered indexes are faster for range queries while non-clustered indexes support multiple search paths.
Q118. What are database views and their benefits?
Views are saved queries that act like virtual tables. They simplify complex queries by hiding joins and calculations, provide security by exposing only certain columns, ensure consistency when multiple users need the same derived data, and make database structures easier to work with by creating logical abstractions over physical tables.
Q119. What are stored procedures?
Stored procedures are pre-compiled SQL code saved in the database and executed by name. They accept parameters, contain logic with IF statements and loops, and return results. Benefits include better performance through compilation, reduced network traffic by executing complex operations server-side, and centralized business logic that multiple applications can call.
Q120. What’s the difference between DELETE and TRUNCATE?
DELETE removes rows one by one, can have WHERE clauses for conditional deletion, fires triggers, logs each deletion, and can be rolled back. TRUNCATE removes all rows at once, doesn’t support WHERE clauses, bypasses triggers, uses minimal logging, and is much faster for clearing entire tables. Choose based on whether you need selective or complete removal.
Q121. How do you optimize slow SQL queries?
Check execution plans to identify bottlenecks. Add indexes on frequently queried columns. Avoid SELECT * by specifying needed columns only. Use WHERE clauses to filter early. Replace subqueries with joins when possible. Limit result sets with pagination. Analyze table statistics. Rewrite complex queries more efficiently. Each optimization technique addresses different performance issues.
Q122. What are transactions and ACID properties?
Transactions group multiple operations into atomic units – either all succeed or all fail together. ACID means Atomicity (all or nothing), Consistency (valid state before and after), Isolation (concurrent transactions don’t interfere), and Durability (committed changes survive system failures). These properties ensure database reliability even under failure conditions.
Q123. What’s the difference between UNION and UNION ALL?
UNION combines results from multiple queries and removes duplicates automatically, requiring extra processing to compare and eliminate duplicate rows. UNION ALL simply appends all results without checking duplicates, executing much faster. Use UNION when duplicates are problematic, UNION ALL when you’re certain no duplicates exist or duplicates are acceptable.
Q124. How do self-joins work?
Self-joins treat the same table as two separate tables, joining it to itself. They’re useful for hierarchical data like employee-manager relationships where both exist in the same employees table. You must use aliases to distinguish between the “two” tables, like “SELECT e.name, m.name FROM employees e JOIN employees m ON e.manager_id = m.employee_id.”
Q125. What are trigger events and when do you use triggers?
Triggers automatically execute code when specific database events occur – BEFORE or AFTER INSERT, UPDATE, or DELETE operations. Use them for auditing changes, enforcing complex business rules, maintaining derived columns, or cascading updates across related tables. However, overusing triggers makes databases hard to debug and maintain.
Section 14: Power BI DAX and Advanced Topics
Q126. What’s the difference between calculated tables and calculated columns?
Calculated tables create entirely new tables using DAX expressions, often combining or filtering existing tables. Calculated columns add new columns to existing tables, computing row-by-row values. Both increase model size since values are stored. Use calculated columns for static attributes and measures for dynamic aggregations that don’t bloat your model.
Q127. How do CALCULATE and FILTER functions work together?
CALCULATE modifies filter context for measure calculations. FILTER returns a table of rows meeting specified conditions. Together, they create powerful dynamic calculations like “CALCULATE(SUM(Sales[Amount]), FILTER(Products, Products[Category]=”Electronics”)).” CALCULATE changes context, FILTER defines which rows qualify. Understanding this combination unlocks advanced DAX scenarios.
Q128. What are variables in DAX and why use them?
Variables store intermediate calculation results using VAR keyword, improving performance by avoiding repeated calculations and making formulas readable. Instead of writing the same complex expression multiple times, calculate once, store in a variable, then reference it. Variables also help debug complex measures by breaking logic into understandable steps.
Q129. Explain EARLIER function in DAX.
EARLIER accesses values from outer row contexts in nested calculations – typically in calculated columns referencing table-level aggregations. It’s confusing because “earlier” means “outer context” not “previous time.” Use it when calculated columns need to compare current rows against table-level aggregates, like ranking or calculating running totals within calculated columns.
Q130. What are bidirectional filters and when should you use them?
Bidirectional filters allow filter propagation in both directions across relationships. Normally filters flow from the “one” side to the “many” side. Bidirectional filtering enables reverse flow too. Use cautiously – they solve many-to-many scenarios and complex filtering needs but can cause ambiguous calculation results and performance issues if overused.
Q131. How do you handle many-to-many relationships in Power BI?
Power BI supports many-to-many relationships directly now, but they require careful implementation. Create bridge tables when needed, use bidirectional filtering cautiously, or leverage CALCULATE with explicit filter modifications. Document these relationships clearly because they can produce unexpected results if users don’t understand the underlying data model structure.
Q132. What’s the difference between RELATED and RELATEDTABLE?
RELATED retrieves single values from the “one” side of relationships for use in calculated columns on the “many” side – like getting product category while in the sales table. RELATEDTABLE returns entire tables from the “many” side when on the “one” side – useful in measures for aggregating related rows, like counting all sales for a specific product.
Q133. How do you create year-over-year comparisons in DAX?
Use SAMEPERIODLASTYEAR or DATEADD functions within CALCULATE to shift time periods. For example: “Sales LY = CALCULATE(SUM(Sales[Amount]), SAMEPERIODLASTYEAR(Dates[Date]))” creates a measure showing last year’s sales for any time period selected. Then calculate growth with “(Sales – Sales LY) / Sales LY” for percentage changes.
Q134. What are row context and filter context in DAX?
Row context occurs in calculated columns where DAX iterates through each row independently. Filter context determines which data subset measures calculate against based on slicers, filters, and visual selections. Understanding which context your calculation operates in is fundamental – measures use filter context while calculated columns use row context.
Q135. How do you optimize DAX performance?
Prefer measures over calculated columns to reduce model size. Use variables to avoid repeated calculations. Replace calculated columns with Power Query when possible. Avoid complex iterator functions over large tables. Use SUMMARIZE efficiently. Minimize use of RELATED and RELATEDTABLE in large datasets. Test measure performance with DAX Studio to identify bottlenecks.
Section 15: Tableau Advanced Concepts
Q136. What’s the difference between context filters and dimension filters?
Context filters are processed early and create dependency for all subsequent filters and sets. They’re useful when you need one filter to affect calculations used by other filters. Dimension filters process after context filters. Use context filters sparingly for performance-critical calculations requiring specific filter precedence in complex dashboards.
Q137. How do you create custom SQL connections in Tableau?
Instead of dragging tables, write custom SQL queries in the connection dialog. This lets you pre-aggregate data, join tables not supported by Tableau’s interface, filter data at source, or use database-specific functions. Custom SQL gives complete control but prevents some Tableau optimizations and reduces extract performance compared to native connections.
Q138. What are data blending limitations in Tableau?
Blending links data from different sources at aggregated levels only, doesn’t support all join types, requires one primary data source, and performs less efficiently than proper database joins. Blending works for quick analysis across disconnected sources but isn’t suitable for row-level integration. When possible, join data at source instead.
Q139. How do you publish and share Tableau dashboards?
Publish to Tableau Server or Tableau Cloud with appropriate permissions. Users access through web browsers without needing Desktop licenses. Set refresh schedules for live data or extracts. Configure user filters for row-level security. Export to PDF for static sharing. Embed in websites or applications using JavaScript API. Choose distribution method based on audience needs.
Q140. What are Tableau extensions and when do you use them?
Extensions are web applications integrated into dashboards, adding functionality beyond native Tableau features – like advanced filtering, custom visuals, integration with external APIs, or specialized calculations. Use extensions cautiously since they require additional permissions, may affect performance, and create dependencies on external code that could break with updates.
Q141. How do you create dashboard actions in Tableau?
Actions make dashboards interactive – clicking charts filters other visuals, highlights related data, or navigates to URLs. Filter actions pass selections between sheets. Highlight actions emphasize related marks. URL actions open websites with values embedded. Set actions control parameters. Actions transform static dashboards into exploratory analytics tools guiding users through insights.
Q142. What’s the difference between Tableau Prep and Tableau Desktop?
Tableau Prep focuses on data preparation – cleaning, reshaping, joining, and aggregating data with visual flow-based interfaces. Desktop focuses on analysis and visualization. Use Prep for repeatable ETL workflows that feed clean data to Desktop for sophisticated analysis. They complement each other in analytics workflows.
Q143. How do you handle slowly changing dimensions in Tableau?
Create separate historical records with effective date ranges, join to fact tables using date-aware logic, and use parameters or filters to select which version matters for analysis. Calculate fields can determine valid historical records. Maintain audit columns tracking changes. This preserves historical accuracy while supporting time-based analysis.
Q144. What are Tableau calculations versus database calculations?
Tableau calculations compute in memory after data extraction, offering flexibility and Tableau-specific functions but processing locally. Database calculations push computation to source databases using native SQL, leveraging database power and reducing data transfer but limiting function availability. Choose based on performance, complexity, and where computational resources exist.
Q145. How do you optimize large Tableau dashboards?
Limit marks displayed per chart. Use extracts instead of live connections. Filter data at source. Reduce number of worksheets. Hide unused fields. Optimize calculation efficiency. Use context filters strategically. Aggregate data appropriately. Minimize dashboard size. Each technique addresses different performance factors affecting user experience.
Section 16: Python for Data Analysis (Advanced)
Q146. What’s the difference between lists and NumPy arrays?
Lists are flexible Python structures holding mixed data types but slower for numerical operations. NumPy arrays require uniform data types, use less memory, and execute mathematical operations dramatically faster through vectorization. For data analysis with numbers, always prefer NumPy arrays. For mixed collections of objects, use lists.
Q147. How do you handle different file formats in Pandas?
Pandas provides read functions for each format – read_csv for CSV, read_excel for Excel, read_json for JSON, read_sql for databases, read_parquet for Parquet files. Each accepts format-specific parameters like delimiter, encoding, or sheet names. Choose formats based on size, speed requirements, and compatibility needs.
Q148. What’s the difference between apply, map, and applymap in Pandas?
apply() works on rows or columns of DataFrames. map() operates on Series only, transforming values element-wise. applymap() (deprecated in favor of map()) applies functions to every DataFrame element individually. Use apply for row/column-level operations, map for Series transformations, vectorized operations whenever possible for performance.
Q149. How do you work with datetime data in Pandas?
Convert to datetime type using pd.to_datetime(). Extract components like year, month, day using dt accessor – df[‘date’].dt.year. Calculate date differences creating timedelta objects. Resample time series data to different frequencies. Set datetime columns as index for time-based selection. Pandas’ datetime functionality makes time series analysis straightforward.
Q150. What is method chaining in Pandas?
Method chaining applies multiple operations in sequence without intermediate variables – df.dropna().sort_values(‘column’).reset_index(). It creates concise, readable code but can be harder to debug. Use parentheses to split chains across lines for readability. Balance between conciseness and clarity based on code complexity.
Q151. How do you create pivot tables in Pandas?
Use pivot_table() method specifying index (rows), columns, values to aggregate, and aggregation function. Like Excel pivot tables but in code. “df.pivot_table(index=’Region’, columns=’Product’, values=’Sales’, aggfunc=’sum’)” creates sales summary by region and product. Add margins=True for totals.
Q152. What’s the difference between concat and merge in Pandas?
concat() stacks DataFrames vertically or horizontally without matching on columns – simple concatenation. merge() joins DataFrames like SQL based on key columns – matching rows with common values. Use concat to append datasets, merge to combine related tables using relationships.
Q153. How do you handle categorical data in Python?
Convert categorical variables to category dtype for memory efficiency. Use one-hot encoding with pd.get_dummies() to create binary columns for each category. Label encoding assigns numeric codes. Ordinal encoding maintains order for ranked categories. Choice depends on whether machine learning models or statistical analysis will consume the data.
Q154. What are Pandas groupby operations?
groupby() splits data into groups based on column values, applies functions to each group, then combines results. It’s like SQL GROUP BY. Chain with aggregation functions – count(), sum(), mean(), or custom functions. Transform returns same-shaped data. Filter selects entire groups meeting conditions. Essential for summary statistics and analysis.
Q155. How do you create custom visualizations in Matplotlib?
Combine basic plotting functions with customization – set figure size, add subplots, customize colors and line styles, adjust axes, add labels and legends, include annotations, modify fonts and sizes. Save figures with savefig(). Understanding Matplotlib’s object hierarchy (Figure, Axes) enables complete control over every visual element.
Section 17: Statistics Application Questions
Q156. When do you use mean versus median?
Use mean for symmetric distributions without extreme outliers – it represents the mathematical average. Use median for skewed distributions or when outliers exist – it represents the typical middle value resistant to extremes. Income data typically uses median because billionaires skew mean upward. Test scores often use mean assuming normal distribution.
Q157. What is statistical significance and how do you interpret p-values?
Statistical significance indicates whether observed effects are likely genuine versus random chance. P-values below your significance threshold (commonly 0.05) suggest results aren’t due to chance alone. A p-value of 0.03 means 3% probability of seeing these results if no real effect exists. Lower p-values indicate stronger evidence.
Q158. What’s the difference between correlation and causation?
Correlation means two variables move together – ice cream sales and drowning rates both increase in summer. Causation means one directly causes the other. Correlation doesn’t prove causation – both could be caused by a third factor (hot weather). Establishing causation requires controlled experiments, not just observational correlations.
Q159. How do you handle outliers in statistical analysis?
First understand if outliers are errors or genuine extreme values. Remove data entry errors. Keep genuine extremes but consider robust statistics like median instead of mean. Transform data using log scales. Use outlier-resistant statistical methods. Create separate analyses with and without outliers. Document your approach and justify decisions.
Q160. What is confidence interval and how do you interpret it?
Confidence intervals provide ranges likely containing true population parameters. A 95% confidence interval means if you repeated sampling 100 times, 95 intervals would capture the true value. Wider intervals indicate more uncertainty. They’re more informative than point estimates alone, communicating both estimate and precision.
Q161. When do you use t-tests versus ANOVA?
T-tests compare means between two groups – like testing if a new drug differs from placebo. ANOVA compares means across three or more groups simultaneously – like comparing multiple drug doses. Use t-tests for two-group comparisons, ANOVA for multi-group comparisons. ANOVA prevents inflated error rates from multiple t-tests.
Q162. What is regression coefficient interpretation?
Regression coefficients show how much the dependent variable changes per unit increase in independent variable, holding others constant. A coefficient of 2.5 for “square footage” in home price regression means each additional square foot increases price by $2,500 on average. Positive coefficients indicate positive relationships, negative coefficients inverse relationships.
Q163. What assumptions underlie linear regression?
Linear relationship between variables. Independent observations. Homoscedasticity – constant variance of residuals. Normally distributed residuals. No multicollinearity between predictors. Violations affect reliability – test assumptions with diagnostic plots. Transform variables or use alternative methods when assumptions fail.
Q164. What is sampling bias and how do you avoid it?
Sampling bias occurs when sample doesn’t represent the population accurately – like surveying only landline phones missing cell-only users. Use random sampling ensuring every population member has equal selection probability. Stratified sampling ensures subgroup representation. Acknowledge limitations when perfect random sampling is impossible.
Q165. How do you determine appropriate sample size?
Larger samples increase precision and statistical power but cost more. Calculate based on desired confidence level, acceptable margin of error, expected variance, and effect size you want to detect. Statistical power analysis guides sample size decisions balancing precision needs against resource constraints.

Section 18: Real-World Scenario Questions
Q166. How would you analyze customer churn?
Start by defining churn clearly – cancelled subscriptions, inactive accounts, or non-renewal. Explore data to identify patterns – when do customers churn, what characteristics do churners share. Build predictive models identifying at-risk customers. Segment customers by churn risk. Recommend retention strategies targeting high-risk segments. Measure intervention effectiveness through A/B testing.
Q167. How would you measure marketing campaign effectiveness?
Define success metrics aligned with campaign goals – conversions, revenue, engagement. Set up proper tracking before launch. Compare treatment group receiving campaign against control group without exposure. Calculate lift, ROI, and statistical significance. Consider time lags between exposure and conversion. Account for confounding factors affecting both groups.
Q168. How would you approach pricing optimization analysis?
Analyze historical relationships between prices and sales volumes. Calculate price elasticity showing demand sensitivity. Segment customers by price sensitivity. Test different price points through controlled experiments. Consider competitor pricing and market conditions. Model profit impact, not just revenue. Recommend prices balancing volume and margin for profit maximization.
Q169. How would you analyze website conversion funnel?
Map customer journey from landing to conversion. Calculate drop-off rates at each stage. Identify bottleneck steps with highest abandonment. Segment users by traffic source, device, and behavior patterns. A/B test improvements at problematic steps. Use session recordings and heatmaps to understand user behavior. Prioritize fixes based on traffic volume and improvement potential.
Q170. How would you detect fraudulent transactions?
Analyze historical fraud patterns identifying suspicious characteristics – unusual amounts, locations, timing, or behavior. Build anomaly detection models flagging transactions deviating from normal patterns. Use supervised learning with labeled fraud examples. Implement real-time scoring systems. Balance fraud detection sensitivity against false positive rates that frustrate legitimate customers. Continuously retrain as fraud tactics evolve.
Q171. How would you forecast product demand?
Analyze historical sales patterns identifying trends, seasonality, and cyclical patterns. Consider external factors – promotions, weather, economic indicators, competitor actions. Test multiple forecasting methods – time series models, regression with predictors, machine learning algorithms. Evaluate accuracy using holdout samples. Create confidence intervals communicating uncertainty. Update forecasts regularly as new data arrives.
Q172. How would you analyze survey results?
Clean data checking for incomplete responses, straightlining, and quality issues. Calculate response rates and check for non-response bias. Analyze distributions, cross-tabulations, and correlations. Test hypotheses about group differences. Segment respondents identifying distinct viewpoints. Visualize key findings clearly. Translate statistical results into actionable business recommendations stakeholders can understand and implement.
Q173. How would you measure customer satisfaction?
Define satisfaction metrics – NPS scores, CSAT ratings, retention rates, support ticket volumes. Collect feedback through surveys, reviews, and behavioral data. Analyze drivers of satisfaction using regression or correlation analysis. Benchmark against competitors and industry standards. Identify at-risk segments requiring intervention. Track satisfaction trends over time monitoring improvement initiatives.
Q174. How would you optimize inventory levels?
Analyze historical demand patterns and variability. Calculate optimal reorder points balancing stockout risk against holding costs. Model lead time from suppliers. Segment products by importance using ABC analysis. Consider seasonal demand fluctuations. Build safety stock levels based on demand uncertainty. Recommend min-max levels for each product enabling automated reordering while minimizing costs.
Q175. How would you analyze employee attrition?
Define attrition clearly – voluntary departures, terminations, retirements. Calculate attrition rates by department, tenure, performance level. Identify patterns through survival analysis showing when attrition peaks. Survey departing employees understanding reasons. Build predictive models identifying flight-risk employees. Recommend retention strategies targeting high-risk high-value employees. Measure intervention effectiveness.
Section 19: Tool Selection and Best Practices
Q176. When should you use Excel versus more advanced tools?
Use Excel for quick ad-hoc analysis, datasets under 100,000 rows, sharing with non-technical stakeholders, simple calculations and pivots, or when advanced tools aren’t available. Move to SQL/Python/BI tools for datasets exceeding Excel’s limits, complex transformations, automated workflows, advanced statistics, or when reproducibility and version control matter.
Q177. How do you choose between Power BI and Tableau?
Power BI integrates better with Microsoft ecosystems, costs less with existing Office 365, uses familiar Excel-like DAX. Tableau offers superior design flexibility, handles larger datasets more smoothly, has stronger data prep capabilities. Choose based on existing technology stack, budget, user technical sophistication, visualization complexity needs, and dataset sizes.
Q178. When should you use Python versus R for analytics?
Python excels for production systems, automation, integration with applications, machine learning deployment, and when you need general-purpose programming alongside analytics. R excels for statistical analysis, academic research, specialized statistical techniques, and publication-quality visualizations. Many data scientists use both depending on project requirements.
Q179. How do you decide between SQL and NoSQL databases?
Use SQL databases for structured data with defined schemas, complex relationships requiring joins, ACID transaction requirements, and business intelligence workloads. Use NoSQL for unstructured or semi-structured data, flexible schemas, horizontal scalability needs, real-time applications, or when handling massive volumes with eventual consistency acceptable.
Q180. When should you build custom solutions versus using existing tools?
Use existing tools when they meet 80% of requirements – faster implementation, lower maintenance, proven reliability, community support. Build custom solutions only when unique requirements demand it, existing tools create significant constraints, competitive advantage depends on proprietary capabilities, or long-term costs justify development investment.
Section 20: Data Ethics and Governance
Q181. What is personally identifiable information (PII) and how do you handle it?
PII includes names, addresses, phone numbers, email addresses, social security numbers, and any data identifying specific individuals. Handle PII with encryption, access controls, audit logging, anonymization techniques, minimal data collection, secure storage, and compliance with regulations like GDPR and CCPA. Never store PII unnecessarily or expose it insecurely.
Q182. What are data governance principles?
Data governance establishes policies, procedures, roles, and responsibilities for managing organizational data assets. Core principles include data quality standards, security and privacy protection, defined ownership and stewardship, documented lineage and metadata, compliance with regulations, and clear processes for data access, usage, and lifecycle management.
Q183. How do you ensure data quality in analytics projects?
Implement validation rules at data entry points. Profile data regularly checking completeness, accuracy, consistency, and timeliness. Document data quality issues and remediation. Establish quality metrics and monitoring dashboards. Define ownership with accountability for quality. Automate quality checks in data pipelines. Treat data quality as ongoing process, not one-time task.
Q184. What is data lineage and why does it matter?
Data lineage traces data from origin through transformations to final consumption – documenting where data comes from, how it’s changed, and where it’s used. It enables impact analysis when sources change, supports regulatory compliance, helps debug data issues, builds user trust, and prevents incorrect business decisions based on misunderstood data.
Q185. How do you handle bias in data and analytics?
Recognize that historical data reflects past biases. Examine data collection methods for systematic exclusions. Check for representative sampling across demographic groups. Test model predictions across subgroups detecting disparate impact. Include diverse perspectives in problem framing. Document assumptions and limitations. Use fairness metrics evaluating algorithmic equity.

Section 21: Communication and Business Skills
Q186. How do you explain technical concepts to non-technical stakeholders?
Use analogies relating to familiar concepts. Focus on business implications rather than technical details. Create clear visualizations showing patterns visually. Avoid jargon or define necessary terms. Start with conclusions and recommendations, then provide supporting evidence. Check understanding through questions. Tailor complexity to audience technical sophistication.
Q187. How do you present conflicting data findings to leadership?
Acknowledge conflicts transparently rather than hiding them. Explain possible reasons – data quality issues, methodology differences, timing variations. Present evidence for each interpretation. Recommend additional analysis if needed for clarity. Communicate confidence levels honestly. Focus on implications for decisions regardless of which interpretation proves correct.
Q188. How do you prioritize competing analytics requests?
Assess business impact – which analysis drives most value. Consider urgency – time-sensitive decisions take priority. Evaluate complexity and required effort. Check for dependencies between requests. Communicate transparently about capacity and timelines. Negotiate scope reductions for lower-priority work. Document prioritization criteria ensuring consistent, defensible decisions.
Q189. How do you build stakeholder buy-in for data-driven recommendations?
Involve stakeholders early in problem framing. Share interim findings building understanding gradually. Connect recommendations directly to their goals and pain points. Quantify expected impacts in business terms. Address concerns proactively with data. Start with pilot programs demonstrating value. Celebrate wins publicly building momentum. Make stakeholders partners in analysis, not passive recipients.
Q190. How do you handle disagreement when stakeholders reject your analysis?
Listen to understand their concerns fully. Validate data and methodology objectively. Seek to understand their perspective and constraints you might have missed. Present alternative approaches or additional analysis addressing concerns. Acknowledge limitations honestly. Sometimes accept that decisions involve factors beyond data. Maintain relationships – today’s disagreement shouldn’t poison future collaboration.

Section 22: Career and Professional Development
Q191. What analytical skills are most important for data analysts?
SQL for data extraction and manipulation. Statistical thinking for drawing valid conclusions. Critical thinking for asking right questions. Business acumen for understanding problems and impact. Data visualization for communicating insights. Programming skills for automation and efficiency. Domain knowledge in your industry. Communication skills for influencing decisions. Continuous learning mindset.
Q192. How do you stay current with evolving analytics tools and techniques?
Follow industry blogs and newsletters. Take online courses on new tools and methods. Participate in data communities and forums. Attend conferences and webinars. Work on personal projects experimenting with new techniques. Read academic papers on cutting-edge methods. Network with other analysts sharing learnings. Dedicate regular time for professional development.
Q193. What certifications are valuable for data analysts?
Microsoft Power BI certification demonstrates BI tool expertise. Tableau certification validates visualization skills. Google Data Analytics certificate provides foundational knowledge. AWS or Azure data certifications show cloud analytics capabilities. Python or R certifications prove programming competency. Statistics certifications demonstrate analytical rigor. Choose based on career direction and employer preferences.
Q194. How do you build a strong analytics portfolio?
Work on diverse projects showcasing different skills – SQL, Python, visualization, statistics. Use publicly available datasets from Kaggle, government sources, or APIs. Document your process and thinking, not just final results. Create interactive dashboards demonstrating visualization skills. Write explanatory narratives showing communication ability. Publish on GitHub enabling sharing and demonstrating technical capability.
Q195. What soft skills differentiate successful data analysts?
Curiosity drives asking better questions. Communication translates technical findings into business language. Collaboration works effectively with diverse teams. Problem-solving approaches challenges methodically. Business acumen connects analysis to organizational goals. Attention to detail ensures accuracy. Time management handles multiple projects. Adaptability navigates changing priorities and technologies. Emotional intelligence builds relationships.
Section 23: Industry-Specific Questions
Q196. How does data analytics differ across industries?
Healthcare emphasizes patient outcomes, regulatory compliance, and privacy protection. Retail focuses on customer behavior, inventory optimization, and pricing. Finance prioritizes risk management, fraud detection, and regulatory reporting. Manufacturing optimizes supply chains, quality control, and predictive maintenance. Each industry has unique metrics, regulations, data sources, and decision drivers requiring specialized knowledge.
Q197. What analytics challenges are unique to e-commerce?
High-volume transactions requiring real-time processing. Multiple customer touchpoints across devices creating identity resolution challenges. Seasonal demand variations requiring flexible forecasting. Cart abandonment analysis understanding incomplete purchases. Product recommendation systems personalizing experiences. Attribution modeling across complex customer journeys. Inventory synchronization across channels. Conversion optimization testing site changes.
Q198. How is analytics used in healthcare?
Clinical decision support assists diagnosis and treatment selection. Population health management identifies at-risk patient groups. Operational analytics optimizes staffing, scheduling, and resource utilization. Cost analysis identifies efficiency opportunities. Readmission prediction enables proactive interventions. Treatment effectiveness research compares outcomes. Public health surveillance detects disease outbreaks. All while maintaining strict privacy protections.
Q199. What analytics applications exist in financial services?
Credit scoring predicts loan default risk. Fraud detection identifies suspicious transactions. Market analysis guides investment decisions. Risk management quantifies exposure. Customer segmentation enables targeted marketing. Churn prediction identifies at-risk accounts. Regulatory reporting ensures compliance. Algorithmic trading executes automated strategies. Portfolio optimization balances risk and return.
Q200. How does analytics support marketing functions?
Customer segmentation groups audiences for targeting. Campaign performance measurement tracks ROI. Attribution modeling assigns credit across touchpoints. Customer lifetime value predicts long-term revenue. Sentiment analysis monitors brand perception. Content effectiveness testing optimizes messaging. Channel mix optimization allocates budget. Predictive lead scoring prioritizes sales efforts.
Section 24: Emerging Trends and Future Skills
Q201. How is AI transforming data analytics?
AI automates data preparation, saving hours of cleaning work. Natural language querying lets non-technical users ask questions in plain English. Automated insight generation highlights important patterns analysts might miss. Predictive analytics becomes accessible without deep statistics knowledge. However, human judgment remains crucial for asking right questions, interpreting context, validating results, and making decisions.
Q202. What is augmented analytics?
Augmented analytics uses AI and machine learning to automate data preparation, insight generation, and insight explanation. It democratizes analytics by making sophisticated techniques accessible to business users without technical expertise. Tools suggest interesting analyses, automatically detect anomalies, generate natural language summaries, and recommend actions based on findings.
Q203. How will analytics roles evolve with increasing automation?
Routine tasks like data cleaning, basic reporting, and standard visualizations become automated. Analysts shift toward strategic work – framing business problems, designing analysis approaches, interpreting complex results in business context, and driving decision-making. Technical skills remain important but business acumen, communication, and critical thinking become increasingly differentiated.
Q204. What is the role of data storytelling?
Data storytelling transforms analytical findings into compelling narratives that drive action. It combines data visualization, narrative structure, and emotional connection to make insights memorable and persuasive. Effective data stories have clear structure, relevant context, visual evidence, and actionable conclusions. As data volumes grow, ability to distill insights into engaging stories becomes increasingly valuable.
Q205. How do you prepare for the future of analytics?
Master fundamentals – SQL, statistics, visualization – that transcend specific tools. Develop business acumen understanding how analytics creates value. Build communication skills translating technical findings into action. Embrace AI tools as amplifiers of your capabilities, not threats. Cultivate curiosity and continuous learning mindsets. Specialize in domain areas creating career differentiation. Stay adaptable as technologies and methods evolve.
🧩 Boost Your Hands-On Analytics Skills
Practice SQL, Python, Power BI, Tableau & real analytics tasks step-by-step.
2. 50 Self-Preparation Prompts Using ChatGPT
How to Use These Prompts Effectively
Copy these prompts directly into ChatGPT, Google Gemini, Microsoft Copilot, or any AI assistant. Each prompt is designed to help you practice, learn, and prepare thoroughly for different aspects of data analytics interviews. Feel free to modify them based on your specific needs or follow up with additional questions to dive deeper into any topic.
Category 1: Conceptual Understanding (Prompts 1-10)
Prompt 1: Data Analytics Fundamentals Explanation
Act as a data analytics instructor. Explain the following concepts in simple terms with real-world examples that a beginner can understand: descriptive analytics, diagnostic analytics, predictive analytics, and prescriptive analytics. Include one practical business scenario for each type showing how companies use them to make decisions.
Prompt 2: AI and Machine Learning Clarification
I’m preparing for a data analytics interview and often confuse AI, Machine Learning, Deep Learning, and Generative AI. Create a clear comparison table showing the differences, provide simple analogies for each, and explain which technologies are used in data analytics workflows. Include examples of tools in each category.
Prompt 3: Statistics Concept Deep Dive
Explain these statistical concepts as if you’re teaching someone without a math background: mean vs median vs mode, standard deviation, normal distribution, correlation vs causation, and p-values. For each concept, provide a practical example from everyday life and explain when a data analyst would use it.
Prompt 4: Data Quality Dimensions
I need to understand data quality for my interview. Explain the key dimensions of data quality: accuracy, completeness, consistency, timeliness, validity, and uniqueness. For each dimension, give me two examples – one showing good quality and one showing poor quality. Also explain how poor data quality impacts business decisions.
Prompt 5: ETL Process Breakdown
Break down the ETL (Extract, Transform, Load) process into detailed steps. For each phase, explain what happens, what tools are commonly used, what challenges analysts face, and provide a complete example of ETL in action using a retail company scenario. Make it interview-ready with technical terminology explained clearly.
Prompt 6: Database Types Comparison
Create a comprehensive comparison between SQL databases and NoSQL databases. Include when to use each, their strengths and weaknesses, examples of each type, and typical use cases in data analytics. Present this in a table format that I can memorize for interviews, then provide three scenario-based questions with answers.
Prompt 7: Big Data Concepts Simplified
Explain Big Data concepts including the 5 V’s (Volume, Velocity, Variety, Veracity, Value), distributed computing, Hadoop ecosystem, Apache Spark, and data lakes vs data warehouses. Use simple analogies and create a mind map structure showing how these concepts relate to each other. Include why these matter for modern data analysts.
Prompt 8: Data Visualization Best Practices
Teach me data visualization principles for interviews. Explain when to use different chart types (bar charts, line graphs, scatter plots, heatmaps, box plots), common visualization mistakes to avoid, how to choose colors effectively, and principles for creating dashboard layouts. Provide a decision tree for selecting appropriate visualizations based on data types and analysis goals.
Prompt 9: AI in Data Analytics Workflow
Explain how AI tools like ChatGPT, Microsoft Copilot, and Google Gemini are changing data analytics workflows. Cover data collection, cleaning, exploration, analysis, and presentation phases. For each phase, explain specific AI capabilities, provide example prompts an analyst might use, and discuss limitations. Help me articulate this in interviews when asked about AI integration.
Prompt 10: Data Governance and Ethics
Prepare me to answer interview questions about data ethics and governance. Cover topics like PII (Personally Identifiable Information), GDPR compliance, data privacy, bias in data and algorithms, responsible AI use, and data governance frameworks. Provide three common interview questions on these topics with detailed answers I can adapt.
Category 2: Technical Skill Practice (Prompts 11-25
Prompt 11: SQL Query Practice Generator
Generate 10 SQL practice scenarios with increasing difficulty levels. For each scenario, provide the business question, sample table structures, and the expected query solution. Start with simple SELECT and WHERE statements, progress to JOINs and GROUP BY, and end with complex queries using subqueries and window functions. Include explanations for each solution.
Prompt 12: Excel Formula Mastery
I need to master Excel formulas for my data analytics interview. Create a comprehensive guide covering VLOOKUP, INDEX-MATCH, SUMIFS, COUNTIFS, IF statements, array formulas, and text functions. For each formula, provide the syntax, explain each parameter, give three practical examples with different complexity levels, and common mistakes to avoid.
Prompt 13: Power BI DAX Practice
Act as a Power BI expert. Generate 8 DAX practice problems covering calculated columns, measures, time intelligence functions, CALCULATE, FILTER, and context transition. For each problem, describe the business requirement, provide sample data structure, write the complete DAX formula, and explain how it works step by step.
Prompt 14: Python Pandas Exercises
Create 10 Python Pandas exercises for data manipulation practice. Include scenarios for data loading, handling missing values, filtering and sorting, grouping and aggregation, merging dataframes, and data transformation. For each exercise, provide the problem statement, sample input data, expected output, and complete solution code with explanations.
Prompt 15: Tableau Calculation Practice
Generate 6 Tableau calculation scenarios covering table calculations, LOD expressions, parameters, and calculated fields. For each scenario, explain the business question, describe what calculation is needed, provide the calculation formula, and explain the logic. Include scenarios for ranking, running totals, percentage of total, and year-over-year comparisons.
Prompt 16: Data Cleaning Challenge
Present me with a messy dataset scenario containing missing values, duplicates, inconsistent formatting, outliers, and data type issues. Describe the raw data problems in detail, then provide step-by-step solutions using Excel, SQL, Python Pandas, and Power Query. Explain the pros and cons of each approach and when to use which tool.
Prompt 17: Statistical Analysis Scenarios
Create 5 statistical analysis scenarios I might face in interviews. Include problems requiring hypothesis testing, regression analysis, correlation analysis, confidence intervals, and A/B testing. For each scenario, provide the business context, available data, appropriate statistical test to use, step-by-step solution approach, and how to interpret results for business stakeholders.
Prompt 18: Database Design Practice
Give me a business scenario requiring database design. Walk me through creating an Entity-Relationship Diagram (ERD), defining tables with appropriate primary and foreign keys, establishing relationships, normalizing to third normal form, and writing CREATE TABLE statements. Explain the reasoning behind each design decision and common normalization mistakes.
Prompt 19: Data Transformation Challenges
Present 5 data transformation challenges involving converting wide data to long format, pivoting and unpivoting, creating calculated columns, handling date/time conversions, and string manipulation. Show solutions using both Excel Power Query and Python Pandas. Explain when each tool is more appropriate and efficiency considerations.
Prompt 20: Real-Time Data Processing
Explain real-time data processing concepts and create scenarios involving streaming data analysis. Cover topics like batch vs real-time processing, data ingestion methods, Apache Kafka basics, and real-time analytics use cases. Provide interview-ready explanations and examples from e-commerce, finance, and IoT domains showing when real-time processing is necessary.
Prompt 21: Advanced SQL Window Functions
Teach me SQL window functions in depth. Cover ROW_NUMBER, RANK, DENSE_RANK, NTILE, LAG, LEAD, and running aggregations. Create 6 business scenarios requiring window functions, provide the complete SQL queries, and explain how the OVER clause works with PARTITION BY and ORDER BY. Include comparison to GROUP BY approaches.
Prompt 22: Power BI Data Modeling
Create a comprehensive Power BI data modeling scenario. Describe multiple related tables (fact and dimension tables), guide me through creating relationships, explain cardinality and filter direction, demonstrate star schema design, and show how proper modeling affects DAX calculations. Include common modeling mistakes and how to avoid them.
Prompt 23: Python Data Visualization Practice
Generate 6 data visualization challenges using Python’s Matplotlib and Seaborn libraries. Include creating customized line charts, bar plots, scatter plots with regression lines, heatmaps for correlation matrices, distribution plots, and subplots. Provide complete code for each visualization with customization options for colors, labels, and styling.
Prompt 24: API Data Integration
Explain how to work with APIs for data collection and create practical examples. Cover REST API basics, authentication methods, making requests using Python’s requests library, handling JSON responses, error handling, and rate limiting. Provide a complete working example of pulling data from a public API, transforming it, and loading into a database or dataframe.
Prompt 25: Performance Optimization Techniques
Create scenarios demonstrating query and analysis performance optimization. Cover SQL query optimization (indexing, query rewriting, execution plans), Excel large dataset handling, Power BI performance tuning (calculated columns vs measures, aggregations), and Python code optimization (vectorization, efficient loops). Provide before and after examples showing performance improvements.
Category 3: Interview Scenario Practice (Prompts 26-35)
Prompt 26: Customer Churn Analysis Case Study
Present a complete customer churn analysis case study for interview practice. Describe the business context, available data, analysis approach, required data cleaning and preparation steps, exploratory analysis to conduct, predictive modeling considerations, insights to extract, and how to present recommendations to stakeholders. Walk me through this as if it’s a take-home interview assignment.
Prompt 27: Sales Performance Analysis
Create a sales performance analysis scenario for a retail company. Provide sample data structure, define business questions to answer (top products, regional performance, seasonal trends, sales rep analysis), and guide me through the complete analysis using SQL for data extraction, Excel/Power BI for analysis, and appropriate visualizations. Include executive summary recommendations.
Prompt 28: Marketing Campaign Effectiveness
Design an interview case study evaluating marketing campaign effectiveness. Describe campaign details, control vs treatment groups, available metrics, statistical significance testing requirements, ROI calculation methods, and customer segmentation analysis. Show how to analyze campaign data, calculate lift, determine statistical significance, and present findings with actionable recommendations.
Prompt 29: Pricing Optimization Problem
Present a pricing optimization scenario. Describe current pricing strategy, historical sales and price data, competitive context, and business objectives. Guide me through analyzing price elasticity, segmenting customers by price sensitivity, testing different pricing models, calculating profit impact, and making data-driven pricing recommendations. Include how to present trade-offs between volume and margin.
Prompt 30: Website Funnel Analysis
Create a complete website conversion funnel analysis case. Describe the e-commerce customer journey from landing to purchase, provide sample funnel metrics at each stage, show how to calculate drop-off rates, identify bottlenecks, segment users by traffic source and device, and recommend optimization priorities. Include visualization recommendations and A/B testing suggestions.
Prompt 31: Inventory Optimization Challenge
Design an inventory optimization scenario for interview practice. Describe the business context, historical demand patterns, current inventory challenges (stockouts vs excess inventory), cost considerations, and seasonality factors. Walk me through demand forecasting approaches, calculating optimal reorder points, safety stock calculations, and ABC analysis for inventory segmentation. Include practical recommendations.
Prompt 32: Fraud Detection Analysis
Create a fraud detection case study. Describe the business (banking, e-commerce, insurance), types of fraud encountered, available transaction and customer data, pattern recognition approaches, anomaly detection methods, and machine learning considerations. Show how to identify suspicious patterns, calculate fraud rates, balance detection sensitivity vs false positives, and create monitoring dashboards.
Prompt 33: Customer Segmentation Project
Present a customer segmentation analysis scenario. Describe the business objectives, available customer data (demographics, behavior, transactions), segmentation approaches (RFM analysis, clustering, behavioral segmentation), how to determine optimal number of segments, profiling each segment, and translating segments into actionable marketing strategies. Include visualization of segment characteristics.
Prompt 34: A/B Testing Design and Analysis
Create an A/B testing scenario from design through analysis. Describe the feature being tested, hypothesis formulation, sample size calculation, randomization strategy, success metrics, statistical test selection, analysis approach, interpretation of results including confidence intervals, and how to present findings to product teams. Include handling common complications like multiple testing and duration determination.
Prompt 35: Forecasting Project
Design a demand forecasting case study. Describe the business context (retail, manufacturing, or services), historical data patterns including trends and seasonality, external factors to consider, forecasting method selection (time series, regression, machine learning), model validation approaches, accuracy metrics, and how to communicate forecast uncertainty. Include scenario planning and sensitivity analysis.
Category 4: Behavioral and Situational Preparation (Prompts 36-43)
Prompt 36: STAR Method Response Generator
Help me prepare STAR method responses for behavioral interview questions. Generate 8 common behavioral questions for data analyst positions (dealing with ambiguity, tight deadlines, stakeholder conflict, failed projects, innovation, collaboration, problem-solving, learning new tools). For each question, provide a template STAR response structure and guide me in developing my own authentic examples.
Prompt 37: Past Project Discussion Framework
Create a framework for discussing my data analytics projects in interviews. Include how to structure project descriptions (business problem, approach, technical skills used, challenges faced, results achieved, lessons learned). Provide 5 example project narratives covering different analytical techniques. Help me articulate technical details appropriately for both technical and non-technical interviewers.
Prompt 38: Handling Difficult Stakeholder Scenarios
Generate 5 realistic scenarios involving difficult stakeholders in analytics projects (disagreeing with findings, unrealistic expectations, changing requirements, ignoring data insights, tight unreasonable deadlines). For each scenario, provide recommended responses demonstrating conflict resolution, communication skills, and professionalism. Help me practice answering “Tell me about a time when…” questions related to these situations.
Prompt 39: Technical Decision Justification
Prepare me to justify technical decisions in interviews. Create scenarios where I need to explain choices like: SQL vs Python for a task, Power BI vs Tableau, building vs buying solutions, choosing statistical methods, database design decisions, and visualization selections. For each, provide a framework for articulating trade-offs, considering context, and demonstrating critical thinking.
Prompt 40: Learning and Adaptability Stories
Help me craft responses demonstrating continuous learning and adaptability. Generate frameworks for answering questions about learning new tools quickly, adapting to changing priorities, handling unfamiliar domains, staying current with technology, and overcoming knowledge gaps. Provide specific examples from data analytics contexts and help me structure compelling narratives showing growth mindset.
Prompt 41: Failure and Recovery Narratives
Data analytics projects sometimes fail. Help me prepare honest, professional responses about project failures, incorrect analyses, missed insights, or wrong recommendations. Provide frameworks showing accountability, learning from mistakes, course correction, and growth. Generate 4 example scenarios with tactful, interview-appropriate responses that demonstrate maturity and resilience.
Prompt 42: Cross-Functional Collaboration Examples
Create scenarios demonstrating effective collaboration with various teams (sales, marketing, product, engineering, finance). For each department, describe typical collaboration points, communication challenges, how data analysts add value, and examples of successful partnerships. Help me articulate teamwork skills and ability to translate technical work into business value across different audiences.
Prompt 43: Prioritization and Time Management
Generate scenarios testing prioritization and time management skills. Include situations with multiple urgent requests, long-term projects vs quick analyses, incomplete data requiring investigation, and stakeholder pressure. For each scenario, provide frameworks for assessing priorities, communicating trade-offs, managing expectations, and demonstrating judgment. Include language for professionally pushing back when necessary.
Category 5: Mock Interview and Final Preparation (Prompts 44-50)
Prompt 44: Complete Mock Technical Interview
Conduct a complete mock technical interview for a Data Analyst position. Ask me 10 progressively challenging questions covering SQL, Excel, statistics, data visualization, and problem-solving. After each of my responses, provide constructive feedback on accuracy, completeness, and communication clarity. Include both theoretical knowledge and practical application questions. End with overall assessment and improvement recommendations.
Prompt 45: Live SQL Coding Interview Simulation
Simulate a live SQL coding interview. Present 3 business problems requiring SQL solutions with increasing complexity. For each problem, describe the scenario, provide table structures, and give me time to write queries. Then review my solutions, point out errors or inefficiencies, suggest optimizations, and show best practice approaches. Include tips for thinking aloud during live coding exercises.
Prompt 46: Case Study Presentation Practice
Give me a complete data analytics case study to solve and present as if in a final round interview. Provide business context, datasets, and analytical questions. Guide me through structuring my analysis, creating appropriate visualizations, deriving insights, and formulating recommendations. Then help me practice explaining my approach, defending my methodology, and handling follow-up questions from interviewers.
Prompt 47: Common Interview Pitfalls and How to Avoid Them
Identify common mistakes candidates make in data analytics interviews. Cover technical errors (SQL mistakes, statistical misunderstandings, visualization poor practices), communication issues (too technical, not structured, lack of business context), behavioral red flags (blaming others, arrogance, lack of curiosity), and cultural fit concerns. For each pitfall, provide recognition tips and correction strategies.
Prompt 48: Industry-Specific Preparation
I’m interviewing for a data analyst role in [specify industry: retail/finance/healthcare/technology/e-commerce]. Help me prepare industry-specific knowledge including common metrics and KPIs, typical analytical challenges, regulatory considerations, key data sources, industry-specific tools, and sample business questions I should expect. Provide 5 industry-specific interview questions with detailed answers.
Prompt 49: Salary Negotiation Preparation
Prepare me for salary negotiations after receiving a data analyst job offer. Help me research market rates for my experience level and location, articulate my value based on skills and accomplishments, practice responding to salary questions during interviews, understand total compensation beyond base salary, and develop negotiation strategies. Include scripts for discussing compensation professionally and confidently.
Prompt 50: Final Day Before Interview Checklist
Create a comprehensive final preparation checklist for the day before my data analytics interview. Include technical topics to review, behavioral questions to practice, questions I should ask interviewers, logistics to confirm (time, location, interviewers, format), materials to bring, what to wear, how to calm nerves, and confidence-building exercises. Provide a hour-by-hour preparation schedule and morning-of routine recommendations.
Bonus: Advanced Prompts for Specific Scenarios
Bonus Prompt 1: Whiteboard Problem-Solving
Simulate a whiteboard problem-solving session common in data analytics interviews. Present an ambiguous business problem requiring structured thinking, breaking down the problem, identifying data needs, proposing analytical approaches, and estimating results. Teach me how to think aloud effectively, ask clarifying questions, structure my approach visually, and demonstrate problem-solving methodology even without perfect answers.
Bonus Prompt 2: Tool-Specific Deep Dive
I need deep preparation on [specific tool: Power BI/Tableau/Python/SQL/Excel]. Generate 15 advanced interview questions specific to this tool, including architecture understanding, best practices, performance optimization, common challenges, version differences, integration capabilities, and real-world application scenarios. Provide detailed answers and help me understand not just “how” but “why” behind tool-specific decisions.
Bonus Prompt 3: Building Your Personal Pitch
Help me craft a compelling 60-second introduction for data analytics interviews. Guide me in articulating my background, technical skills, analytical approach, relevant accomplishments, career motivations, and what makes me unique. Provide multiple versions: one technical for analyst interviewers, one business-focused for hiring managers, and one concise for initial phone screens. Help me sound confident and authentic.
How to Maximize Learning from These Prompts
Practice Regularly: Use 2-3 prompts daily in the weeks leading up to your interview rather than cramming everything at once.
Customize Prompts: Adapt these prompts based on your specific interview context, experience level, and the company you’re interviewing with.
Follow Up: After getting responses, ask clarifying questions like “Can you explain that differently?” or “Give me another example” to deepen understanding.
Apply Learning: Don’t just read AI responses – practice writing SQL queries, building visualizations, and explaining concepts aloud as if speaking to an interviewer.
Combine with Part 1: Use these prompts to test your understanding of concepts covered in Part 1’s technical questions. Ask AI to quiz you randomly.
Track Progress: Keep notes on which topics you’ve mastered and which need more practice. Focus additional prompt time on weaker areas.
Simulate Real Conditions: When practicing mock interviews or coding exercises, set timers to simulate actual interview pressure and time constraints.
✨ Follow Your Data Analytics Learning Path
Beginner → Analyst → Senior Analyst → BI Analyst → Data Scientist.
3. COMMUNICATION SKILLS & BEHAVIOURAL
Introduction to Behavioral Interviews
Technical skills get you noticed, but communication and behavioral competencies get you hired. Data analytics is not just about crunching numbers – it’s about influencing decisions, collaborating with diverse teams, and translating complex findings into actions that non-technical people can understand and implement.
Behavioral interviews assess how you’ve handled real situations in the past, operating on the principle that past behavior predicts future performance. Interviewers want to understand your thought process, problem-solving approach, collaboration style, and resilience when facing challenges.
Section 1: The STAR Method Framework
What is the STAR Method?
STAR is a structured approach to answering behavioral questions that keeps your responses focused and impactful. It stands for Situation, Task, Action, and Result.
Situation: Set the context by describing the background and circumstances. Keep it brief but specific enough that the interviewer understands the scenario.
Task: Explain what you needed to accomplish or what problem you were trying to solve. Clarify your role and responsibilities in the situation.
Action: Describe the specific steps you took to address the task. This is the most important part – focus on what YOU did, not what the team did. Use “I” statements to demonstrate your individual contribution.
Result: Share the outcomes of your actions. Quantify results whenever possible with metrics, percentages, or concrete improvements. Also mention what you learned from the experience.
STAR Method Example for Data Analysts
Question: Tell me about a time when you had to explain complex technical findings to a non-technical audience.
Situation: In my previous role at an e-commerce company, I completed a customer segmentation analysis using clustering algorithms that identified five distinct customer groups with different purchasing behaviors.
Task: I needed to present these findings to the marketing team, who had limited technical knowledge but needed to understand the segments to create targeted campaigns. My goal was to make the analysis actionable without overwhelming them with statistical jargon.
Action: Instead of showing code or technical details, I created visual profiles for each customer segment using simple bar charts and demographic summaries. I gave each segment a memorable name like “Budget Shoppers” and “Premium Loyalists” rather than “Cluster 1” and “Cluster 2.” I prepared comparison tables showing how each segment differed in purchase frequency, average order value, and preferred product categories. During the presentation, I used analogies comparing customer segments to different types of shoppers you’d see in a physical store. I also prepared a one-page summary sheet with actionable recommendations for each segment.
Result: The marketing team immediately grasped the insights and within three weeks launched targeted email campaigns for each segment. The campaigns achieved 40% higher open rates and 25% better conversion rates compared to previous one-size-fits-all approaches. The CMO specifically commended my ability to make data accessible, and I was asked to present to other departments using the same storytelling approach.
Section 2: Essential Communication Skills for Data Analysts
Translating Technical Concepts
The ability to explain technical work in business terms is crucial. Practice explaining your analysis without using jargon like “p-values,” “regression coefficients,” or “standard deviations” unless your audience understands statistics.
Poor Communication: “We ran a linear regression with multiple independent variables and found that feature X had a coefficient of 0.73 with a p-value below 0.05, indicating statistical significance.”
Effective Communication: “We analyzed which factors most influence customer purchases and found that product reviews are the strongest driver. Customers who read reviews are significantly more likely to complete purchases, suggesting we should make reviews more prominent on product pages.”
Data Storytelling Techniques
Great data analysts are storytellers who build narratives around numbers. Every analysis should follow a story arc with a beginning, middle, and end.
Beginning – Set the Context: Explain the business problem and why it matters. “Our customer retention rate dropped 15% last quarter, costing approximately $2 million in lost revenue.”
Middle – Present Your Journey: Walk through your analytical approach, key findings, and interesting patterns discovered. Use visualizations to show trends and comparisons clearly.
End – Drive to Action: Conclude with clear recommendations and next steps. “Based on this analysis, I recommend we implement a personalized email campaign targeting at-risk customers, which could recover 30% of the lost revenue.”
Active Listening Skills
Effective communication is bidirectional. Before diving into analysis, ask clarifying questions to understand what stakeholders really need.
Essential Questions to Ask:
- What business decision will this analysis inform?
- Who is the audience for these findings?
- What level of detail do you need?
- Are there specific metrics or benchmarks we should consider?
- When do you need the results, and what format works best?
Presentation Skills
Your ability to present insights confidently and clearly often determines whether your analysis gets implemented.
Presentation Best Practices:
Start with the conclusion: Busy executives appreciate knowing the bottom line first. Lead with your key finding or recommendation, then provide supporting evidence.
Use the rule of three: People remember information best in groups of three. Structure presentations around three key insights, three recommendations, or three supporting points.
Design clean slides: Avoid cluttered visuals. Each slide should communicate one main idea. Use whitespace effectively and limit text to bullet points rather than paragraphs.
Anticipate questions: Before presenting, list likely questions and prepare answers. This shows you’ve thought deeply about implications and limitations.
Practice out loud: Rehearse your presentation multiple times, timing yourself and refining awkward phrasing. Practice answering tough questions so you respond smoothly under pressure.
Written Communication
Data analysts frequently communicate through emails, reports, and documentation. Strong writing skills ensure your work is understood and acted upon.
Email Best Practices:
Use descriptive subject lines: “Sales Analysis Results” is vague. “Q3 Sales Analysis: Revenue Down 8% Due to Pricing Changes” immediately conveys the key finding.
Front-load important information: Put your main point in the first sentence. Busy readers may not read beyond the opening paragraph.
Structure with bullets and headings: Break complex information into scannable sections. Use bold headings and bullet points for easy navigation.
Include clear next steps: End emails with specific action items, owners, and deadlines so everyone knows what happens next.
Section 3: Common Behavioural Interview Questions with Sample Answers
Question 1: Tell me about yourself.
This classic opener is your chance to set the tone. Prepare a 60-90 second professional summary highlighting your background, key skills, relevant experience, and why you’re interested in this role.
Sample Answer:
“I’m a data analyst with three years of experience turning complex datasets into actionable business insights. I started my career at a retail analytics firm where I specialized in customer behavior analysis using SQL, Python, and Power BI. In that role, I built automated dashboards that helped store managers optimize inventory, resulting in a 15% reduction in stockouts.
Most recently, I’ve been working at a fintech startup where I’ve expanded my skills into predictive analytics and machine learning applications. I’m particularly passionate about using data to solve real business problems, not just creating reports for their own sake.
I’m excited about this opportunity because your company’s focus on using AI-powered analytics to improve customer experiences aligns perfectly with my interests and experience. I’m especially drawn to the challenge of working with larger datasets and contributing to a team that values data-driven decision making.”
Question 2: Why do you want to work for our company?
Research the company thoroughly and connect your skills and interests to their specific work, culture, and challenges.
Sample Answer:
“I’ve been following your company’s growth in the e-commerce space, and I’m impressed by how you’re using data analytics to personalize customer experiences at scale. Your recent blog post about using machine learning for product recommendations showed sophisticated analytical thinking that excites me.
What really attracts me is your commitment to innovation in analytics. I noticed you’re adopting new tools like Databricks and investing in AI capabilities, which aligns with my goal to work at the cutting edge of data technology. I’m also drawn to your collaborative culture – several reviews mention cross-functional teamwork, which I’ve found produces the best analytical outcomes.
Finally, the specific challenge of analyzing customer journey data across multiple touchpoints is exactly the type of complex problem I enjoy solving. My experience building multi-channel attribution models would let me contribute immediately while learning from your experienced analytics team.”
Question 3: Describe a challenging data analysis project and how you handled it.
Choose a project that demonstrates technical skills, problem-solving ability, and business impact. Show how you overcame obstacles.
Sample Answer:
“I was tasked with analyzing customer churn for a subscription service, but faced significant challenges with data quality. Customer records were spread across three different systems with inconsistent customer IDs, missing transaction dates, and duplicate entries. The business needed answers within two weeks for an upcoming board meeting.
I started by mapping all data sources and documenting quality issues systematically. Rather than trying to fix everything, I prioritized cleaning data for active customers first since they represented 80% of revenue. I wrote Python scripts to standardize customer IDs using fuzzy matching algorithms and created validation rules to identify suspicious patterns.
For the actual analysis, I built a cohort-based retention analysis showing churn patterns over time and identified that customers who didn’t engage with certain features within the first month were five times more likely to cancel. I also segmented customers by plan type and usage patterns to identify high-risk groups.
Despite the data challenges, I delivered the analysis on time with clear documentation of data limitations and confidence levels. The insights led to a new onboarding campaign targeting first-month engagement, which reduced churn by 12% over the following quarter. The experience taught me the importance of pragmatic approaches when perfect data isn’t available and the value of clearly communicating analytical limitations alongside findings.”
Question 4: Tell me about a time when you disagreed with a stakeholder or team member.
This question assesses conflict resolution, communication skills, and professionalism. Show you can disagree respectfully while focusing on data and business outcomes.
Sample Answer:
“During a marketing campaign analysis, the marketing director insisted we should measure success based on total clicks and impressions. However, my analysis showed that while clicks were high, conversion rates were extremely low and cost per acquisition was twice our target. I disagreed with focusing on vanity metrics that didn’t reflect business impact.
Rather than directly challenging the director in a meeting, I requested a one-on-one conversation. I came prepared with data showing the disconnect between clicks and actual revenue. I created visualizations comparing click-through rates against conversion rates and calculated the true ROI showing the campaign was actually losing money despite high engagement.
I acknowledged that visibility and brand awareness had value but suggested we should optimize for conversions since that was the stated business goal. I proposed A/B testing different campaign approaches to find messaging that drove both engagement and conversions.
The director appreciated the data-driven approach and agreed to shift strategy. We redesigned the campaign with conversion-focused messaging, which resulted in 40% fewer clicks but a 150% increase in actual conversions. The director later thanked me for pushing back with evidence rather than just accepting the initial direction. This reinforced my belief that respectful disagreement backed by data strengthens rather than damages professional relationships.”
Question 5: Describe a time when you had to learn a new tool or technology quickly.
Show adaptability, learning agility, and resourcefulness – crucial traits as analytics technology evolves rapidly.
Sample Answer:
“My company decided to migrate from Excel-based reporting to Power BI, and I had only two weeks to learn the platform before training the broader team. I had no prior Power BI experience and needed to become proficient enough to teach others.
I started by identifying the most critical features we’d need – data connections, data modeling, DAX calculations, and dashboard design. I took Microsoft’s official learning path on Power BI fundamentals, dedicating two hours daily to structured learning. I also joined Power BI community forums and followed several YouTube channels with practical tutorials.
The key to rapid learning was hands-on practice. I immediately started rebuilding our existing Excel reports in Power BI, which forced me to solve real problems rather than just consuming theoretical content. When stuck, I posted specific questions in the Power BI community and usually received helpful answers within hours.
Within the two-week timeframe, I successfully recreated our main sales dashboard with improved interactivity and automated data refresh. I documented my learning process and created simple training materials for colleagues. When training day arrived, I confidently led three sessions teaching 25 team members. Six months later, our Power BI dashboards are now the primary reporting tool, and I’ve become the go-to person for Power BI questions. This experience proved I can master new technologies quickly when business needs demand it.”
Question 6: Tell me about a time when your analysis was wrong or when you made a mistake.
Show accountability, humility, learning from failures, and commitment to accuracy. Never claim you’ve never made mistakes.
Sample Answer:
“Early in my career, I was analyzing website traffic data and reported to leadership that our mobile traffic had grown 200% month-over-month, which seemed like an amazing success for our mobile optimization efforts. However, a week later, I discovered my analysis was wrong.
The issue was a tracking code change that had inadvertently caused some desktop traffic to be miscategorized as mobile. I hadn’t noticed the simultaneously suspicious drop in desktop traffic or validated the data before presenting. Once I discovered the error, I immediately informed my manager and the stakeholders who had received the report.
I corrected the analysis, which showed actual mobile growth was a more modest but still positive 15%. I sent a detailed correction email explaining the error, the actual numbers, and the root cause. I also implemented a new quality check process for myself – always validating unusual spikes or drops by checking multiple data sources and looking at overall totals to ensure things added up.
While embarrassing, this mistake made me a more careful analyst. I now have a standard checklist I run through before sharing any analysis, including data validation, sense checks comparing to historical baselines, and peer review for important presentations. I haven’t made that type of error since, and I’m now known for thoroughness and accuracy. The key lesson was that speed without accuracy is worthless – it’s better to take an extra day to verify findings than to provide misleading information quickly.”
Question 7: How do you handle multiple competing priorities and tight deadlines?
Demonstrate time management, prioritization frameworks, communication skills, and ability to work under pressure.
Sample Answer:
“In my current role, I regularly juggle multiple requests from different departments – sales wants pipeline analysis, marketing needs campaign reports, and product wants user behavior insights. Last quarter, I had five major analyses all due within the same week.
My approach started with transparent communication. I listed all requests with estimated effort and asked each stakeholder about true urgency and business impact. I learned that what seemed urgent to one person wasn’t actually time-sensitive from a business perspective. This conversation helped me establish clear priorities.
I categorized work using an impact-versus-effort matrix. The sales pipeline analysis had high business impact and could be completed quickly using existing dashboards with minor updates, so I tackled that first. The marketing campaign analysis was also urgent with medium effort, so that came second. The product analysis was important but less time-sensitive, so I negotiated a one-week extension.
For the work I committed to, I blocked focus time on my calendar, minimized meeting interruptions, and front-loaded the most complex analytical tasks when my energy was highest. I also communicated progress updates daily so stakeholders knew I hadn’t forgotten their requests.
All five analyses were delivered – three on the original timeline and two with negotiated extensions. More importantly, all stakeholders felt heard and appreciated the transparent communication about trade-offs. This experience taught me that prioritization is as much about stakeholder management and communication as it is about personal time management.”
Question 8: Describe a time when you had to present data that stakeholders didn’t want to hear.
This tests courage, diplomacy, and commitment to data integrity over telling people what they want to hear.
Sample Answer:
“Our product team had spent six months developing a new feature they believed would increase user engagement. They asked me to analyze the beta test data, expecting validation that the feature was successful. Unfortunately, my analysis showed the new feature actually decreased engagement – users who encountered it spent 20% less time on the platform and had higher abandonment rates.
I knew this would be disappointing news, so I carefully prepared my presentation. Rather than leading with the negative finding, I started by acknowledging the team’s hard work and the hypothesis behind the feature. I then presented the data objectively, showing multiple metrics and user segments to ensure the finding was robust.
Importantly, I didn’t just deliver bad news – I dug deeper to understand why the feature failed. User feedback and behavioral analysis revealed the feature was confusing and interrupted user flow. I presented these insights along with specific recommendations for redesigning the feature based on what users actually needed.
The initial reaction was defensive, with team members questioning my methodology. I welcomed the scrutiny and walked through my analytical approach step-by-step, showing I had validated findings across multiple data sources. I also acknowledged uncertainty around smaller user segments where sample sizes were limited.
Ultimately, the data convinced the team to pivot their approach. They redesigned the feature incorporating my recommendations, and the second version successfully increased engagement by 15%. The product manager later thanked me for being honest, saying it saved them from launching something that would have hurt the business. This reinforced that my job is to provide accurate insights, not to validate preconceived notions.”
Question 9: How do you ensure data quality and accuracy in your work?
Show attention to detail, systematic approaches to quality assurance, and understanding that accurate analysis is foundational to good decisions.
Sample Answer:
“Data quality is fundamental to trustworthy analysis, so I’ve developed a systematic quality assurance process that I apply to every project.
First, I always start with data profiling before analysis. I examine completeness rates, check for unexpected nulls, look at value distributions, identify outliers, and review data types. This helps me spot quality issues early rather than discovering them after analysis is complete.
Second, I implement validation checks throughout my work. For SQL queries, I compare row counts before and after joins to ensure I’m not accidentally duplicating or losing records. For calculations, I test formulas on small sample datasets where I can manually verify results. I also sense-check final numbers against known benchmarks or historical patterns – if results seem unusual, I investigate why rather than assuming they’re correct.
Third, I use version control and documentation rigorously. All SQL queries and Python scripts are documented with comments explaining logic. I save versions so I can trace back if something changes unexpectedly. For Excel work, I separate raw data from calculations and lock source data to prevent accidental modifications.
Fourth, I seek peer review for important analyses. Having a colleague review my approach catches errors I might miss and often suggests improvements. I also maintain a personal checklist of common mistakes I’ve made in the past and explicitly check for those issues.
Finally, I’m transparent about data limitations in my deliverables. If certain data is missing or estimates are involved, I note that explicitly rather than presenting findings as more certain than they actually are.
This systematic approach has virtually eliminated errors in my work and built strong trust with stakeholders who know my analyses are reliable.”
Question 10: What motivates you as a data analyst?
Show genuine passion for the work beyond just technical interests. Connect to business impact and helping others make better decisions.
Sample Answer:
“What truly motivates me is seeing data drive better decisions that create real impact. I love the detective work of exploring data and uncovering non-obvious patterns, but what really energizes me is when those insights actually change how the business operates.
For example, last year I identified that our highest-value customers had very different characteristics than we assumed. Marketing had been targeting young tech professionals, but my analysis showed our best customers were actually small business owners aged 35-50. When marketing shifted strategy based on this insight and customer acquisition costs dropped by 30%, that was incredibly satisfying. It proved that careful analysis can challenge assumptions and drive meaningful results.
I’m also motivated by the continuous learning aspect of analytics. The field evolves rapidly with new tools, techniques, and technologies. I genuinely enjoy mastering new skills like I recently did with Python for machine learning. The challenge of staying current and constantly improving my craft keeps the work interesting.
Finally, I find satisfaction in making data accessible to others. When I present analysis to non-technical colleagues and see understanding click for them, that moment of connection is rewarding. Helping others become more data-literate and confident in their decisions feels like I’m multiplying my impact beyond just my own analyses.
These factors together – business impact, continuous learning, and enabling others – keep me engaged and excited about data analytics work. This role appeals to me because it offers all three through working on diverse problems with cross-functional teams in a fast-paced environment.”
Section 4: Advanced Behavioural Scenarios
Working with Ambiguous Requirements
Question: Tell me about a time when you received a vague or unclear request.
Answer Framework:
- Describe the ambiguous request and why it was unclear
- Explain how you sought clarification through questions
- Show how you broke down the problem systematically
- Demonstrate how you proposed a structured approach
- Share the outcome and what you learned about requirement gathering
Key Points to Emphasize:
- Proactive clarification rather than making assumptions
- Structured thinking to break down ambiguity
- Collaboration with stakeholders to define scope
- Delivering value even when initial direction was unclear
Cross-Functional Collaboration
Question: Describe a project where you had to work with multiple departments.
Answer Framework:
- Set context of the cross-functional project
- Identify different stakeholders and their perspectives
- Explain challenges in aligning different priorities
- Show how you facilitated communication and alignment
- Share collaborative outcomes and relationship building
Key Points to Emphasize:
- Understanding different departmental goals and constraints
- Translating analytics insights for different audiences
- Building bridges between technical and business teams
- Creating win-win solutions that served multiple stakeholders
Driving Change with Data
Question: Give an example of when you used data to influence a business decision.
Answer Framework:
- Describe the business context and decision to be made
- Explain your analytical approach and key findings
- Show how you packaged insights persuasively
- Discuss resistance you encountered and how you addressed it
- Quantify the business impact of the decision
Key Points to Emphasize:
- Connecting analysis directly to business value
- Presenting data in compelling, accessible ways
- Persistence in championing data-driven approaches
- Measuring and communicating outcomes
Innovation and Process Improvement
Question: Tell me about a time you improved an existing process or created something new.
Answer Framework:
- Identify the inefficient process or gap you noticed
- Explain why the existing approach was problematic
- Describe your improved solution or innovation
- Show implementation steps and how you gained buy-in
- Quantify time saved, accuracy improved, or value created
Key Points to Emphasize:
- Observing inefficiencies others might miss
- Taking initiative without being asked
- Balancing innovation with practical constraints
- Creating reusable solutions that benefit others
Section 5: Questions You Should Ask Interviewers
Asking thoughtful questions shows engagement, critical thinking, and genuine interest. Prepare questions tailored to the role, company, and interviewer.
Questions About the Role:
“What does a typical day or week look like for someone in this position?”
“What are the most important priorities for this role in the first 90 days?”
“What analytical tools and technologies does the team currently use?”
“How is success measured for this position? What metrics would define excellent performance?”
“What types of projects would I be working on initially?”
Questions About the Team:
“Can you tell me about the analytics team structure and who I’d be working with most closely?”
“How does the analytics team collaborate with other departments like marketing, product, or sales?”
“What’s the typical career progression for someone starting in this role?”
“How does the team stay current with new tools and analytical techniques?”
“What do you enjoy most about working with this team?”
Questions About Data and Process:
“What are the primary data sources the team works with?”
“How is data governance and quality managed?”
“What’s the balance between ad-hoc analysis requests and longer-term projects?”
“How does the team prioritize competing analytical requests?”
“What tools does the company use for data visualization and reporting?”
Questions About Company Culture:
“How would you describe the company’s approach to data-driven decision making?”
“Can you share an example of a recent analysis that significantly impacted business strategy?”
“What does professional development look like here for analysts?”
“How does the company support work-life balance?”
“What excites you most about the company’s future direction?”
Questions to Avoid:
Don’t ask about salary, benefits, or vacation time in initial interviews – save these for later stages or after receiving an offer. Avoid questions easily answered by reviewing the company website. Don’t ask negative questions like “What’s the worst part about working here?”
Section 6: Communication Red Flags to Avoid
Being Too Technical
Don’t overwhelm non-technical audiences with statistical jargon, code snippets, or methodology details they don’t need. Tailor complexity to your audience.
Rambling Without Structure
Avoid long, meandering answers without clear points. Use frameworks like STAR to keep responses focused and organized.
Taking Credit for Team Work
Don’t claim sole credit for collaborative efforts. Acknowledge team contributions while clearly articulating your specific role and actions.
Speaking Negatively About Previous Employers
Never badmouth former colleagues, managers, or companies. Frame past challenges professionally without assigning blame.
Being Defensive About Mistakes
Don’t make excuses or shift blame when discussing failures. Show accountability and focus on learning and growth.
Lacking Business Context
Avoid discussing analysis purely in technical terms without connecting to business impact, decisions, or value created.
Interrupting or Not Listening
Wait for questions to be completed fully before responding. Don’t interrupt interviewers or seem impatient.
Section 7: Virtual Interview Tips
Technical Setup
Test your camera, microphone, and internet connection beforehand. Use a clean, professional background or virtual background. Ensure good lighting with light sources in front of you, not behind.
Professional Presence
Dress professionally as you would for in-person interviews. Maintain eye contact by looking at the camera, not the screen. Minimize distractions by closing unnecessary applications and silencing notifications.
Communication Adjustments
Speak slightly more clearly and slower than usual since audio quality varies. Use hand gestures within camera frame to emphasize points. Build in brief pauses after answering in case of audio delays.
Engagement Techniques
Use screensharing to walk through portfolio work or examples when appropriate. Send thank-you emails with relevant work samples or links to projects discussed. Follow up on action items or questions you committed to answering.
Section 8: Body Language and Non-Verbal Communication
Positive Body Language:
Maintain open posture with arms uncrossed. Lean slightly forward to show engagement. Smile genuinely when appropriate. Make comfortable eye contact without staring. Use natural hand gestures to emphasize points. Nod to show understanding while listening.
Negative Body Language to Avoid:
Crossing arms which appears defensive. Slouching suggesting disinterest. Looking down or away frequently. Fidgeting with objects. Checking phone or watch. Over-animated gestures that distract.
Section 9: Managing Interview Stress
Pre-Interview Preparation:
Research the company thoroughly. Practice answers to common questions out loud. Prepare specific examples from your experience. Review your resume and be ready to discuss everything listed. Get adequate sleep the night before. Eat a good meal before the interview.
During the Interview:
Take deep breaths to calm nerves. Pause to think before answering difficult questions. Ask for clarification if you don’t understand a question. Remember that interviewers want you to succeed. View the interview as a conversation, not interrogation.
Handling Difficult Questions:
If you don’t know an answer, admit it honestly rather than making something up. Explain how you would find the answer or learn what you need to know. For questions about weaknesses, choose genuine growth areas and explain how you’re improving. For salary questions early on, deflect by saying you’d like to learn more about the full opportunity first.
Section 10: Post-Interview Follow-Up
Thank You Notes:
Send personalized thank-you emails within 24 hours to each interviewer. Reference specific topics discussed to show attentiveness. Reiterate your interest in the role and fit with the team. Keep it concise – three to four paragraphs maximum.
Addressing Outstanding Items:
If you promised to send additional information or examples, do so promptly. If you couldn’t fully answer a question, follow up with a thoughtful response.
Timeline Management:
Ask about next steps and expected timeline before leaving the interview. If you don’t hear back within the stated timeframe, send a polite follow-up inquiry. Continue job searching rather than waiting for one opportunity.
Final Thoughts on Behavioural Interview Success
Behavioural interviews reward authentic preparation – developing genuine examples from your experience rather than memorizing scripted answers. The best responses show self-awareness, growth mindset, and ability to reflect on experiences thoughtfully.
Remember that interviewers are assessing not just what you’ve done, but how you think, communicate, and would fit within their team culture. Technical skills can be taught more easily than soft skills like communication, collaboration, and emotional intelligence.
Prepare thoroughly but stay flexible during interviews. Listen carefully to questions and adapt your prepared examples to what’s actually being asked. Show enthusiasm for the work, curiosity about the company, and genuine interest in the people you’re meeting.
Your goal is demonstrating that you’re not just a skilled analyst, but someone who will communicate effectively, collaborate productively, handle challenges professionally, and contribute positively to both analytical outcomes and team culture.
💼 Ready for a High-Paying Data Analyst Career?
Become interview-ready with real-world analytics projects in our
Data Analytics Course.
4.ADDITIONAL PREPARATION ELEMENTS
Introduction
You’ve mastered technical concepts, practiced self-preparation prompts, and refined your communication skills. Now it’s time to polish the additional elements that complete your interview readiness – your resume, portfolio, LinkedIn presence, salary negotiation strategy, and final day preparation. These elements often make the difference between getting that interview invitation and landing the actual job offer.
Section 1: Building an ATS-Optimized Data Analytics Resume
Understanding Applicant Tracking Systems (ATS)
Before a human recruiter sees your resume, it often passes through Applicant Tracking Systems – software that scans, parses, and ranks resumes based on keyword matches and formatting. Studies show that 75% of resumes are rejected by ATS before reaching human eyes. Understanding how to optimize for both ATS and human reviewers is essential.
Resume Structure for Data Analysts
Header Section:
Include your full name, phone number, email address, LinkedIn profile URL, and GitHub/portfolio link. Avoid graphics, photos, or fancy designs that confuse ATS software. Use a professional email address, not something like partytime2025@email.com.
Professional Summary:
Write a compelling 3-4 line summary highlighting your experience level, key skills, and specialization. This should be tailored to each job application.
Example:
“Data Analyst with 2+ years of experience transforming complex datasets into actionable business insights using SQL, Python, Power BI, and advanced statistical methods. Proven track record of delivering analytical solutions that drove 20% revenue growth and 15% cost reduction. Expertise in customer analytics, predictive modeling, and dashboard development for cross-functional stakeholders.”
Technical Skills Section:
List skills in categories for easy scanning. Include every tool, programming language, and technique mentioned in the job description that you genuinely possess.
Example Layout:
- Data Analysis: SQL, Python (Pandas, NumPy), R, Excel (Advanced), Statistical Analysis
- Visualization: Power BI, Tableau, Matplotlib, Seaborn
- Databases: MySQL, PostgreSQL, MongoDB, Oracle
- Tools & Platforms: Jupyter Notebooks, Git, Azure, AWS, Google BigQuery
- AI Tools: ChatGPT, Microsoft Copilot, Google Gemini
- Core Competencies: Data Cleaning, ETL, Exploratory Data Analysis, A/B Testing, Predictive Modeling, Dashboard Design
Professional Experience:
Use reverse chronological order starting with your most recent position. Follow this formula for each bullet point:
Action Verb + Task + Tool/Method + Quantifiable Result
Poor Example:
“Responsible for analyzing sales data and creating reports.”
Strong Example:
“Analyzed 5M+ sales transactions using SQL and Python to identify revenue leakage patterns, resulting in process improvements that recovered $450K annually and increased profit margins by 8%.”
More Strong Examples:
“Built interactive Power BI dashboards tracking 15+ KPIs across marketing channels, enabling real-time campaign optimization that improved conversion rates by 23% and reduced customer acquisition costs by $12 per customer.”
“Developed Python-based customer segmentation model using RFM analysis and clustering algorithms, identifying 6 distinct customer personas that informed targeted marketing strategies generating 35% higher engagement rates.”
“Automated weekly reporting workflow using Python scripts and Power Query, reducing report generation time from 6 hours to 15 minutes and eliminating 90% of manual errors.”
“Conducted A/B testing analysis for website redesign project involving 50K users, using statistical hypothesis testing to validate 18% improvement in conversion rates with 95% confidence level.”
“Collaborated with cross-functional teams (Product, Marketing, Sales) to define analytics requirements, translating business questions into SQL queries and delivering insights that influenced $2M product investment decision.”
Action Verbs for Data Analytics Resumes
Analysis: Analyzed, Examined, Evaluated, Assessed, Investigated, Researched, Identified, Discovered
Technical Implementation: Developed, Built, Designed, Implemented, Created, Engineered, Automated, Optimized
Data Management: Cleaned, Processed, Transformed, Integrated, Consolidated, Extracted, Migrated, Validated
Visualization & Communication: Presented, Visualized, Communicated, Reported, Demonstrated, Illustrated, Published, Delivered
Business Impact: Improved, Increased, Reduced, Generated, Achieved, Accelerated, Enhanced, Streamlined
Education Section
List your degree, institution, graduation year, and relevant coursework or certifications. For recent graduates without extensive experience, you can include relevant projects and academic achievements here.
Example:
Bachelor of Technology in Computer Science
XYZ University, Graduated May 2024
Relevant Coursework: Data Structures, Database Management, Statistical Analysis, Machine Learning
GPA: 3.8/4.0 (include only if 3.5 or above)
Certifications and Training
List relevant certifications that validate your skills. For this course specifically:
AI-Powered Data Analytics Certificate – Frontlines Edutech (2025)
Comprehensive training in SQL, Python, Power BI, Tableau, Excel, Statistics, and AI-powered analytics tools
Other valuable certifications to pursue:
- Microsoft Certified: Power BI Data Analyst Associate
- Google Data Analytics Professional Certificate
- Tableau Desktop Specialist
- AWS Certified Data Analytics – Specialty
Projects Section (Crucial for Entry-Level Candidates)
If you lack professional experience, a strong projects section can compensate. Include 3-4 substantial projects demonstrating diverse skills.
Project Format:
Customer Churn Prediction Model | Python, Pandas, Scikit-learn
- Analyzed telecom customer data with 7K+ records to identify churn risk factors using logistic regression and decision trees
- Engineered 15 features including usage patterns, billing information, and customer service interactions
- Achieved 85% prediction accuracy, enabling proactive retention campaigns targeting high-risk customers
- Created interactive Tableau dashboard visualizing churn drivers and customer segmentation insights
Keywords to Include Based on Job Descriptions
Carefully read each job posting and incorporate relevant keywords naturally throughout your resume:
Common Data Analytics Keywords:
Data analysis, data visualization, SQL, Python, R, Excel, Power BI, Tableau, statistical analysis, machine learning, data modeling, ETL, data warehousing, business intelligence, dashboard development, predictive analytics, A/B testing, data mining, big data, database management, reporting, KPI tracking, stakeholder communication, problem-solving, critical thinking
Resume Formatting Best Practices
Do:
- Use standard fonts like Arial, Calibri, or Times New Roman (10-12pt)
- Save as PDF unless specifically instructed otherwise
- Keep to 1-2 pages (1 page for entry-level, 2 for experienced)
- Use consistent formatting for dates, headers, and bullet points
- Include plenty of white space for readability
- Use standard section headings ATS can recognize
Don’t:
- Use tables, text boxes, headers, or footers (ATS often can’t read these)
- Include graphics, charts, or images
- Use unusual fonts or excessive formatting
- List outdated or irrelevant skills
- Include personal information like age, marital status, or photo
- Use pronouns (I, me, my) – use action verbs instead
Tailoring Your Resume for Each Application
Never send the same generic resume to every job. Spend 15-20 minutes customizing for each application:
Customization Steps:
- Highlight the job posting and identify 10-15 key requirements and keywords
- Adjust your professional summary to mirror the job description language
- Reorder bullet points to prioritize most relevant experiences first
- Add or emphasize skills mentioned in the posting that you possess
- Quantify achievements in ways that align with the company’s goals
- Research the company and incorporate relevant terminology they use
Common Resume Mistakes to Avoid
Typos and Grammar Errors: Proofread multiple times and use tools like Grammarly. Have someone else review it.
Vague Statements: “Worked with data” tells nothing. Be specific about what data, what tools, what outcomes.
Missing Quantifiable Results: Every bullet point should ideally include a number – percentage improvement, dollar amount, time saved, records processed.
Listing Responsibilities Instead of Achievements: Your resume should show what you accomplished, not just what your job description said.
Too Technical for Recruiters: Remember that recruiters may not understand deep technical jargon. Balance technical specificity with accessibility.
Irrelevant Information: That part-time retail job from five years ago probably isn’t relevant unless you’re highlighting transferable skills.
🗺️ Follow the Complete Data Analytics Roadmap
Beginner → Excel → SQL → Power BI → Tableau → Python → AI Tools.
Section 2: Building a Compelling Data Analytics Portfolio
Why You Need a Portfolio
A portfolio demonstrates your abilities far better than a resume alone can. It shows actual work samples, thought processes, and communication skills. For data analysts, especially those without extensive professional experience, a portfolio can be the deciding factor in getting interviews.
Portfolio Hosting Platforms
GitHub: Perfect for hosting code, Jupyter notebooks, and technical documentation. Most technical recruiters expect to see a GitHub profile for data analyst positions.
Personal Website: Using platforms like WordPress, Wix, or custom HTML gives you complete control over presentation. Great for showcasing dashboards and visualizations.
Kaggle: Participate in competitions and publish notebooks. Kaggle profiles demonstrate practical skills and continuous learning.
Tableau Public: Essential for showcasing interactive dashboards. Many hiring managers specifically look for Tableau Public profiles.
Medium/Dev.to: Write technical blog posts explaining your analyses. This demonstrates communication skills and technical depth simultaneously.
Essential Portfolio Projects
Include 4-6 diverse projects demonstrating different skills and domains. Each project should showcase different aspects of your capabilities.
Project 1: End-to-End Data Analysis Project
Choose a real-world dataset and conduct comprehensive analysis from data collection through insights presentation. Show data cleaning, exploratory analysis, statistical testing, visualizations, and business recommendations.
Recommended Datasets:
- E-commerce transaction data
- Customer behavior analytics
- Marketing campaign performance
- Sales forecasting
- Public health data
What to Include:
- Business problem statement and objectives
- Data source documentation
- Data cleaning and preparation steps with code
- Exploratory data analysis with visualizations
- Statistical analysis and hypothesis testing
- Key insights and recommendations
- Interactive dashboard (Power BI or Tableau)
- Complete documentation explaining your thought process
Project 2: SQL Database Project
Create a database project demonstrating complex query skills, data modeling, and business intelligence.
Project Ideas:
- E-commerce database with customer, product, and order tables
- HR analytics database tracking employee performance
- Inventory management system with sales analytics
What to Include:
- Entity-Relationship Diagram (ERD)
- Database schema with CREATE TABLE statements
- Sample data generation or real dataset
- 15-20 SQL queries of increasing complexity
- Business questions each query answers
- Query optimization examples
Project 3: Interactive Dashboard
Build a comprehensive dashboard in Power BI or Tableau using real data.
Dashboard Elements:
- Multiple connected visualizations
- Interactive filters and slicers
- Drill-down capabilities
- Key performance indicators (KPIs)
- Time-series analysis
- Comparison views
- Mobile-responsive design
Project 4: Python Data Analysis
Demonstrate Python programming skills with libraries like Pandas, NumPy, Matplotlib, and Seaborn.
Include:
- Data manipulation and transformation
- Statistical analysis
- Data visualizations
- Machine learning model (optional)
- Well-commented, clean code
- Jupyter notebook format for readability
Project 5: Predictive Analytics Project
Build a machine learning model solving a business problem.
Examples:
- Customer churn prediction
- Sales forecasting
- Product recommendation system
- Fraud detection model
What to Showcase:
- Problem formulation
- Feature engineering process
- Model selection and training
- Performance evaluation metrics
- Business interpretation of results
- Deployment considerations
Project 6: Data Storytelling Project
Create a narrative-driven analysis that tells a compelling story with data.
Good Topics:
- Analyzing trends in your industry of interest
- COVID-19 impact analysis
- Social media sentiment analysis
- Sports analytics insights
Portfolio Project Documentation Template
For each project, follow this documentation structure:
- Executive Summary
Brief overview of the business problem, approach, and key findings (2-3 paragraphs) - Business Context
Explain why this analysis matters and what decisions it could inform - Data Source
Document where data came from, what it contains, time period covered, limitations - Methodology
Explain your analytical approach, tools used, and why you chose them - Analysis Process
Walk through your work step-by-step with code snippets, queries, or screenshots - Key Findings
Present insights clearly with supporting visualizations - Recommendations
Provide actionable recommendations based on your analysis - Technical Details
Include links to code repositories, dashboards, and additional resources - Lessons Learned
Reflect on challenges faced and what you’d do differently
Portfolio Presentation Tips
Visual Appeal Matters: Use clean, professional design. Include screenshots, charts, and diagrams to break up text.
Make It Scannable: Hiring managers spend 2-3 minutes per portfolio. Use headers, bullet points, and visual hierarchy to guide attention to key elements.
Show, Don’t Just Tell: Include interactive dashboards, embedded visualizations, and code snippets rather than just describing what you did.
Highlight Business Impact: Don’t just show technical work. Explain what business value your analysis could provide.
Keep It Updated: Regularly add new projects and remove outdated work. An active portfolio shows continuous learning.
Include Contact Information: Make it easy for recruiters to reach you. Include email, LinkedIn, and GitHub links prominently.
Section 3: Optimizing Your LinkedIn Profile
Why LinkedIn Matters
Recruiters actively search LinkedIn for data analyst candidates. An optimized profile increases your visibility, establishes credibility, and often leads to opportunities before you even apply. Many recruiters use LinkedIn as a screening tool before inviting candidates to interview.
Profile Photo
Use a professional, high-quality headshot with good lighting and plain background. Smile naturally and wear professional attire. Profiles with photos receive 21 times more profile views and 36 times more messages.
Headline (120 Characters)
Your headline appears in search results and should immediately communicate your value. Don’t just list your job title.
Weak: “Data Analyst”
Strong: “Data Analyst | SQL, Python, Power BI | Turning Complex Data into Actionable Business Insights”
Alternative: “AI-Powered Data Analytics Professional | Business Intelligence | Data Visualization Specialist”
About Section (2,000 Characters)
This is your elevator pitch. Write in first person and include:
Opening Hook: Start with what you’re passionate about or your unique value proposition
Professional Background: Brief overview of your experience and expertise
Key Skills: List technical and analytical capabilities
What You Do: Explain how you solve problems and create value
Call to Action: Invite people to connect or reach out
Example About Section:
“I transform complex datasets into strategic insights that drive business decisions.
As a data analyst specializing in AI-powered analytics, I combine technical expertise in SQL, Python, Power BI, and statistical analysis with strong business acumen to solve real-world problems. My background includes analyzing millions of data points across e-commerce, marketing, and customer behavior domains.
What I bring to organizations:
- Data-driven storytelling that makes complex analyses accessible to non-technical stakeholders
- Advanced dashboard development that enables real-time decision making
- Predictive modeling and statistical analysis for forecasting and optimization
- Process automation that saves teams hundreds of hours annually
My approach focuses on asking the right questions before diving into analysis. I believe the best insights come from understanding business context deeply, not just running numbers.
Recently, I’ve been exploring AI-assisted analytics using tools like ChatGPT, Copilot, and Gemini to enhance efficiency and uncover deeper insights faster.
I’m passionate about continuous learning and love connecting with fellow data professionals. If you’re working on interesting data challenges or looking for analytical collaboration, let’s connect!”
Experience Section
Mirror your resume but with slightly more detail since space isn’t as constrained. Include rich media like links to dashboards, presentations, or project repositories.
For each role, add:
- Bullet points highlighting achievements with metrics
- Media attachments (screenshots of dashboards, certificates, presentations)
- Links to related portfolio projects
Skills Section
Add all relevant skills and seek endorsements from colleagues, classmates, and instructors. Prioritize these skills for data analysts:
Top Skills to Feature:
- Data Analysis
- SQL
- Python
- Power BI
- Tableau
- Microsoft Excel
- Statistical Analysis
- Data Visualization
- Business Intelligence
- Machine Learning
- Data Modeling
LinkedIn allows 50 skills but only the top 3 appear on your profile prominently. Choose strategically based on what roles you’re targeting.
Recommendations
Request recommendations from supervisors, colleagues, instructors, or project partners. Aim for 3-5 quality recommendations highlighting different aspects of your work. Offer to write recommendations for others first.
How to Request Recommendations:
“Hi [Name], I really enjoyed working with you on [specific project]. As I’m updating my LinkedIn profile, I’d greatly appreciate if you could write a brief recommendation highlighting our collaboration on [specific aspect]. I’m happy to return the favor and write one for you as well!”
Featured Section
Pin your best work at the top of your profile:
- Portfolio projects
- Published articles or blog posts
- Dashboards on Tableau Public
- GitHub repositories
- Certifications
- Presentations or speaking engagements
Certifications
Add all relevant certifications with verification links when possible. This includes:
- AI-Powered Data Analytics Certificate (Frontlines Edutech)
- Microsoft Power BI certifications
- Google Data Analytics Certificate
- Tableau certifications
- SQL certifications
- Any online courses from Coursera, edX, or Udemy
LinkedIn Activity Strategy
Post Regularly: Share insights about data analytics, comment on industry trends, or showcase your learning journey. Aim for 2-3 posts per week.
Content Ideas:
- Share a visualization you created with brief insights
- Post about a new tool or technique you learned
- Comment thoughtfully on posts from industry leaders
- Share articles with your perspective added
- Celebrate project completions or new certifications
Engage with Others: Comment on posts, congratulate connections on achievements, and participate in relevant groups. Engagement increases your visibility in others’ feeds.
Use Hashtags Strategically:
#DataAnalytics #SQL #Python #PowerBI #Tableau #DataScience #BusinessIntelligence #DataVisualization #MachineLearning #Analytics
LinkedIn Profile Optimization Checklist
✓ Professional profile photo and background banner
✓ Compelling headline with keywords
✓ Comprehensive about section
✓ Detailed experience with achievements and metrics
✓ 50+ skills added with strategic top 3
✓ 3-5 recommendations received
✓ Featured section with portfolio work
✓ Certifications and education completed
✓ Custom LinkedIn URL (linkedin.com/in/yourname)
✓ Open to work status enabled (if actively job hunting)
✓ Active with regular posts and engagement
Section 4: Salary Negotiation for Data Analysts
Research Market Rates
Before any negotiation, know your worth based on location, experience level, company size, and industry.
Salary Research Resources:
- Glassdoor salary data
- LinkedIn Salary Insights
- Payscale.com
- Levels.fyi (especially for tech companies)
- Indeed Salary Calculator
- AmbitionBox (for India-specific salaries)
Understanding Compensation Components
Base salary is just one part. Total compensation includes:
Base Salary: Your annual or hourly pay rate
Bonuses: Performance bonuses, signing bonuses, annual bonuses (typically 5-20% of base)
Equity: Stock options or RSUs (Restricted Stock Units) especially at startups and tech companies
Benefits: Health insurance, retirement contributions (PF/EPF), life insurance
Perks: Remote work flexibility, learning budgets, gym memberships, meal allowances, transportation
Paid Time Off: Vacation days, sick leave, holidays, parental leave
When to Discuss Salary
During Initial Screening: If recruiters ask about salary expectations early, deflect politely: “I’d prefer to learn more about the role and responsibilities before discussing compensation. What’s the budgeted range for this position?”
After Receiving an Offer: The best time to negotiate is after you have a written offer but before accepting. You have maximum leverage when they’ve decided they want you.
Never First: Try to have the employer state a number first. Whoever mentions a number first usually loses in negotiation.
Negotiation Scripts and Strategies
When Asked About Salary Expectations:
“Based on my research of data analyst salaries in [location] for someone with my skill set in SQL, Python, Power BI, and statistical analysis, I’m targeting roles in the [X to Y] range. However, I’m flexible based on the complete compensation package and growth opportunities. What range has been budgeted for this position?”
When You Receive an Offer Below Expectations:
“Thank you so much for the offer! I’m very excited about this opportunity and believe I can bring significant value to the team. I was hoping we could discuss the compensation. Based on my research and considering my experience with [specific skills relevant to role], I was targeting closer to [higher number]. Is there flexibility in the base salary?”
When the Number is Firm:
“I understand the base salary has limited flexibility. Could we explore other aspects of the compensation package? I’d be interested in discussing signing bonus, performance bonus structure, additional vacation days, professional development budget, or remote work flexibility.”
When You Have Multiple Offers:
“I have another offer I’m considering, but this role is my top choice because of [specific reasons]. The other offer is at [higher amount]. I’d love to work here – is there any possibility of matching or getting closer to that number?”
When You’re Happy with the Offer:
You can still negotiate even if the initial offer is acceptable: “I’m thrilled with the offer and eager to join the team. Before I sign, I want to ensure we’ve optimized the package. Would there be room for [specific request: signing bonus, additional vacation days, earlier performance review]?”
Negotiation Do’s and Don’ts
Do:
- Research thoroughly before negotiating
- Express enthusiasm for the role
- Base requests on market data and your value
- Ask for specific numbers, not ranges
- Get everything in writing before accepting
- Be prepared to walk away if the offer doesn’t meet your minimum
- Negotiate professionally and respectfully
- Consider the complete package, not just salary
Don’t:
- Accept the first offer immediately
- Lie about competing offers
- Make it personal or emotional
- Negotiate via email if possible – phone is better
- Focus only on what you need to pay bills
- Compare to what colleagues make
- Be aggressive or demanding
- Negotiate before receiving a formal offer
What to Negotiate Beyond Salary
Signing Bonus: One-time payment to bridge gap if base salary can’t budge (typically 5-15% of base)
Performance Bonus: Increase percentage or clarify metrics that determine bonus
Earlier Performance Review: Request 6-month review instead of annual for salary adjustment
Additional Vacation Days: If salary is fixed, an extra week of PTO has real value
Remote Work Flexibility: Negotiate work-from-home days or fully remote arrangement
Professional Development Budget: Request dedicated funds for courses, certifications, conferences
Relocation Assistance: If moving cities, negotiate moving costs coverage
Title: Sometimes a better title helps your career even if salary doesn’t change
Start Date: Negotiate for extra time if you need to complete notice period or prepare
Salary Expectations by Experience Level (India Context)
Fresher/Entry-Level Data Analyst (0-1 year):
Tier 1 Cities (Bangalore, Mumbai, Delhi): ₹3.5-6 LPA
Tier 2 Cities: ₹2.5-4.5 LPA
Junior Data Analyst (1-3 years):
Tier 1 Cities: ₹5-10 LPA
Tier 2 Cities: ₹4-7 LPA
Mid-Level Data Analyst (3-5 years):
Tier 1 Cities: ₹8-15 LPA
Tier 2 Cities: ₹6-12 LPA
Senior Data Analyst (5+ years):
Tier 1 Cities: ₹12-25 LPA
Tier 2 Cities: ₹10-18 LPA
Note: Top tech companies (FAANG) and well-funded startups often pay 20-40% above these ranges.
After Accepting the Offer
Get everything in writing including:
- Base salary
- Bonus structure
- Benefits details
- Start date
- Job title and responsibilities
- Reporting structure
- Any negotiated items
Review the offer letter carefully before signing. Once you accept, inform other companies respectfully and maintain those relationships for the future.
Section 5: Final Interview Day Preparation
The Week Before
Day 7 Before:
- Confirm interview date, time, and format (in-person, video, phone)
- Research the company thoroughly – recent news, products, culture, competitors
- Review the job description and match your experience to requirements
- Prepare 3-5 STAR method stories covering different competencies
- Begin reviewing technical concepts
Day 5-6 Before:
- Practice coding challenges on platforms like HackerRank or LeetCode
- Review SQL query patterns and practice writing queries
- Brush up on statistics fundamentals
- Prepare questions to ask interviewers
- Research your interviewers on LinkedIn if names are provided
Day 3-4 Before:
- Conduct mock interviews with friends or using AI tools
- Record yourself answering questions to evaluate body language
- Review your portfolio projects to discuss them confidently
- Prepare your “tell me about yourself” pitch
- Organize documents (resume copies, portfolio links, certifications)
Day 1-2 Before:
- Do a final technical review focusing on job-specific requirements
- Prepare your outfit and test if video interview
- Plan your route if in-person or test technology if virtual
- Review your notes on the company and role
- Get adequate sleep – being well-rested is crucial
The Night Before
Technical Preparation:
- Light review only – no cramming new concepts
- Review your resume thoroughly
- Prepare a clean notebook for taking notes during interview
- Organize digital files you might need to reference or share
Logistics:
- Set multiple alarms
- Plan your breakfast
- Choose and lay out your outfit
- Charge all devices fully
- Print extra resume copies (5-6 if in-person)
- Prepare your bag with needed items
Mental Preparation:
- Visualize the interview going well
- Review your accomplishments to boost confidence
- Do relaxation exercises if anxious
- Get 7-8 hours of sleep
- Avoid alcohol and excessive caffeine
Interview Day Morning Routine
3 Hours Before:
- Wake up early enough to feel refreshed, not rushed
- Eat a good breakfast with protein to maintain energy
- Review your key talking points briefly
- Do light exercise or stretching to release tension
- Dress professionally
1 Hour Before:
- Final appearance check (grooming, outfit, accessories)
- Gather all materials (resume copies, notebook, pen, portfolio samples)
- For virtual: test camera, microphone, internet, lighting, background
- For in-person: allow extra time for traffic and parking
- Use restroom
- Turn off or silence all notifications
15 Minutes Before:
- Arrive early (15-20 minutes for in-person)
- For virtual: log in 5 minutes early but don’t join until 2 minutes before
- Review your prepared questions one final time
- Take deep breaths to calm nerves
- Adopt confident body language
- Put your phone on complete silent mode
What to Bring (In-Person Interview)
Essential Items:
- 5-6 printed copies of your resume on quality paper
- Professional padfolio or folder
- Working pen and notebook for notes
- List of references (if requested)
- Portfolio samples if relevant
- ID and any required documents
- Breath mints
- Backup phone charger
Don’t Bring:
- Large bags or backpacks if avoidable
- Coffee or drinks into the interview room
- Strong perfume or cologne
- Visible phone or smartwatch (keep in bag on silent)
Virtual Interview Setup Checklist
Technology:
✓ Laptop or desktop preferred over phone/tablet
✓ Strong, stable internet connection (use ethernet if possible)
✓ Video conferencing software installed and tested
✓ Camera positioned at eye level
✓ Microphone tested and clear
✓ Headphones to reduce echo (optional)
✓ Charger plugged in to avoid battery dying
Environment:
✓ Quiet, private space with no interruptions
✓ Clean, professional background or virtual background
✓ Good lighting (natural light or lamp in front of you)
✓ Room temperature comfortable
✓ Doors closed, family/roommates informed
✓ Pets secured elsewhere
✓ Notifications silenced on all devices
Visual Aids Ready:
✓ Resume open for reference
✓ Job description visible
✓ Notes on company research
✓ Portfolio projects bookmarked
✓ Questions to ask typed out
✓ Glass of water nearby (off camera)
During the Interview: Best Practices
First Impressions:
- Smile genuinely when meeting interviewers
- Make eye contact and maintain it comfortably
- Offer a firm handshake (in-person)
- Thank them for the opportunity
- Match their energy level initially
Active Listening:
- Let interviewers finish questions completely before responding
- Take brief notes if offered complex scenarios
- Ask for clarification if you don’t understand something
- Don’t interrupt or talk over interviewers
Responding to Questions:
- Pause briefly before answering to collect thoughts
- Structure answers clearly with beginning, middle, end
- Use specific examples rather than generalizations
- Quantify achievements with numbers when possible
- Watch for engagement cues and adjust length accordingly
Body Language:
- Sit up straight with good posture
- Lean slightly forward to show engagement
- Use natural hand gestures while speaking
- Avoid fidgeting, crossing arms, or looking away frequently
- Nod to show understanding while listening
- Smile appropriately
Managing Difficult Questions:
- Stay calm if you don’t know an answer
- Think aloud to show problem-solving process
- Admit when you don’t know but explain how you’d find the answer
- Bridge to related knowledge you do possess
- Don’t make up information or lie
Taking Notes:
- Jot down interviewer names and key points
- Note interesting questions or insights
- Write down details for your thank-you notes
- Don’t let note-taking distract from engagement
Asking Your Questions:
- Have 5-7 questions prepared
- Cross off ones already answered during interview
- Show genuine curiosity about role and company
- Ask questions that demonstrate you’ve researched
- Listen actively to their responses
Handling Different Interview Formats
Phone Screen (20-30 minutes):
- Keep resume and notes in front of you
- Stand while talking to project energy
- Smile while speaking (it affects your voice)
- Have water nearby
- Be in a quiet location
- Focus on culture fit and basic qualifications
Video Interview (30-60 minutes):
- Dress fully professionally even off-camera
- Look at camera, not your own image
- Test everything thoroughly beforehand
- Have technical backup plan (phone number to call)
- Minimize hand gestures that look exaggerated on camera
In-Person Interview (45-90 minutes):
- Arrive 15-20 minutes early
- Be polite to everyone you encounter
- Observe office culture and environment
- Accept offered water or coffee
- Use restroom before starting
- Engage naturally and build rapport
Panel Interview (Multiple Interviewers):
- Make eye contact with all panel members
- Address the person who asked the question primarily
- Scan and include others periodically
- Remember and use names if possible
- Stay calm despite intimidation factor
Technical Assessment:
- Talk through your thinking process aloud
- Ask clarifying questions before starting
- Start with pseudocode or approach explanation
- Test your solution with examples
- Acknowledge limitations or edge cases
Whiteboard Challenge:
- Take time to understand problem fully
- Discuss approach before coding
- Write clearly with good structure
- Explain each step as you go
- Test with sample inputs
- Discuss optimization opportunities
Red Flags to Avoid
Don’t:
- Arrive late without advance communication
- Badmouth previous employers or colleagues
- Appear disinterested or low energy
- Check your phone during interview
- Interrupt or dominate conversation
- Give yes/no answers without elaboration
- Ask about salary/benefits in first interview
- Appear desperate or overly eager
- Lie or exaggerate qualifications
- Fail to ask any questions at the end
Closing the Interview Strong
As the interview winds down:
Express Enthusiasm:
“I’m really excited about this opportunity. The [specific aspect] you mentioned about the role aligns perfectly with my interests and experience.”
Summarize Your Fit:
“Based on our conversation, I believe my experience with [key qualifications] makes me a strong match for this position. I’m confident I can deliver value to your team quickly.”
Ask About Next Steps:
“What are the next steps in the interview process, and when can I expect to hear back?”
Thank Them Sincerely:
“Thank you so much for your time today. I enjoyed learning more about [company] and this role. I look forward to hearing from you.”
Get Contact Information:
“Could I have your business card or email address for follow-up?”
Post-Interview Immediate Actions
Within 1 Hour:
- Write down everything you remember while fresh
- Note questions asked and your answers
- Record impressions and concerns
- Update your interview tracking spreadsheet
Within 4 Hours:
- Draft personalized thank-you emails
- Research any topics you weren’t sure about
- Prepare materials if you promised to send anything
Within 24 Hours:
- Send customized thank-you emails to each interviewer
- Connect with interviewers on LinkedIn
- Follow up on any commitments you made
- Continue applying to other positions
Thank You Email Template
Subject: Thank You – Data Analyst Interview
Dear [Interviewer Name],
Thank you for taking the time to meet with me today to discuss the Data Analyst position at [Company]. I enjoyed learning more about the team’s work on [specific project or initiative discussed] and how this role would contribute to [company goal].
Our conversation reinforced my enthusiasm for this opportunity. I’m particularly excited about [specific aspect that interested you], and I believe my experience with [relevant skill/project] would allow me to make immediate contributions.
As discussed, I’ve attached [any materials you promised to send]. Please don’t hesitate to reach out if you need any additional information from me.
I look forward to the possibility of joining your team and contributing to [company’s] continued success.
Best regards,
[Your Name]
[Phone]
[LinkedIn URL]
Following Up After Interview
If Timeline Given:
Wait until the stated timeframe passes before following up. If they said “we’ll be in touch by Friday,” wait until the following Monday to send a polite inquiry.
If No Timeline Given:
Follow up after 7-10 business days with a brief, professional email reiterating your interest.
Follow-Up Email Template:
Subject: Following Up – Data Analyst Position
Dear [Recruiter/Hiring Manager Name],
I hope this email finds you well. I wanted to follow up on my interview for the Data Analyst position on [date]. I remain very interested in this opportunity and excited about the possibility of contributing to [Company].
I understand the hiring process takes time, and I’m happy to provide any additional information that would be helpful in your decision-making.
Thank you again for considering my application. I look forward to hearing from you.
Best regards,
[Your Name]
Handling Different Outcomes
If You Get the Offer:
- Express enthusiasm
- Ask for time to review (24-48 hours reasonable)
- Review offer letter thoroughly
- Negotiate professionally if appropriate
- Accept in writing
- Inform other companies respectfully
If You’re Rejected:
- Thank them for consideration
- Ask for feedback on how to improve
- Express interest in future opportunities
- Maintain the relationship professionally
- Learn from the experience
- Continue your job search with renewed focus
If You’re Uncertain:
- Be honest about your timeline
- Don’t accept an offer you plan to reject
- Don’t reject an offer impulsively
- Consult trusted mentors or advisors
- Make a pros/cons list
- Trust your instincts
Stress Management Techniques
Before Interview:
- Deep breathing exercises (4-7-8 technique)
- Light physical activity to release tension
- Positive visualization of success
- Power posing to boost confidence
- Listening to calming or energizing music
During Interview:
- Pause and breathe before answering
- Take a sip of water if offered
- Remember interviewers want you to succeed
- Focus on the conversation, not your nervousness
- Reframe anxiety as excitement
After Interview:
- Don’t obsess over what you should have said
- Treat yourself to something enjoyable
- Exercise or do stress-relieving activity
- Talk to supportive friends/family
- Focus on what you can control (continued preparation)
Section 6: Long-Term Career Development Strategy
First 90 Days in New Role
Once you land the job, set yourself up for success:
Month 1 – Learn and Absorb:
- Understand company culture and processes
- Meet team members and stakeholders
- Learn data systems and tools
- Ask lots of questions
- Complete initial training
- Deliver small quick wins
Month 2 – Contribute Independently:
- Take ownership of assigned projects
- Build relationships across departments
- Start identifying process improvements
- Demonstrate reliability and initiative
- Seek feedback actively
- Document learnings
Month 3 – Add Strategic Value:
- Propose new analyses or insights
- Share knowledge with team
- Identify larger opportunities
- Build credibility as expert
- Set goals for next six months
- Request feedback session
Continuing Education
Stay current in this rapidly evolving field:
Technical Skills:
- Learn new tools (Databricks, Snowflake, dbt)
- Deepen Python or R skills
- Explore machine learning deeper
- Master cloud platforms (AWS, Azure, GCP)
- Stay updated on AI tools
Soft Skills:
- Improve presentation abilities
- Enhance business acumen
- Develop leadership capabilities
- Strengthen stakeholder management
- Build industry knowledge
Learning Resources:
- Online courses (Coursera, edX, DataCamp)
- Industry blogs and newsletters
- Podcasts about data analytics
- YouTube channels (StatQuest, Ken Jee)
- Books on analytics and business
- Professional conferences and meetups
Building Your Network
Online Networking:
- Stay active on LinkedIn
- Participate in data analytics communities
- Contribute to open-source projects
- Answer questions on Stack Overflow
- Share your knowledge through blogs
Offline Networking:
- Attend local data meetups
- Join professional organizations
- Participate in hackathons
- Speak at conferences or meetups
- Connect with alumni networks
Career Path Options
Individual Contributor Track:
Junior Analyst → Data Analyst → Senior Data Analyst → Lead Data Analyst → Principal Data Analyst → Distinguished Data Analyst
Management Track:
Data Analyst → Senior Data Analyst → Analytics Manager → Senior Manager → Director of Analytics → VP of Analytics
Specialist Tracks:
- Business Intelligence Specialist
- Data Visualization Expert
- Analytics Engineer
- Product Analyst
- Marketing Analyst
- Financial Analyst
Transition Paths:
- Data Scientist (more ML/AI focus)
- Data Engineer (more infrastructure focus)
- Product Manager (business strategy focus)
- Analytics Consultant (advisory focus)
Final Motivation and Encouragement
Preparing for data analytics interviews is a journey that requires dedication, practice, and persistence. You’ve invested time in learning technical skills through the AI-Powered Data Analytics course, and now you’re investing in interview preparation – this combination positions you strongly for success.
Remember that every interview, whether successful or not, is a learning opportunity. Each conversation with potential employers teaches you something about the industry, role expectations, and your own strengths and areas for growth.
The data analytics field is experiencing tremendous growth, with companies across all industries recognizing the value of data-driven decision making. Your skills in SQL, Python, Power BI, Tableau, statistics, and AI-powered analytics are in high demand. Combined with strong communication skills and business acumen, you have everything needed to launch a successful career.
Stay confident in your abilities while remaining humble and eager to learn. Show genuine enthusiasm for the work, curiosity about business problems, and willingness to collaborate with diverse teams. These qualities, combined with solid technical skills, make you a compelling candidate.
Your journey doesn’t end with landing a job – it’s just the beginning. The field of data analytics evolves constantly, offering endless opportunities to learn, grow, and make meaningful impact. Embrace continuous learning, build strong professional relationships, and always stay curious about solving problems with data.
You’ve prepared thoroughly with this comprehensive guide. Now go confidently into your interviews knowing that you have the knowledge, skills, and preparation to succeed. Trust your preparation, be authentically yourself, and let your passion for data analytics shine through.
Best of luck in your interviews and your data analytics career!