Predictive vs Prescriptive Analytics: Differences and Examples
Recommended Learning Path
What Is Predictive & Prescriptive Analytics?
Understanding Predictive vs Prescriptive Analytics
Predictive vs Prescriptive Analytics: How Do They Differ?
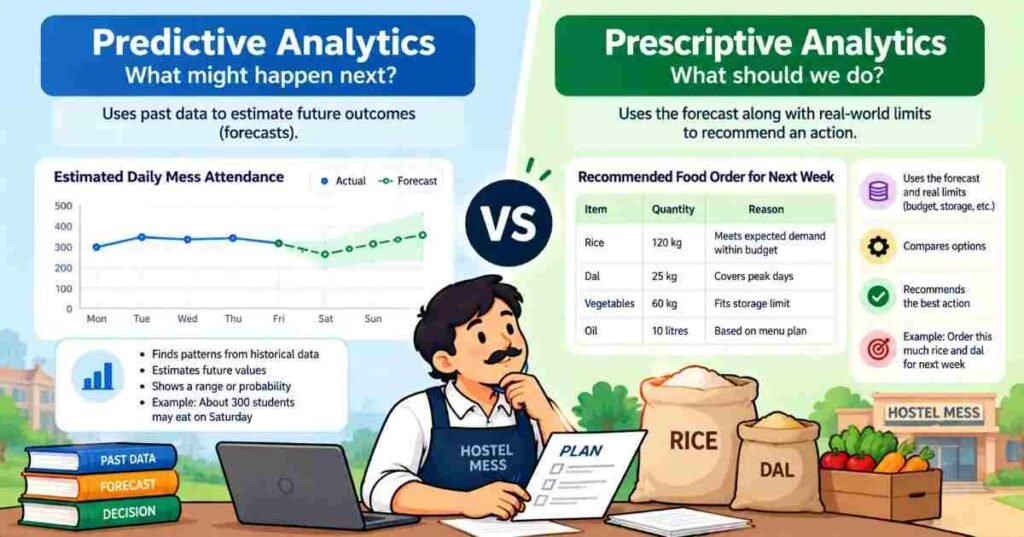
Every engineering hostel has a mess manager who quietly runs a small analytics problem. He knows Sunday dinners are thin, exam weeks are heavy, and the day after a fest the kitchen is nearly empty. He carries a rough forecast in his head. Then he still has to decide how much rice to order, with a fixed budget and a storeroom that holds only so much. The forecast and the decision are two separate jobs, and that separation is exactly what predictive vs prescriptive analytics is about.
Quick Answer
Predictive analytics estimates what is probably coming. Prescriptive analytics takes such an estimate and recommends what to do, inside real limits like money, space and time. If your output says “about 300 students will eat on Saturday,” that is predictive. If it says “order this much rice and this much dal, because that fits the budget and the store,” that is prescriptive. In our experience, learners understand this faster through a decision than through a definition.
Follow the mess manager through one week
Let’s use made-up numbers for a hostel in Guntur. These are illustrative, not data from a real hostel.
Suppose the manager has six months of daily headcounts. He notices that weekday dinners hover near 320 plates, Saturdays dip, Sundays dip further, and the Monday after a holiday weekend is unpredictable. A simple model that looks at day of week, exam calendar and holidays can turn that history into a guess for each coming day, along with a sense of how far off the guess might be. That is the predictive part, and it ends with a number and a margin.
Now the manager faces three awkward facts. His monthly grocery budget is capped. The storeroom spoils rice if too much sits for weeks. And the supplier delivers only on Tuesdays and Fridays. The forecast says nothing about any of this. It cannot tell him whether to order extra on Tuesday to cover the weekend, or whether the saving from a bulk order is worth the storage risk.
The prescriptive part brings those facts in. It asks: given the expected plates for each day, the cap on spending, the storage limit and the delivery days, what quantity should arrive on each delivery to avoid running short without throwing food away? The answer is an order plan, not a forecast.
Predictive work shrinks the fog about demand. Prescriptive work turns that clearer picture into a choice.
Why this difference matters for your career
Hiring managers, in our opinion, are more impressed by learners who can connect a forecast to a decision than by learners who can only run a model. A forecast with no decision attached is a half-finished piece of work. A recommendation built on a shaky forecast is risky in a different way, because it looks confident while resting on weak ground. A good analyst keeps both halves honest.
Most entry-level analyst jobs lean on cleaning data, writing queries and building dashboards, with some forecasting appearing over time. Decision-focused methods, such as optimisation, tend to come later and may need extra study. We suggest not rushing there. Without tidy data and sound statistics underneath, an advanced method just produces wrong answers faster.
Do you need machine learning for this?
Not on day one. Many first forecasts are simple: a trend line, a seasonal pattern, a moving average. Machine learning earns its place when patterns are tangled and simple methods stop working. On the decision side, the method can be a spreadsheet with a few clearly stated rules, or a proper optimisation tool, depending on how complicated the limits are. The thinking comes first and the tooling follows.
A small test you can run on any project
When you finish an analysis, read your last paragraph and ask: “So what should someone do on Monday?”
If your last paragraph can’t answer, you have a forecast or a description. If it names an action, mentions what limits that action, and says why it beats the alternatives, you have crossed into prescriptive territory. Use this on your own portfolio projects, because it shows you what to add.
Habits we’d encourage
We would rather see one small project done in three stages than three models with no conclusions. The three stages are:
Expect. State what you think will happen and how sure you are. Show a range instead of a single number.
Choose. List the actions that are realistically open to the decision-maker. Be honest about limits.
Justify. Recommend one option and say what trade-off it accepts. A recommendation without a trade-off is usually hiding something.
Something to try this month
Pick a public dataset about sales, footfall or ticket bookings. Build a basic dashboard. Add a simple forecast for the next few periods and write down the assumptions behind it. Then write half a page recommending one action, with the limits you assumed and one alternative you rejected. Note how you checked the forecast against past data you held back.
That sequence gives you a descriptive piece, a predictive piece and a prescriptive piece in one portfolio item. If you would like guided practice with feedback, an AI Data Analytics course can give the path some structure.
FAQs
- Is a forecast ever enough on its own?
Sometimes, when the decision is obvious or someone else owns it. But if people read your forecast and still don’t know what to do, the work is unfinished. - Why do prescriptive projects fail?
Usually because the limits were guessed or left out. A plan that ignores real constraints can’t be carried out. - Which should a fresher practise first?
Start with clean data and simple forecasts. Add decision thinking as soon as you have a forecast, even if the method is only a written comparison of options. - Does every company use both?
Not always, and that varies widely. Smaller teams may stop at reporting and basic forecasts. Look at the postings for the roles you want. - Can I do prescriptive work in Excel?
Simple versions, yes. A forecast table and a small set of scenarios can already guide a choice. Larger problems need dedicated tools. - What if my forecast is wrong?
It will be, sometimes. Compare it with what actually happened, adjust and say so. Showing a range from the start makes surprises easier to explain.