How Long to Learn Data Analytics :
A Realistic Plan
Recommended Learning Path
What Is a Data Analytics?
Understanding Data Analytics for Beginners
How Long Does It Take to Learn Data Analytics as a Beginner?
Ask ten learners how long it takes and you’ll hear “three months”, “six months” and “a year”, each said with certainty. The disagreement exists because they are answering different questions. Some mean finishing a course. Others mean being able to do real work. This guide helps you work out how long to learn data analytics for your situation, instead of borrowing someone else’s number.
Quick Answer
For a complete beginner, learning the core skills (spreadsheets, SQL, a dashboard tool and basic statistics) and building a few explained projects usually takes a few months of steady practice. The honest range is wide, because it depends on how many hours you can give each week. Below, we convert the question into hours so you can calculate your own timeline. These are FLM planning estimates, not guarantees, and finishing your learning does not guarantee a job.
Think in hours, not months
“Six months” means very different things to a student with free afternoons and a professional with an hour at night. So we find it more useful to think about the total effort first, then divide by your weekly time.
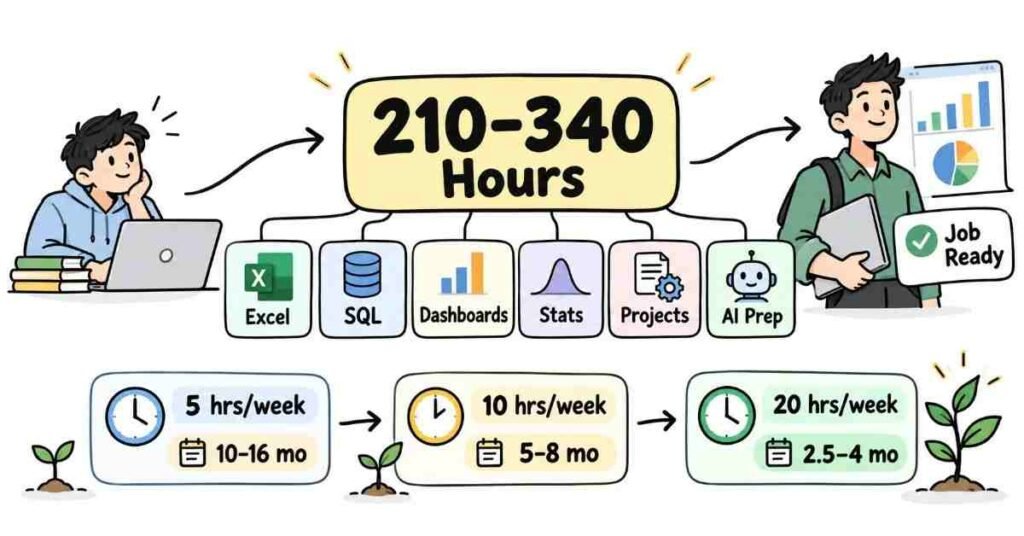
Here is our working estimate of the effort for a beginner who wants to reach a basic working level:
Skill block | Rough hours (our estimate) |
Excel for analysis | 30–50 |
SQL basics | 40–60 |
One dashboard tool | 30–50 |
Basic statistics | 30–50 |
Two or three explained projects | 60–100 |
AI-assistant practice, CV and interview prep | 20–30 |
Total | about 210–340 hours |
These are planning numbers from our experience, not results of a study. Individual learners vary a lot, so validate them with trainers.
What that means per week
Divide the total by the hours you can really give:
Hours per week | Approximate duration |
5 hours | about 10–16 months |
10 hours | about 5–8 months |
20 hours | about 2.5–4 months |
Most delays come from the gap between the hours learners plan and the hours they actually manage. A plan you can keep at 7 hours is better than one you abandon at 20.
What stretches or shortens your timeline
- Your starting point. If you already use Excel at work, you may save weeks. If numbers make you nervous, add time for statistics.
- Consistency. Five steady hours a week usually beats a 20-hour burst followed by a month of nothing. (Our opinion from teaching experience.)
- How much you practise versus watch. Watching someone write a query feels like progress. Writing your own and fixing the errors is where skill forms. We lean toward spending more time on practice than on watching. (Opinion, not a statistic.)
- Feedback. Someone reviewing your work shortens the time you spend stuck on a wrong habit.
- Language comfort. Many Telugu-speaking learners find concepts click faster when explained in a familiar language, while tool names and documentation remain in English. Plan time to get used to the English terms.
- Your goal. Understanding basics for your current job is faster than preparing to compete for analyst roles.
Learning the tools is not the same as being job-ready
This is the part most timelines skip. Finishing the skill blocks means you know the tools. Being ready to apply means you can also:
- Solve a small task live, such as filtering, joining and grouping two tables.
- Explain a project from question to check.
- Show proof an employer can open, such as a dashboard and a short write-up.
That is why the table above includes project and interview-prep hours. How long a job search takes depends on the employer, the city and the market, and we can’t promise a timeline for it. (Check current postings in AP and Telangana to see what employers ask for.)
Two realistic scenarios
These are illustrative, not real cases.
A final-year student in Nellore has about 12 free hours a week during the last semester. At that pace, her total effort suggests roughly four to six months. She spends the first six weeks on Excel and SQL, the next six on a dashboard tool and statistics, and the remaining weeks on two projects. She keeps one weekly session for reviewing her mistakes.
A working professional in Hyderabad can manage about six hours a week: an hour on weekday evenings and a longer Sunday session. At that pace, the same effort stretches to about a year. His plan is slower but steady, and he uses his own job’s reports as his project data, which saves him from hunting for datasets.
Neither pace is better. The point is that each plan matches the hours the person genuinely has.
Mistakes to avoid
- Copying someone else’s timeline. Their hours and starting point aren’t yours.
- Planning more hours than you have. Overplanning leads to dropping out. Start smaller.
- Mistaking course completion for skill. A finished video list is not a finished skill.
- Skipping projects to save time. Projects are where learning sticks and where proof comes from.
- Rushing to AI tools. An assistant can speed you up, but you need the basics to check its output.
- Waiting until you’ve “learned everything”. Start a small project early. You will learn faster by getting stuck on a real problem.
- Believing guarantees. Be careful with anyone who promises a fixed duration or a job.
FLM Expert Perspective: The “Hours Bank” Habit
We suggest treating your learning like a bank account:
- Know the balance. Estimate the total hours needed, as in the table above.
- Make regular deposits. Block fixed hours each week and protect them.
- Review the statement. Once a month, check how many hours you actually logged, and adjust your plan to match.
If you log fewer hours than planned, change the plan, not your expectations of yourself
How to structure a practice week
A simple weekly pattern (adjust to your hours):
- Two short sessions on new material, such as one SQL concept or one Excel technique.
- One longer practice session applying it to a real dataset, with no tutorial open.
- One review session to fix errors and write down what you learned.
- A monthly check: what did you build this month that someone else could open?
This keeps you practising, not just watching. If you’d like structure and feedback within a plan like this, a Data Analytics training programme can help you stay consistent.
FAQs
- How long does it take to learn data analytics?
For most beginners, a few months of steady practice to reach a basic working level, but it depends heavily on weekly hours and starting point. - Can I learn it in three months?
Possibly, if you can put in many hours each week. At a lower pace, expect longer. Rushing tends to skip project work. - How many hours a week do I need?
There is no fixed number. Use the hours table above to see what different weekly hours mean for your timeline. - Can I learn while working a full-time job?
Yes, many people do, at a slower pace. A steady weekly routine matters more than long occasional sessions. - Am I job-ready after finishing the tools?
Not automatically. You also need projects, explanations and the ability to solve small tasks. Hiring outcomes vary and can’t be guaranteed. - Do I need to learn Python?
Often not for entry-level roles. Check the postings you’re targeting. - Does AI make it faster to learn?
It can help explain errors and draft practice code, but you must check its output. Use it as a helper after you know the basics.