Excel vs SQL for Data Analytics : Which to Learn First?
Recommended Learning Path
What Is Excel vs SQL for Data Analytics?
Understanding uses of Excel vs SQL for Data Analytics
Introduction
If you’re new to data analytics, learn Excel first if you need a gentle introduction to working with tables and summaries; learn SQL first if you already have access to databases or want to retrieve data from them. For most beginners, the best long-term choice is to learn both: Excel helps you inspect and present data, while SQL helps you retrieve and organize data stored in databases.
Quick Answer
Choose Excel first if… | Choose SQL first if… |
You’re new to rows, columns, formulas, and charts. | You need to query data stored in database tables. |
You want to practise with small files and build quick summaries. | You want to filter, group, or combine records through queries. |
You’re comfortable exploring data visually. | You’re ready to learn basic query logic and syntax. |
Neither tool replaces the other. Your choice depends on the data you have and the task you need to complete.
What’s the difference between Excel and SQL?
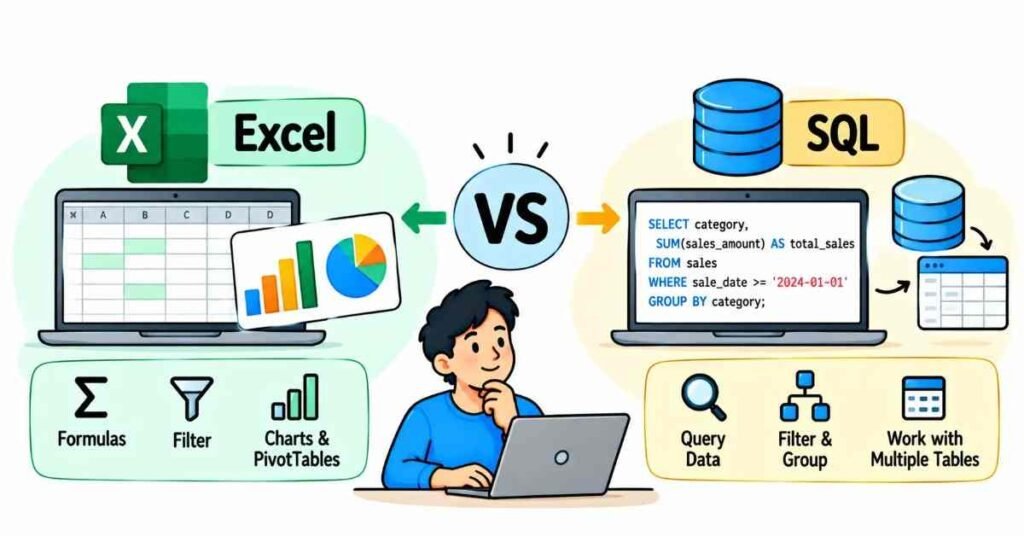
Excel is a spreadsheet application. You work with data in worksheets and can use formulas, filters, charts, and PivotTables to inspect and summarize it. Microsoft describes PivotTables as a way to summarize, analyze, explore, and present data.
SQL—Structured Query Language—is used to work with data held in relational databases. Analysts can use queries to select particular columns and rows, filter results, group records, and combine data from tables. For example, SQL Server’s SELECT statement retrieves chosen rows or columns from one or more database tables.
A simple way to remember the difference:
- Excel is a place to work directly with a spreadsheet and explore or present its contents.
- SQL is a way to ask a database for the records you need.
Excel vs SQL: how do they compare?
Area | Excel | SQL |
Main working environment | Worksheets in a workbook | Tables in a database |
Typical interaction | Click, type, use formulas, sort, filter, and build PivotTables | Write queries to retrieve and shape data |
Useful for | Inspecting files, quick calculations, summaries, and reports | Querying database records and combining related tables |
Common output | Workbook, chart, or PivotTable | A query result set that can be reviewed or used elsewhere |
Learning experience | Visual and familiar for many beginners | Requires learning query structure and database concepts |
Best fit | One-off or interactive analysis on worksheet data | Repeatable data retrieval and analysis from databases |
The tools can also work together. Excel can connect to external sources, including SQL Server, and use retrieved data in a PivotTable.
A practical example: analysing monthly sales
Suppose a small business wants to find sales by product category.
With Excel
If the sales records are already in a spreadsheet, you could:
- Check that the columns have clear headings, such as date, product, category, and amount.
- Filter the records to the required month.
- Create a PivotTable to summarize sales by category.
- Use a chart to present the result.
PivotTables support summarizing and filtering data, including grouping numerical values by categories.
With SQL
If the sales records are stored in database tables, you could query the database for the needed fields, filter by date, and group sales by category. A simplified example might look like this:
sql
SELECT category, SUM(sales_amount) AS total_sales
FROM sales
WHERE sale_date >= ‘2026-09-01’
AND sale_date < ‘2026-10-01’
GROUP BY category;
This example assumes a database table named sales with the listed columns. The exact table and field names depend on the database. SQL’s SELECT syntax supports retrieving data and using clauses such as WHERE and GROUP BY.
In practice: SQL might retrieve and aggregate the records; Excel might then help someone inspect the results or prepare a spreadsheet report.
Which should you learn first?
Start with Excel if you’re completely new
Excel can be a practical starting point for learning how tabular data is organized. Begin with:
- Rows, columns, headers, and data types.
- Sorting and filtering.
- Basic formulas and functions.
- Tables and PivotTables.
- Simple charts and checking results for errors.
Avoid treating Excel as only a formatting tool. Practise explaining what a summary means, not just making it look polished.
Start with SQL if your work begins in a database
Choose SQL first if you already know the basics of data tables or expect to retrieve data from a database. Start with:
- SELECT to choose fields.
- WHERE to filter records.
- ORDER BY to sort results.
- GROUP BY and aggregate functions such as SUM and COUNT.
- Joins, once you understand how tables relate.
Practise reading each query as a question: “Which fields do I need, from which table, and which records should be included?”
Learn both for a complete workflow
A practical beginner sequence is:
- Use Excel to understand columns, clean a small file, and create a basic summary.
- Learn SQL to retrieve and filter database records.
- Practise grouping records and combining related tables with SQL.
- Export or connect query results to Excel for review or reporting.
- Check that totals and filters make sense in both places.
This sequence is a learning recommendation, not a requirement. If your current role or project uses databases from day one, move SQL earlier.
Does Excel’s row limit mean SQL is always better for large data?
No. Excel has a worksheet limit of 1,048,576 rows and 16,384 columns, and workbook performance also depends on available memory and system resources. But that limit alone does not determine which tool is best: the data source, task, workbook setup, and analysis workflow matter too.
If data is already stored in a database, querying it there may be more appropriate than trying to place every record into a worksheet. If you have a manageable file and need to examine or present it, Excel may be convenient. For very large or complex work, teams may use databases and other analytics tools rather than relying on a single spreadsheet.
Common mistakes to avoid
- Treating Excel and SQL as competitors: They solve different parts of many analytics workflows.
- Assuming SQL is only for programmers: Beginners can start with basic queries and build up gradually.
- Assuming Excel is only for small calculations: It includes tools for summarizing data and can connect to external data sources.
- Choosing based only on data size: Consider where the data lives and what you need to do with it.
- Learning syntax without checking the result: In either tool, verify filters, totals, and assumptions before sharing findings.
FLM learning perspective
Use a source–task–output check when deciding which tool to use:
- Source: Is the data in a worksheet or a database?
- Task: Do you need to explore and present it, or retrieve and combine specific records?
- Output: Do you need a workbook or report, a query result, or both?
For example, a learner working with a class attendance spreadsheet might start in Excel. If attendance records are stored across database tables and the learner needs to combine student and session records, SQL may be the more suitable starting point for that task.
If you’re building analytics skills step by step, you can explore FLM’s AI Data Analytics Course to see whether its learning content aligns with your goals.
FAQs
- Is Excel easier than SQL for beginners?
Many beginners find Excel’s visual worksheet format approachable. SQL involves learning query syntax, but beginners can start with a small set of commands and practise them on simple datasets. - Can I do data analytics with only Excel?
You can perform many analyses in Excel, such as filtering, calculating, summarizing, and charting worksheet data. Whether Excel alone is sufficient depends on the data source and the requirements of the task. - Do data analysts use both Excel and SQL?
They can be used together: SQL can retrieve or summarize records from a database, and Excel can help review or present results. The exact tools used depend on the organization and project. - Should I learn SQL before Excel?
Not necessarily. If you’re new to working with data, Excel can help you understand tabular data first. If you already need to query databases, starting with SQL may make more sense. - Can Excel connect to a SQL database?
Yes. Excel supports creating PivotTables using external sources such as SQL Server, subject to the relevant connection and access setup. - Does SQL replace Excel?
No. SQL retrieves and works with database data; Excel provides spreadsheet features for analysis and presentation. Some workflows use both. - Is SQL useful for large datasets?
SQL is useful when data is stored in a relational database and needs to be queried there. Whether it is the right tool depends on the database, task, and broader analytics setup—not just the number of rows.