Can Freshers Learn Data Analytics Without Coding ?
Recommended Learning Path
What Is a Data Analytics?
Understanding Data Analytics for Beginners
Can a Fresher Learn Data Analytics Without Coding Experience?
Yes. You can begin learning data analytics without having written a program before. Start by understanding tables, checking records, calculating useful measures, and explaining what the results mean.
The important distinction is experience: you do not need coding experience before your first lesson, but you should expect to develop technical skills as you progress. Google’s India beginner analytics program, for example, accepts learners without prior experience or tool knowledge, while its curriculum includes SQL and programming
Quick Answer
A beginner can start with a spreadsheet and a small dataset. Your first task might be to clean inconsistent labels, compare totals, or build a chart that answers one question.
You do not need to begin with Python, machine learning, or a complicated dashboard. You do need to become comfortable checking your work.
Learning analytics is not simply learning which buttons to click. It is learning how to turn records into an answer someone can use.
What do you learn before programming?
Suppose a shop gives you a file of customer orders. Before writing any code, you need to understand:
- What does each row represent: an order, an item, or a payment?
- Are dates stored consistently?
- Do cancelled orders belong in the sales total?
- Are missing values genuinely unknown, or do they mean zero?
- What question are you trying to answer?
These decisions affect the result regardless of the tool.
For your first exercises, practise:
- Reading a table and identifying its columns.
- Checking duplicates and incomplete entries.
- Using percentages and averages appropriately.
- Summarizing a clearly defined group of records.
- Writing a short explanation of the finding.
Google’s beginner curriculum similarly includes preparing, cleaning, analysing, and presenting data not just programming.
What counts as coding in analytics?
The word “coding” can make several different learning tasks sound like one large obstacle.
Skill | What you actually do | Suggested place in your learning |
Spreadsheet formulas | Write calculations using cell references and functions | Early |
Visual transformations | Apply steps through menus, then inspect the result | Early |
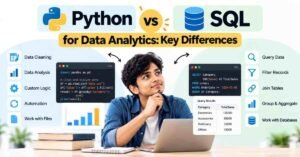
SQL queries | Write instructions to select, filter, group, or combine database records | After basic table practice |
DAX expressions | Define calculations for Power BI models | As reporting requirements grow |
Python or R scripts | Write programs for analysis and other processing tasks | When your learning goals or projects require them |
This is a recommended sequence, not a rule for every course.
SQL involves writing query syntax, so it should not be advertised as completely “non-coding.” However, learning to request records from a database is a different starting task from building a general-purpose program.
Can Excel and Power BI help you start?
They can be useful starting tools, provided you do not confuse a visual interface with the absence of technical reasoning.
In Excel, begin with a clean table, basic formulas, filtering, and a summary that you understand. In Power BI, start with a simple report rather than trying to master every feature.
Power Query offers a graphical way to create data-transformation steps. Microsoft explains that the editor generates the underlying M code automatically. You can therefore perform many initial transformations without writing that code yourself.
But Power BI is not permanently code-free. Microsoft’s analyst certification expects Power Query and DAX proficiency, showing that deeper use involves additional technical learning.
Your first project: examine delivery delays
Use a public or synthetic dataset containing:
- Order ID.
- Promised delivery date.
- Actual delivery date.
- Delivery area.
- Order status.
This is a suggested practice project, not a real FLM student case study.
Ask one question: “Which delivery areas have the highest share of completed orders arriving late?”
Step 1: Understand the records
Check whether an order appears more than once. Separate cancelled orders from completed deliveries. Do not automatically classify an order with a missing delivery date as on time.
Step 2: Define “late”
For this exercise, count a completed order as late when its actual delivery date is after its promised date.
Record that definition so another person can reproduce your calculation.
Step 3: Compare like with like
Calculate the late-delivery share for each area using completed orders with valid dates.
An area with more late orders may simply have more orders overall. Comparing a defined percentage helps you avoid that misunderstanding.
Step 4: Explain the limit
Your report may show where delays are concentrated. It does not establish why they happened unless the dataset contains evidence about causes.
Deliver a cleaned file, one summary table, one chart, and a short explanation. That is enough for a meaningful first exercise.
When should you add SQL or Python?
Add SQL when you want to practise working with data stored across database tables. Revisit the same delivery project: retrieve a chosen period, group records by area, and check whether your totals match the spreadsheet version.
Consider Python or R when your course, project, or target role calls for programming—for example, a more involved processing workflow.
Do not delay all analysis until you “finish coding.” Equally, do not assume a first spreadsheet project means your technical learning is complete.
A practical learning path for freshers
Use these milestones to judge progress:
- First: You can describe what each row represents and identify obvious data problems.
- Next: You can calculate and explain a measure without copying someone else’s answer.
- Then: You can present a small analysis with assumptions and limitations.
- After that: You can write basic queries and check the returned records.
- Later: You can add formulas, scripts, or other techniques when a task needs them.
If you prefer learning explanations in Telugu, keep a small glossary connecting the terms you use in class with the English labels shown in tools.
For a structured option, review FLM’s course to learn AI-powered Data Analytics and confirm whether its current prerequisites and beginner practice match your needs.
Proposed FLM perspective: explain before you automate
A learning principle for FLM’s reviewer to approve is: “Explain the small version before automating the large version.”
Before relying on a tool or AI-generated answer, explain:
- Which records belong in the analysis.
- How the calculation works.
- How you checked the result.
- What the result cannot tell you.
This keeps the focus on understanding rather than on producing an impressive-looking output.
Mistakes that make beginners feel stuck
- Trying to learn several tools before completing one small task.
- Treating missing values as zero without checking their meaning.
- Copying formulas or generated queries without understanding them.
- Assuming every chart supports a business conclusion.
- Looking only for “no-code” courses while avoiding all technical learning.
- Expecting one training program to satisfy every job’s requirements.
For applications, read the actual vacancy. Learning accessibility and employer eligibility are separate questions.
FAQs
- Can I start data analytics if I have never coded?
Yes. Beginner learning pathways exist without previous experience. You can begin with tables and spreadsheets while gradually adding technical skills. - Does “without coding experience” mean “without learning code”?
No. It describes your starting point. A course may welcome complete beginners and later teach queries or programming. - Is SQL coding?
SQL requires written query syntax. It is different from general-purpose programming, but it is misleading to describe SQL work as entirely no-code. - Do I need Python on day one?
Not for the starter project recommended here. Whether you need it later depends on your chosen course, project, and job requirements. - Can I use Power BI without writing code?
You can begin with visual features, and Power Query generates M code for transformation steps. More advanced work may involve DAX and other technical skills.learn. - Can AI do the technical work for me?
Use AI-generated formulas or queries as drafts to inspect. Do not include an answer in your project unless you can explain and verify it. - How long will learning take?
There is no single timeline for every fresher. Track what you can demonstrate: cleaning records, checking calculations, explaining findings, and completing increasingly demanding tasks.