Data Analyst vs Data Scientist : Roles, Skills & Career
Recommended Learning Path
What Is a Data Analyst vs Scientist?
Understanding the Data Analyst vs Data Scientist differences
What Is the Difference Between Data Analyst and Data Scientist Roles?
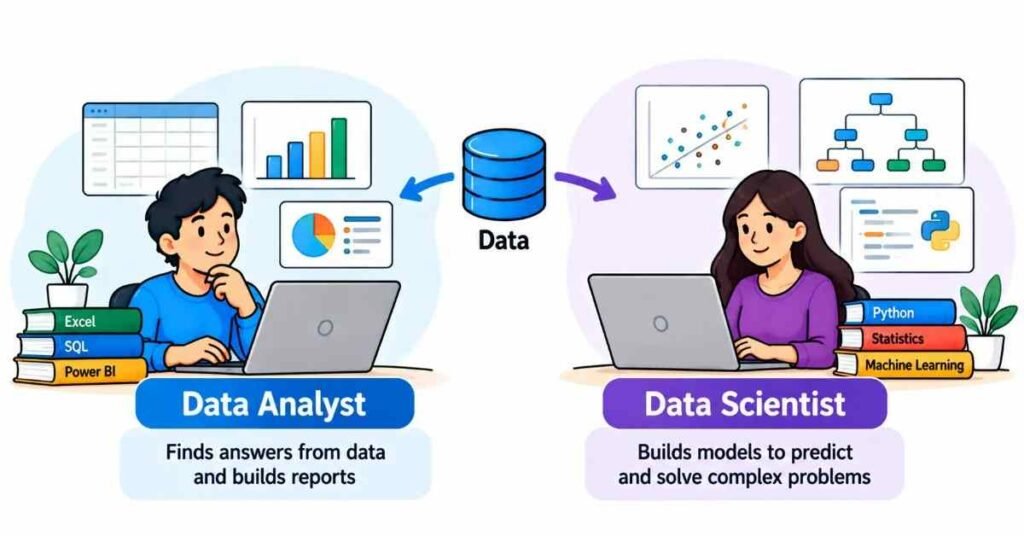
Two people can sit in the same office, open the same database, and still be doing different jobs. One answers the question a manager asked this morning. The other builds something that keeps answering a question long after the meeting ends. That is the heart of data analyst vs data scientist, and the clearest way to see it is to look at the problems each role takes on and what each one hands over.
Quick Answer
A data analyst typically works on understanding what is happening in the business and why, using SQL, spreadsheets, dashboards and basic statistics. A data scientist typically works on problems that need a model, such as predicting an outcome or finding patterns too complex to see by eye, using programming, deeper statistics and machine learning. Both clean data, use statistics and explain results. Job titles vary a lot between companies, so read the responsibilities in a posting rather than trusting the title.
Do titles tell you the real work?
Not reliably. Some companies give an analyst the work of a scientist, and some small teams have one person doing both. Others use “data scientist” for any analytics job. Treat everything below as a common pattern, not a rule. The responsibilities section of a job post tells you far more than the title does.
The problems each role usually takes on
| | Data analyst | Data scientist |
Typical problem | “Why did returns rise last quarter?” | “Which orders are likely to be returned, so we can act before they ship?” |
Nature of the question | Usually explains something that already happened | Often estimates something not yet known |
Data size and shape | Often tables from business systems | Can include larger or less tidy data |
Core methods | Queries, aggregation, trend analysis, visualisation | Statistical modelling, machine learning, experiments |
Main tools | SQL, Excel, a BI tool such as Power BI or Tableau | Python or R, SQL, notebooks, modelling libraries |
Works most closely with | Business and operations teams | Engineering and product teams, plus the business |
The Handover Test
Here is a way to separate the roles that we find clearer than a skills list. Ask: what does this person hand over when the work is done?
- An analyst usually hands over a finding or a report: a clear answer, a dashboard, a recommendation a manager can act on this week.
- A data scientist usually hands over a model or a method: something that other people or systems can run again and again, with its limits explained.
Neither handover is higher or lower. A brilliant model nobody trusts is useless, and a sharp finding that arrives too late is too. The test simply shows you which kind of work you would rather do.
Where the two roles overlap
The overlap is larger than many beginners expect, and it explains why people move between the roles:
- SQL to pull and prepare data.
- Statistics to avoid fooling yourself with averages, small samples or coincidences.
- Data cleaning, which takes up a large share of time in both.
- Visualisation, to show results clearly.
- Communication, because findings nobody understands change nothing.
If you build these five, you are prepared for either path. The split mostly appears in how deep you go on statistics and programming.
Mistakes freshers often make
Imagine a courier company in Vijayawada that is getting complaints about late parcels. This is an illustrative scenario, not a real case.
The analyst’s work. She pulls a quarter of delivery records and compares on-time rates by route, day and warehouse. She finds that one warehouse’s late deliveries jump on Mondays, and that the rise starts after a change in the pickup schedule. She builds a dashboard for the operations head and recommends restoring the old schedule on trial. What she hands over is a finding, a dashboard and a recommendation.
The data scientist’s work. He takes a related but different problem: “Can we tell at dispatch time which parcels are likely to be late?” He builds a model using route, weight, time of dispatch, weather and warehouse load, tests how well it predicts on parcels it hasn’t seen, and works with the engineering team to put it into the dispatch system so staff get an alert. What he hands over is a model, a measure of how reliable it is, and a plan for monitoring it.
Both used SQL and statistics. One explained a problem. The other built a way to see problems coming.
Which role is realistic for a fresher?
In our opinion, most freshers have an easier path into analyst-type roles, because the entry skills (Excel, SQL, a dashboard tool, basic statistics) can be learned step by step and shown through projects. Data scientist roles often ask for stronger programming and statistics, and some postings may prefer particular degrees. That is a pattern, not a rule, and it varies by employer. (Check 5 to 10 postings in AP and Telangana for both titles.)
Starting with analytics does not lock you out of data science. Many learners begin with the shared skills and add Python and machine learning later.
Mistakes to avoid
- Treating one role as the “senior” version of the other. They are different jobs with different strengths.
- Choosing by title or by what sounds impressive. Read what the work involves.
- Starting with machine learning. Without clean data and statistics, models mislead.
- Assuming analysts don’t need statistics. They do. The depth differs.
- Assuming scientists don’t need business sense. A model that solves the wrong problem has no value.
- Leaning on AI tools to skip the basics. An assistant can draft code, but you must understand it to know when it is wrong.
- Believing guarantees. No course or article can promise a role.
FLM Expert Perspective: Choose Your First Handover
Instead of asking “which role is better?”, we encourage learners to ask which handover they want to practise first.
- A finding. Pick a dataset, ask a “why” question, answer it clearly and check your numbers.
- A model. Pick a simple prediction, such as next month’s sales, test it on data you held back and explain how wrong it can be.
Do the first as soon as you have SQL and a dashboard tool. Try the second once you are comfortable with statistics. How you feel after each one is better evidence than any article.
A step-by-step path
FAQs
- What is the main difference between a data analyst and a data scientist?
A data analyst commonly explains what is happening using existing data, while a data scientist commonly builds models to predict or automate. The roles overlap, and titles vary by company. - Which skills do both roles share?
SQL, statistics, data cleaning, visualisation and communication. - Is data science harder than data analytics?
It often asks for deeper programming and statistics, so the learning path is usually steeper. Both become demanding at senior levels. - Can I become a data scientist if I start as an analyst?
Many people try this route. You would add programming and machine learning to the shared foundation. Outcomes vary and can’t be guaranteed. - Do data analysts need Python?
Often not at entry level, but check the postings you’re targeting. It can be a useful addition. - Which role should a non-IT graduate aim for first?
Many start with analytics skills because the entry steps are more gradual, then decide. Your interest matters more than the label. - Do job titles always match the work?
No. Read the responsibilities.