AI Data Analytics Career for Freshers : How to Start
Recommended Learning Path
What Is a AI Data Analytics?
Understanding AI Data Analytics for Beginners
Can a Fresher Start a Career in AI-Powered Data Analytics?
Every year, a fresh batch of graduates asks the same careful question: “I have no experience, so can I really start?” For AI-powered data analytics, the honest answer is yes, you can start. But a fresher doesn’t get hired for potential alone. They get hired for evidence. This guide is about what that evidence looks like and how to build it.
Quick Answer
Yes, a fresher can begin learning and working toward an AI data analytics career. The entry point is the same foundation analysts have always needed: spreadsheets, SQL, a dashboard tool and clear explanation. The “AI-powered” part adds assistants that speed up drafting and exploration, but it doesn’t remove the need to understand data. Nobody can promise a job or a timeline, since hiring depends on the employer, the city and the market. What you control is how much visible proof of skill you build.
Why “proof” is the right word
A hiring manager reading a fresher’s application has little to go on. No work history, similar degrees, similar course names. In our opinion, the learners who stand out are those who can show something: a dashboard, a written analysis, a clear explanation of how they checked their numbers. Potential is invisible. Proof is something a person can open and read.
So the useful question isn’t “am I qualified?” but “what can I show?”
The proof ladder
Think of three rungs. Each one makes the next more convincing.
Rung 1: Skills you can demonstrate in minutes. If an interviewer hands you a small table, can you filter it, group it, join it with another and explain the result? That is Excel and SQL at a working level, not an exam level. These are the skills employers commonly list for beginner roles, but check real postings in your target city to confirm.
Rung 2: Projects that answer a question. A project is not “I built a dashboard.” It is “I asked why returns rose in one category, and here is what the data showed.” The question matters more than the chart. Two or three well-explained projects usually say more than ten shallow ones.
Rung 3: Explanation in your own words. For each project, write a short note covering the question, the data you used, what you did, how you checked it and what you would do next. This is the rung most freshers skip, and it is the one that shows how you think.
Where AI tools fit in ?
AI assistants can help a beginner in real ways: explaining an error message, drafting a first version of a query or formula, suggesting ways to clean a messy column, or turning results into a rough summary. For a learner, that can shorten the time between being stuck and moving on. (Check the current abilities of any tool you name against its official documentation.)
But there is a catch that matters for freshers in particular. AI output can look confident and still be wrong, for example a query that silently double-counts rows. If you haven’t learned the basics, you can’t tell. So the order we recommend is simple: learn the fundamentals first, then use AI as a helper, and always verify. Employers can reasonably expect that a person using AI tools understands the work well enough to catch its mistakes.
A strong move for a fresher’s portfolio is to include a short “AI check” section in each project: what you asked an assistant to do, what it got wrong or missed, and how you caught it. That is a rare and convincing piece of evidence.
A realistic scenario
Picture a B.Sc. graduate from a town near Kurnool who wants to move into analytics. This is an illustrative scenario, not a real case.
She doesn’t have an IT degree and no internship. She spends her first weeks on Excel and SQL using a free public dataset of retail sales. She then builds a dashboard, but more importantly she writes a one-page explanation: which product category fell, which months drove the fall, and how she confirmed that her totals matched the source file. For a second project, she uses an AI assistant to draft a few SQL queries, then documents two places where its output needed fixing.
When she applies, her CV links to both write-ups. In the interview she can explain a query line by line. She isn’t claiming experience she doesn’t have. She is showing how she works.
Do you need an IT degree?
Many analyst postings emphasise skills over a specific degree, but this varies, and some employers do ask for particular qualifications. Read the requirements in the posts you want. If a degree is listed as mandatory, you will know early. If it says “or equivalent skills”, your portfolio carries more weight. (Verify against current postings before publishing.)
Mistakes freshers often make
- Collecting certificates instead of building proof. A certificate shows attendance. A project shows ability.
- Jumping to AI tools before the basics. You can’t check what you can’t read.
- Copying a tutorial project exactly. Change the question or the data so the work is yours.
- Skipping the write-up. An unexplained dashboard tells an employer little.
- Waiting to feel “ready”. Start a small project now. Readiness comes from doing.
- Believing a guarantee. No course or article can promise a job. Be cautious with anyone who does.
FLM Expert Perspective: The “Show, Explain, Verify” Habit
We use three words with beginners:
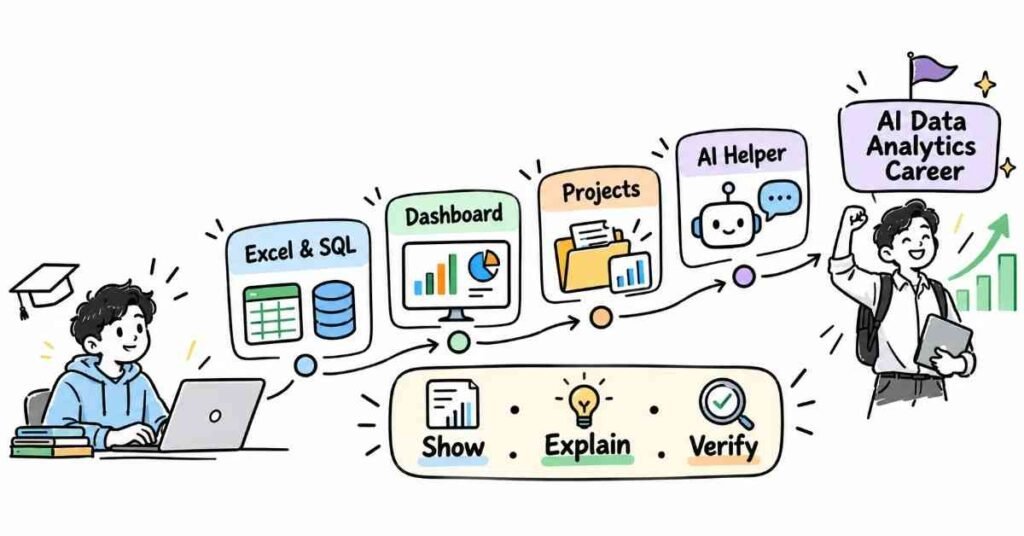
- Show: produce something an employer can open.
- Explain: write in plain language what you did and why.
- Verify: prove that your numbers are right, and say how.
If every project ends with those three, you are building the kind of evidence that a CV alone cannot give you.
A four-stage plan
- Foundations. Excel basics, then SQL: filtering, joining and grouping.
- A visual tool. Learn one dashboard tool, such as Power BI, well enough to build a clear one-page report.
- Two or three questions. Pick public datasets and answer a real question with each. Write the Show, Explain, Verify note.
- AI as a helper. Add an assistant to your workflow, keep notes on where you corrected it and include them in your portfolio.
If you want a guided path with feedback along these stages, an AI Data Analytics course in Telugu can provide structure.
FAQs
- Can a fresher really get into data analytics without experience?
Many people begin without experience. What helps is visible proof of skill, such as projects with clear write-ups. Outcomes depend on the market and the employer, and no one can guarantee a result. - What should I learn first?
Excel and SQL, then one dashboard tool. Add AI assistants after you understand the basics well enough to check them. - I’m from a non-IT background. Is that a problem?
It can be a hurdle with some employers and not with others. Read the requirements in postings you want, and let a strong portfolio carry weight. - How many projects do I need?
There is no fixed number. Two or three well-explained projects usually beat a long list of shallow ones. - Do I need to know Python?
Not always for entry-level analyst roles. Check the postings you are targeting. It can be a useful addition later. - Will AI take entry-level analyst jobs?
AI is changing how some tasks are done, and the effect on hiring is hard to predict. Skills like checking data, understanding the business question and explaining results remain valuable to build. - How do I show skills if I have no work experience?
Share projects with written explanations, a short note on how you verified your numbers, and, if you used AI tools, what you corrected. - What entry-level roles should I search for?
Titles vary by employer. Read the responsibilities, not just the title, and look for roles that use SQL, spreadsheets and dashboards.