
Data Preparation Skills for AI Analytics : Complete Guide
Table of Contents
Recommended Learning Path
What Is a Data Analytics?
Understanding Data Analytics for Beginners
Introduction
Most AI analytics work does not begin with a perfect dataset. A learner may receive an Excel file with blank cells, inconsistent spellings, repeated transactions, text stored inside numeric columns, or dates written in several formats. If those problems are ignored, AI may analyse the wrong records or produce an answer based on inconsistent information.
That is why data preparation skills are important, especially for learners undergoing AI Powered Data Analytics training.
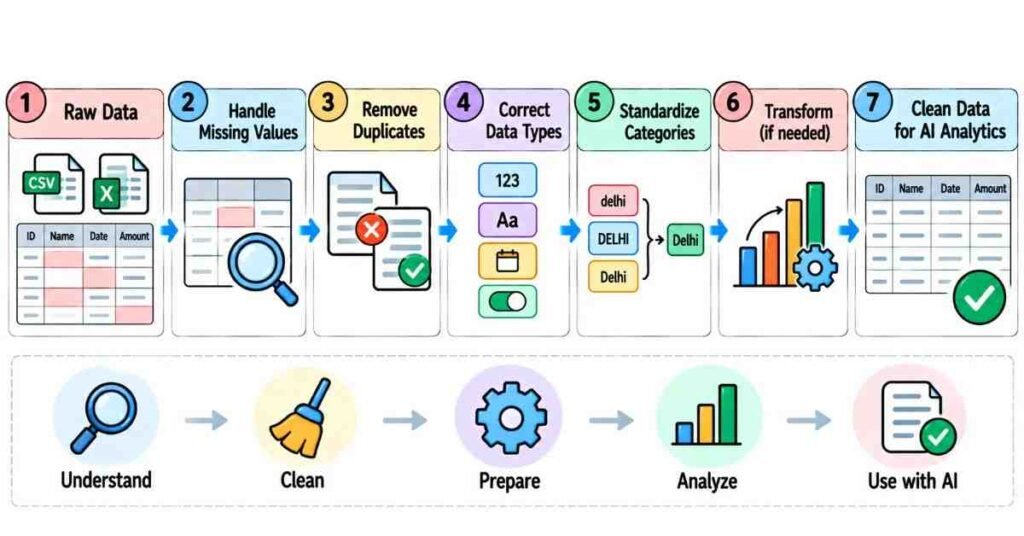
Data preparation is the process of turning raw information into a form that is easier to analyse, compare, transform, and validate. The work may include checking missing values, correcting data types, reviewing duplicates, standardizing labels, restructuring columns, and confirming whether the final dataset still represents the original information correctly.
Quick Answer
The most useful data preparation skills for AI analytics are:
- Understanding the structure of a dataset
- Finding missing or incomplete records
- Identifying genuine duplicates
- Correcting data types
- Making categories and formats consistent
- Applying suitable transformations
- Checking business rules
- Reviewing unusual values
- Comparing the prepared data with the source
- Documenting important changes
A beginner can remember the process as:
Understand → Repair → Reshape → Review → Analyze
Data preparation should solve a specific data problem rather than change information simply because a tool recommends it.
Start by Understanding What Each Column Represents
Before cleaning a file, understand what you are looking at.
Imagine a dataset with these columns:
Invoice No | Customer | Location | Purchase Date | Amount | Order Status
Do not immediately remove blanks or change formats.
First ask:
- What does one row represent?
- Which field identifies a transaction?
- Which columns are measurements?
- Which columns contain categories?
- What period does the dataset cover?
- Are there columns that should never be empty?
- Are all values using the same unit?
This step sounds basic, but it prevents unnecessary corrections.
For example, a repeated customer name is not automatically an error. The same person may have purchased several times.
Practice Goal
Choose a small spreadsheet and describe every column in one sentence.
For example:
Amount = value of one completed order in rupees
This exercise makes later cleaning decisions easier to explain.
New to Analytics? Follow Our Step-by-Step Data Analytics Roadmap →
Learn to Investigate Missing Values
A blank cell does not always mean the same thing.
Consider a customer table with an empty Phone Number field.
The value may be missing because:
- the customer did not provide it;
- the field was optional;
- the data was not imported correctly;
- the value was removed;
- the source system failed to capture it.
Those situations should not automatically receive the same treatment.
Pandas, for example, provides separate operations for detecting, dropping, and filling missing values, which shows why missing-data handling is a decision rather than a single fixed action.
Before changing a blank value, ask:
Does this field need a replacement, or should the missing status remain visible?
For instance, replacing a missing age with 0 changes the meaning of the data. Zero is a real number; unknown age is a different condition.
Practice Goal
Create a small table with three columns containing blanks. For each blank, write:
Why might this be missing?
Then decide whether to keep, replace, investigate, or remove it.
Know the Difference Between Repetition and Duplication
Duplicate handling requires context.
Suppose your dataset contains:
Invoice No | Customer | Amount |
7801 | Anil | 900 |
7802 | Anil | 900 |
These may be two valid purchases.
But if the same invoice number appears twice:
Invoice No | Customer | Amount |
7801 | Anil | 900 |
7801 | Anil | 900 |
then the second row may require investigation.
Tools such as pandas can detect duplicates using selected columns, which is useful because analysts may define duplication based on specific fields rather than every column in the table.
The important skill is deciding:
What makes one record unique?
Depending on the dataset, that could be:
- Invoice Number
- Transaction ID
- Employee ID
- Ticket Number
- Customer ID + Date
- Order ID + Product ID
Practice Goal
Before using a “Remove Duplicates” option, identify the field that should uniquely represent one record.
Make Data Types Match the Meaning of the Data
A column may look correct visually but still be stored in the wrong form.
For example:
12500
could be stored as text instead of a number.
Similarly:
07-10-2026
may appear like a date but remain a text value.
Incorrect data types can interfere with:
- sorting;
- calculations;
- comparisons;
- filtering;
- date grouping;
- averages;
- dashboard measures.
Useful data preprocessing skills therefore include recognizing whether a column should be:
- text;
- integer;
- decimal;
- date;
- date-time;
- Boolean;
- category.
A useful question is:
“What kind of operation should I be able to perform on this column?”
If you need to sum it, it probably should not remain as text.
New to Analytics? Follow Our Step-by-Step Data Analytics How to become Guide →
Standardize Values Without Losing Meaning
Category inconsistencies are common in business data.
A location field might contain:
Hyderabad
HYD
hyd
Hyderabad
If all four represent the same location, standardizing them can improve grouping and comparison.
But this step requires judgement.
Consider:
Hyderabad
and
Hyderabad Rural
Those values may look related but could represent different reporting areas.
The goal of analytics data preparation is not to make all values look similar. It is to make values consistent when they represent the same thing.
Other common standardization tasks include:
- removing unwanted spaces;
- correcting capitalization;
- standardizing date formats;
- using one unit of measurement;
- making category labels consistent;
- converting percentages into one representation.
Learn the Transformations That Make Data Easier to Analyze
Sometimes the information is correct, but the structure is inconvenient.
For example, a dataset might contain:
Full Location: Vijayawada – Andhra Pradesh
For analysis, you may need:
City: Vijayawada
State: Andhra Pradesh
Another file might store monthly sales as:
Jan | Feb | Mar | Apr
For certain analyses, a better structure may be:
Month | Sales |
Jan | 42000 |
Feb | 51000 |
Mar | 47000 |
Common preparation tasks include:
- splitting columns;
- combining fields;
- filtering records;
- grouping rows;
- merging tables;
- appending files;
- creating calculated fields;
- pivoting;
- unpivoting.
Power Query supports data-profiling and transformation workflows, and Microsoft recommends examining data before adding transformation steps. Its profiling tools can show valid, error, empty, and distributed values within columns.
Practice Goal
Take one badly structured dataset and ask:
“What structure would make answering my business question easier?”
Then transform only what is necessary.
Check Business Meaning, Not Just Technical Cleanliness
A technically clean dataset can still produce the wrong answer.
Suppose your task is:
Calculate monthly revenue.
Before calculating anything, decide:
- Are cancelled orders included?
- Are refunded orders included?
- Does revenue include taxes?
- Are partial payments counted?
- Which date determines the month: order date or payment date?
These are business-rule questions.
AI may help write a formula or query, but it cannot reliably know an organisation’s internal definition unless that definition is provided.
A strong analyst connects:
Business Question → Data Rule → Required Records → Calculation
That connection is one of the most important preparation skills.
Perform a Final Quality Review Before Using AI
After making changes, do not immediately move to analysis.
Review the prepared data.
A useful checklist is:
Check | What to Review |
Missingness | Are required fields still blank? |
Uniqueness | Are unexpected repeated records present? |
Type | Are dates and numbers stored correctly? |
Range | Are values realistic? |
Category | Are labels consistent? |
Logic | Do related values make sense together? |
Reconciliation | Do key totals still match the source? |
For example:
A transaction may contain a valid date and a valid delivery date individually, but the delivery date should not normally appear before the order date.
This is why data quality is not only about formatting.
It also requires logical checking
Practical Example: Preparing Order Data Before AI Analysis
Suppose you want AI to answer:
“Which product category contributed the most revenue this month?”
Your file contains several issues:
- some amounts include currency symbols;
- category names use different spellings;
- returned orders are mixed with completed orders;
- some invoice numbers appear twice;
- a few dates are stored as text.
A sensible preparation process could be:
1. Define the calculation
Clarify what “revenue” means and which order statuses should count.
2. Review the amount field
Convert valid sales values into one numeric format.
3. Examine repeated invoice numbers
Determine whether they are duplicate transactions or valid line items.
4. Standardize category labels
Combine spelling variations only when they represent the same category.
5. Fix the date field
Convert valid dates into a consistent date type.
6. Filter according to the business rule
Include only the records relevant to the requested period and revenue definition.
7. Compare totals
Check whether the prepared data still reconciles with the original records.
Only after these steps should the dataset be used for AI-assisted analysis.
The FLM “Meaning → Issue → Action → Check” Method
A simple way for beginners to approach preparation is:
Meaning → Issue → Action → Check
Meaning: What does this field or row represent?
Issue: What is preventing reliable analysis?
Action: What change is required?
Check: Did that change preserve the intended information?
For example:
Meaning: Order Status describes the transaction state.
Issue: Complete, Completed, and DONE represent the same approved status.
Action: Map them to one agreed category.
Check: Confirm that no unrelated status was changed.
This method keeps data preparation connected to reasoning rather than mechanical cleaning.
Common Mistakes in Data Preparation
- Cleaning Before Understanding the Dataset
Removing records too early can destroy useful information. - Treating Blank as Zero
Unknown information and numerical zero are not the same thing. - Deleting All Repeated Rows
Some repeated values represent real activity. - Standardizing Categories Too Aggressively
Similar wording does not always mean the same business category. - Depending Completely on Automated Cleaning
AI and software can suggest corrections, but an analyst should review why those changes are appropriate. - Skipping the Final Comparison
After cleaning or transforming data, compare row counts, totals, and important categories with the original source.
Do AI Projects Need Extra Preprocessing?
Sometimes.
For ordinary reporting and exploratory analysis, preparation may mainly involve cleaning, types, categories, filters, and structure.
Machine-learning tasks can require additional preprocessing depending on the algorithm. Scikit-learn, for example, provides preprocessing methods for feature scaling, normalization, categorical encoding, and related transformations.
This does not mean every dataset should automatically be scaled or encoded.
The correct preprocessing depends on the analytical task and the model being used.
A Beginner Practice Routine
Use this sequence when working with a new dataset:
- Read the business question.
- Understand what each row represents.
- Review column types.
- Investigate missing values.
- Check repeated records.
- Standardize genuine variations.
- Apply only necessary transformations.
- confirm business rules.
- Recheck totals and logic.
- Begin analysis.
A useful habit is:
Never make a data change that you cannot explain.
FAQs
- What data preparation skills are important for AI analytics?
Important skills include inspecting data, handling missing values, reviewing duplicates, correcting data types, standardizing categories, restructuring data, applying business rules, and validating the final dataset. - Why does data preprocessing matter?
Preprocessing helps convert raw information into a form that can be analysed more consistently. It also helps identify issues before they influence calculations or AI-generated insights. - Which data issues should analysts check first?
Start with missing values, unexpected duplicates, incorrect data types, inconsistent categories, invalid values, incomplete dates, and unclear business definitions. - Is a repeated row always a duplicate?
No. Repeated information may represent legitimate activity. Analysts should identify what makes a record unique before removing anything. - Should missing values always be replaced?
No. The treatment depends on what the missing value represents and whether replacing it would change the meaning of the data. - What is the difference between data cleaning and data preparation?
Cleaning focuses mainly on correcting or removing problematic data. Preparation is broader and can also include restructuring, standardization, business-rule checks, transformation, and validation. - Can AI automatically prepare a dataset?
AI can suggest transformations, formulas, SQL, or Python code, but those changes should still be reviewed against the source data and the business requirement. - Do beginners need machine-learning preprocessing immediately?
No. Beginners can first become comfortable with missing values, duplicates, formats, data types, transformations, and quality checks before moving to model-specific preprocessing

Python vs SQL for Data Analytics Key Differences
Python vs SQL for Data Analytics Key Differences Table of Contents Recommended Learning Path What Is Python vs SQL for Data Analytics? Understanding Python vs

Can AI Analyze Data Without a Data Analyst
Can AI Analyze Data Without a Data Analyst? AI vs. Human Role Recommended Learning Path Can AI Analyze Data Without a Data Analyst? AI vs.
Predictive vs Prescriptive Analytics
Predictive vs Prescriptive Analytics: Differences and Examples Table of Contents Recommended Learning Path What Is Predictive & Prescriptive Analytics? Understanding Predictive vs Prescriptive

What Is Data Visualization
What Is Data Visualization? Basics, Charts, Dashboards & Importance Recommended Learning Path What Is Data Visualization? Basics, Charts, Dashboards & Importance Live Classes Real Projects

What Is Exploratory Data Analysis (EDA)
What Is Exploratory Data Analysis (EDA)? Table of Contents Recommended Learning Path What Is Exploratory Data Analysis (EDA)? To understand the Exploratory Data

Descriptive vs Predictive Analytics Key Differences
Descriptive vs Predictive Analytics Key Differences Table of Contents Recommended Learning Path What Is Descriptive & Predictive Analytics ? Understanding Descriptive vs Predictive Analytics Explore