
Power BI Developer Interview Preparation Guide 2026
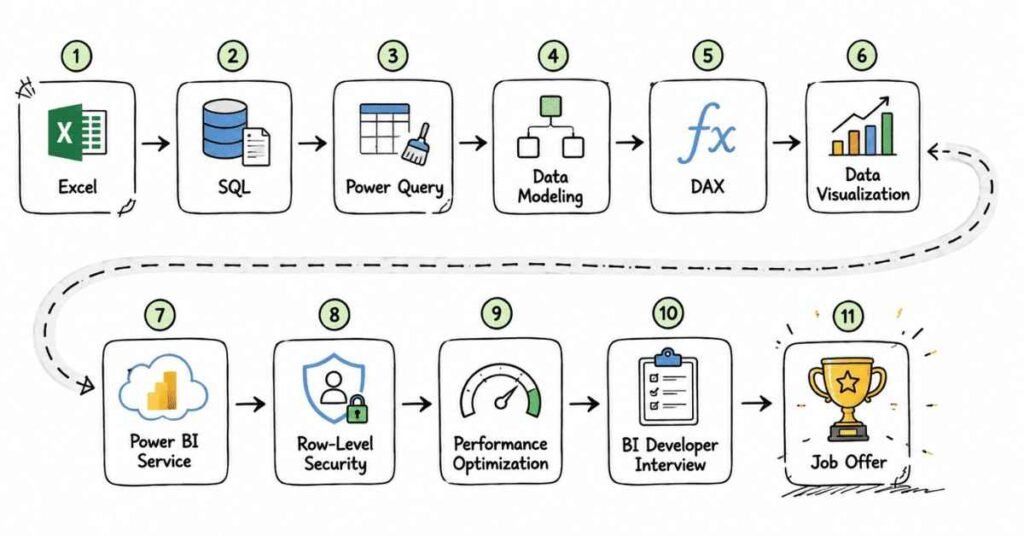
Table of Contents
Part 1: Introduction & 30-Day Study Plan
This first part sets the direction for Power BI interview preparation. It explains what Power BI interviews test, where Power BI fits in real work, and how to build a practical 30-day plan that makes you interview-ready.
What this guide covers
This guide is designed to prepare you for Power BI interviews in a structured, layered way. It starts with platform basics and moves into data loading, modeling, DAX, visual design, service features, SQL, performance, and career strategy.
The goal is not just to help you memorize terms, but to help you explain how and why you make reporting decisions. Interviewers usually care as much about your reasoning and business understanding as they do about the dashboard itself.
Who this guide is for
This guide is useful if you are:
- A fresher preparing for your first Power BI interview.
- A student targeting BI, dashboard, or reporting roles.
- A data analyst moving from Excel to Power BI.
- A developer or MIS professional moving into reporting or analytics.
- A candidate who knows Power BI basics but is not yet confident discussing DAX, modeling, or service deployment.
The structure is meant to help both beginners and experienced candidates build confidence step by step. It gives you a clear path from fundamentals to interview execution.
What Power BI is and why it matters
Power BI is Microsoft’s business intelligence and data visualization platform used to connect, transform, model, and visualize data. It helps teams build interactive dashboards and reports for decision-making.
Power BI matters because businesses need fast, repeatable, and visual reporting. It reduces manual reporting effort and makes insights easier to share across teams.
A simple way to think about Power BI is this: it turns raw data into interactive business insights. If you can use Power BI well, you can help people understand performance quickly.
Where Power BI fits in real work
In real companies, Power BI is used for sales dashboards, finance reporting, operations tracking, HR metrics, customer analytics, and executive scorecards. Common tasks include:
- Connecting to Excel, SQL, cloud, and other data sources.
- Cleaning and transforming data with Power Query.
- Building star-schema data models.
- Writing DAX measures for KPIs and time intelligence.
- Designing dashboards and reports.
- Publishing and managing reports in Power BI Service.
This is why Power BI interviews test more than chart creation. Interviewers often want to see whether you can prepare, model, secure, refresh, and present data in a real business environment.
Common Power BI-related roles
Power BI interviews vary depending on the role. Common role types include:
- Power BI Developer: dashboards, DAX, modeling, service.
- BI Analyst: reporting, business metrics, insights.
- Data Analyst: analysis, dashboards, visualization, data prep.
- MIS / Reporting Analyst: recurring reports and operational dashboards.
- BI Engineer: modeling, SQL, pipelines, service-level reporting.
- Power BI Consultant: client-facing reporting and solution design.
Understanding the role early helps you focus your preparation. A developer role may focus more on modeling and DAX, while an analyst role may focus more on dashboard clarity and business interpretation.
Common interview process
A typical Power BI interview process often includes:
- HR or recruiter screening.
- Power BI basics round.
- Power Query and transformation round.
- Data modeling and relationships round.
- DAX round.
- Visualization and dashboard design round.
- Power BI Service, RLS, and refresh round.
- SQL and scenario-based round.
- Behavioral or hiring manager round.
In many interviews, Power BI questions are mixed with practical reasoning. You may be asked to explain a dashboard project, a DAX measure, a refresh problem, or a data model decision.
Core skill areas interviewers usually check
Most Power BI interviews evaluate some combination of:
- Power BI Desktop and Service.
- Data loading and transformation.
- Data modeling and relationships.
- DAX formulas and context.
- Visual design and interactivity.
- Refresh, gateway, and deployment.
- SQL and data source understanding.
- Performance optimization.
- Row-Level Security.
- Business storytelling and communication.
These areas appear repeatedly because they reflect real BI work. If you are comfortable with these topics, you can handle most interview rounds with confidence.
Why SQL and data modeling matter
Power BI does not work in isolation. Good dashboards depend on clean source data, correct relationships, and reliable SQL knowledge.
A strong candidate understands how data is shaped before it reaches the report. That perspective makes the difference between someone who only builds charts and someone who builds dependable BI solutions.
How to think in Power BI interviews
A strong Power BI answer usually follows this structure:
- Define the concept clearly.
- Explain where it is used.
- Mention how it affects reporting or analysis.
- Give a short dashboard or project example.
- Mention a practical trade-off or best practice.
For example, if asked about star schema, do not only define it. Explain why it improves readability, modeling, and performance in BI reporting.
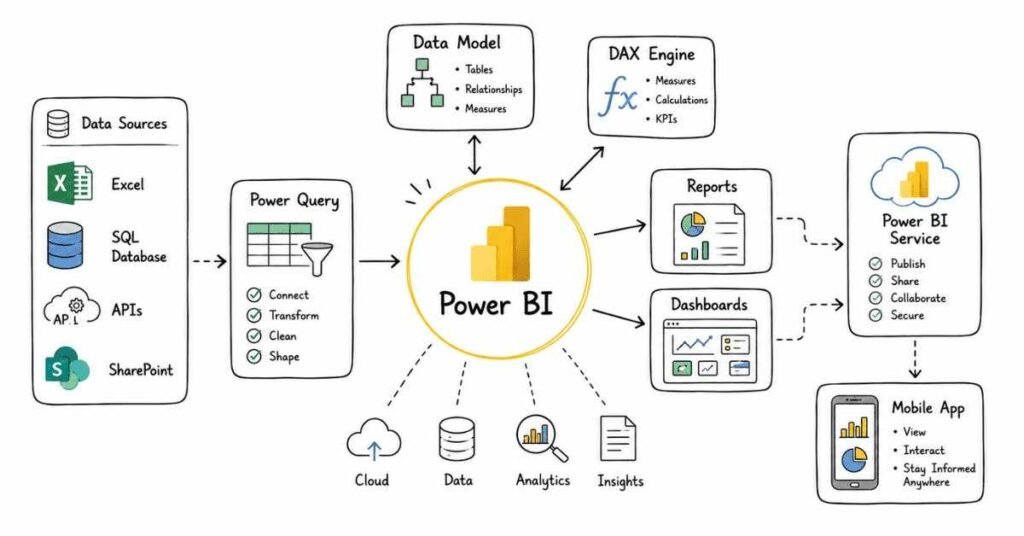
30-day study plan
A practical 30-day Power BI study plan looks like this:
Week 1: Power BI basics and data flow
Focus on Power BI Desktop, Service, report types, data sources, import modes, and the end-to-end BI workflow. Learn how Power BI fits into business reporting.
Week 2: Power Query and data preparation
Study transformations, cleaning, query steps, append versus merge, data types, and shaping data before loading it into the model. Practice with messy datasets.
Week 3: Data modeling and DAX
Move into star schema, relationships, filter direction, measures, calculated columns, and DAX fundamentals. Continue practicing with KPIs and time-based logic.
Week 4: Service, dashboards, SQL, and mock interviews
Focus on Power BI Service, refresh, RLS, dashboards, performance, SQL, and scenario-based practice. Spend the rest of the week on resume, project explanation, and behavioral questions.
Daily study routine
A practical daily routine looks like this:
- 45 minutes of concept revision.
- 60 minutes of report or DAX practice.
- 30 minutes of spoken explanation or mock interview practice.
- 15 minutes of notes, review, or scenario work.
If you are a fresher, do not skip speaking practice. Many candidates understand Power BI privately but freeze when asked to explain a measure or dashboard decision in real time.
Salary expectations in India
Power BI salary expectations vary by role, company type, and whether the work is focused on reporting, analytics, or broader BI engineering. Fresher and early-career roles often start modestly, while stronger SQL, modeling, and service skills can improve compensation over time.
A practical approach is to treat salary numbers as directional context rather than guaranteed outcomes. In interviews, your dashboard quality, business understanding, and technical clarity often matter as much as the title itself.
How to prepare effectively
The best way to prepare for Power BI interviews is to build from basics to Power Query, then move into modeling, DAX, visuals, service, SQL, and performance. Start simple, then layer complexity gradually.
You should also practice explaining your dashboards out loud. In many interviews, the explanation matters almost as much as the report itself.
Revision focus
Revise what Power BI is, where it is used, the common BI role types, the usual interview format, the key skill areas, and the 30-day study plan before moving to Power BI fundamentals and architecture.
Part 2: Power BI Fundamentals & Architecture — Questions 1–40
This part builds the foundation for the rest of the Power BI guide. It covers the basic platform concepts, architecture ideas, and terminology interviewers expect you to understand before moving into Power Query, modeling, DAX, and dashboards.
1) What is Power BI?
Power BI is a business intelligence tool used to connect data, transform it, model it, and visualize it in reports and dashboards. It helps users turn raw data into meaningful insights.
2) Why is Power BI important?
Power BI is important because it makes reporting faster, more interactive, and easier to share. It is widely used in BI, analytics, and reporting roles.
3) What are the main components of Power BI?
The main components are Power BI Desktop, Power BI Service, and Power BI Mobile. Together they support report creation, sharing, and viewing.
4) What is Power BI Desktop?
Power BI Desktop is the authoring tool used to build data models, DAX measures, and reports. It is where most report development happens.
5) What is Power BI Service?
Power BI Service is the cloud platform used to publish, share, and manage reports and dashboards. It supports collaboration and deployment.
6) What is Power BI Mobile?
Power BI Mobile is the app used to view dashboards and reports on mobile devices. It helps users access insights on the go.
7) What is the difference between Power BI Desktop and Power BI Service?
Desktop is used for building reports locally, while Service is used for publishing, sharing, and managing reports online. They serve different parts of the BI workflow.
8) What is a report in Power BI?
A report is a collection of visuals built from one or more datasets. It is usually interactive and can contain multiple pages.
9) What is a dashboard in Power BI?
A dashboard is a single-page canvas made of pinned visuals from reports. It gives a high-level view of key metrics.
10) What is a dataset in Power BI?
A dataset is the data model loaded into Power BI for reporting. It contains tables, relationships, and measures.
11) What is a workspace?
A workspace is a container in Power BI Service used to organize and manage reports, dashboards, datasets, and apps. It supports team collaboration.
12) What is a tile in Power BI?
A tile is a pinned visual on a dashboard. It represents a snapshot of a chart, card, or other report element.
13) What is a semantic model?
A semantic model is the structured dataset used for analysis and reporting. It defines how tables, relationships, and measures work together.
14) What is a data source?
A data source is the system or file from which Power BI reads data. Examples include Excel, SQL Server, SharePoint, APIs, and cloud platforms.
15) Why is data source understanding important?
Because the quality and structure of the source data affect the report. Good Power BI work starts with understanding the source.
16) What is import mode?
Import mode loads data into Power BI memory. It is fast for querying and is commonly used for many reports.
17) What is DirectQuery mode?
DirectQuery keeps data in the source system and queries it when needed. It is useful for near-real-time reporting or very large datasets.
18) What is Live Connection?
Live Connection connects Power BI directly to an existing semantic model or analysis source. It is often used when the model is managed elsewhere.
19) What is the difference between Import and DirectQuery?
Import stores data inside Power BI, while DirectQuery queries the source each time. Import is usually faster, but DirectQuery can be better for large or frequently changing data.
20) What is a connection mode choice based on?
It depends on data size, freshness needs, performance, and source system limitations. There is no one-size-fits-all answer.
21) What is a visual?
A visual is any chart, graph, card, table, or graphic used to show data in Power BI. It is the main way Power BI communicates insights.
22) Why are visuals important?
Because they make data easier to understand at a glance. Good visuals help users make faster decisions.
23) What is interactivity in Power BI?
Interactivity means users can click, filter, drill, or explore the report dynamically. It is one of Power BI’s biggest strengths.
24) What is a slicer?
A slicer is a visual filter used to filter the report by a field such as date, region, or category. It improves user control.
25) What is drill-down?
Drill-down lets users move from summary data to more detailed data. It helps explore information in layers.
26) What is drill-through?
Drill-through sends the user from one page to another with filtered context. It is useful for detail pages.
27) What is cross-filtering?
Cross-filtering means one visual affects another visual based on selected data. It helps create interactive report behavior.
28) What is a bookmark?
A bookmark saves a specific report view or state. It is often used for navigation and storytelling.
29) What is a tooltip?
A tooltip is the extra information shown when a user hovers over a visual. It helps provide detail without cluttering the page.
30) What is a theme in Power BI?
A theme is a collection of colors, fonts, and formatting rules applied to the report. It helps keep the design consistent.
31) Why are themes useful?
They improve visual consistency and reduce manual formatting effort. They also help report branding.
32) What is a page in Power BI report?
A page is a canvas inside a report where visuals are placed. A report can have multiple pages.
33) What is the canvas?
The canvas is the report page area where visuals are arranged. It is the working space for report design.
34) What is a card visual?
A card visual displays a single number or KPI. It is often used to highlight important metrics.
35) What is a table visual?
A table visual shows data in rows and columns. It is useful for detailed records and summaries.
36) What is a matrix visual?
A matrix visual is similar to a pivot table. It supports row and column grouping with drill options.
37) What is a KPI visual?
A KPI visual shows a key metric and its trend or target status. It is used in performance tracking.
38) What is a strong answer for Power BI basics questions?
A strong answer explains the concept clearly and connects it to reporting or business use. Interviewers like answers that show practical understanding, not just definitions.
39) What is a common beginner mistake in Power BI?
A common mistake is confusing Desktop, Service, dataset, report, and dashboard. Another is building visuals without understanding the data model.
40) What is the best way to practice Power BI fundamentals?
The best way is to create a simple report end to end, from data source to published dashboard. Repetition helps these concepts feel natural.
Revision focus
Revise Power BI Desktop versus Service, reports versus dashboards, datasets, workspaces, tiles, import versus DirectQuery versus Live Connection, slicers, drill-down, drill-through, bookmarks, tooltips, themes, and common visuals before moving to Power Query and data transformation.
Part 3: Power Query, Data Loading & Transformation — Questions 41–80
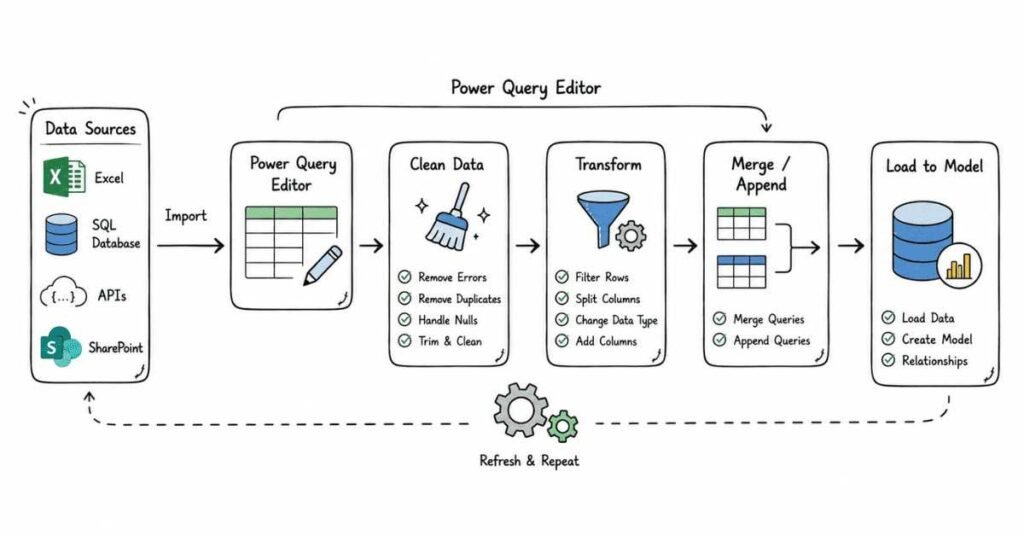
This part covers the data preparation layer that makes Power BI reports reliable. It focuses on how data is loaded, cleaned, shaped, and combined before modeling and visualization.
41) What is Power Query?
Power Query is the data transformation tool in Power BI used to clean, shape, and prepare data before loading it into the model. It helps automate repeatable data prep steps.
42) Why is Power Query important?
Because most real-world data is messy, inconsistent, or incomplete. Power Query helps make that data ready for analysis.
43) What is the Power Query Editor?
The Power Query Editor is the interface where transformations are applied. It lets you preview, clean, and reshape data before loading it.
44) What is data transformation?
Data transformation means changing raw data into a more usable form. This can include cleaning, splitting, merging, filtering, and changing data types.
45) What is data loading?
Data loading is the process of bringing source data into Power BI. It may happen after transformation or as part of the import process.
46) What is a query in Power Query?
A query is a set of steps applied to a data source. It defines how raw data is transformed into final output.
47) What is the Applied Steps pane?
The Applied Steps pane shows the transformation steps you have performed. It helps track and edit the data prep process.
48) What is the difference between Append and Merge?
Append combines tables by stacking rows, while Merge combines tables by matching columns based on a key. They solve different data-shaping problems.
49) When should Append be used?
Use Append when you want to combine similar tables with the same structure, such as monthly files or regional datasets.
50) When should Merge be used?
Use Merge when you want to bring related data from another table into the current table based on a matching field.
51) What is a data type in Power Query?
A data type tells Power BI how a column should be interpreted, such as text, number, date, or boolean. Correct data types are essential for accurate analysis.
52) Why are data types important?
Because wrong data types can break calculations, filtering, and relationships. They are one of the first things to check in Power Query.
53) What is trimming in Power Query?
Trimming removes extra spaces from text values. It helps standardize data.
54) What is cleaning in Power Query?
Cleaning removes unwanted characters or formatting issues from text. It improves consistency.
55) What is replacing values?
Replacing values means changing one value to another across a column. It is useful for standardizing labels or fixing data issues.
56) What is splitting a column?
Splitting a column divides one field into multiple fields based on a delimiter or character position. It is useful for names, codes, or combined text.
57) What is unpivoting?
Unpivoting converts columns into rows. It is useful when data is stored in a wide format that needs to become more analytical.
58) Why is unpivoting important?
Because BI models often work better in row-based, normalized formats. Unpivoting helps reshape messy tables into usable structure.
59) What is pivoting?
Pivoting turns row values into columns. It is the opposite of unpivoting.
60) What is filtering in Power Query?
Filtering removes rows that do not meet certain conditions. It helps reduce unnecessary data before loading.
61) What is sorting in Power Query?
Sorting arranges data in a chosen order. It helps review and organize transformed data.
62) What is grouping in Power Query?
Grouping combines rows by a key and performs an aggregation like sum or count. It is useful for summarized outputs.
63) What is removing duplicates?
Removing duplicates deletes repeated records based on selected columns. It is useful for data quality and deduplication.
64) Why is duplicate removal important?
Because duplicates can inflate totals and distort analysis. Clean data is critical for reliable reports.
65) What is query folding?
Query folding is when Power Query pushes transformation steps back to the data source for better performance. It improves efficiency in many scenarios.
66) Why is query folding important?
Because it can significantly improve refresh and query performance. It is a key optimization concept in Power BI.
67) What can break query folding?
Some transformations, custom steps, or unsupported operations can prevent folding. Once broken, Power Query may need to process more data locally.
68) What is a parameter in Power Query?
A parameter is a reusable value that can control queries dynamically. It is often used for file paths, date filters, or source settings.
69) Why are parameters useful?
They make queries more flexible and easier to maintain. They are especially helpful in reusable BI solutions.
70) What is a custom column?
A custom column is a new column created using a formula or logic in Power Query. It is used for derived values or transformations.
71) What is a conditional column?
A conditional column is created using if-then logic in Power Query. It helps classify data based on rules.
72) What is a data source in Power Query?
A data source is the original place from which data is read, such as Excel, SQL Server, CSV, SharePoint, or web data. Power Query connects to these sources.
73) What is refresh in Power BI?
Refresh updates the dataset with the latest source data. It ensures the report reflects current information.
74) Why is refresh important?
Because reports are only useful if the data is current. Refresh keeps dashboards relevant.
75) What is incremental refresh?
Incremental refresh updates only new or changed data instead of reloading everything. It improves performance for large datasets.
76) Why is incremental refresh useful?
Because it reduces refresh time and resource usage. It is commonly discussed in performance and service interviews.
77) What is a common Power Query mistake?
A common mistake is not checking data types or loading too much unnecessary data. Another is creating too many inefficient transformation steps.
78) What is a strong answer for Power Query questions?
A strong answer explains the transformation step, why it was needed, and how it improves the final model. Interviewers want practical cleaning and shaping knowledge.
79) Why is Power Query important in Power BI interviews?
Because nearly every real project requires cleaning and shaping data before modeling. Strong Power Query skills show real BI readiness.
80) How should you practice Power Query?
Practice with messy files, multiple tables, date issues, duplicates, and combined datasets. Repeating transformations helps you learn how to prepare real-world data.
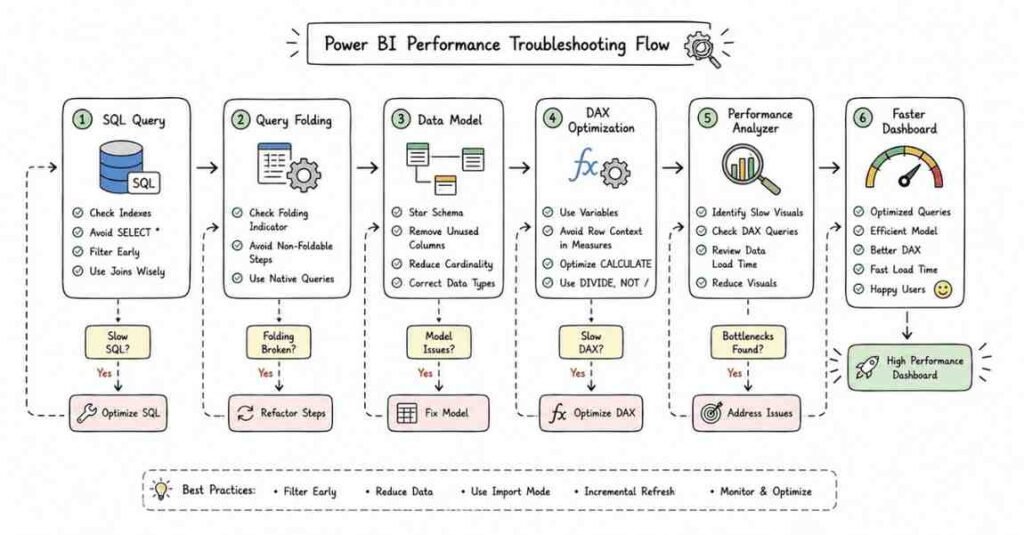
Revision focus
Revise Power Query Editor, transformation steps, append versus merge, data types, trimming, cleaning, replacing, splitting, unpivoting, pivoting, filtering, grouping, duplicate removal, query folding, parameters, custom columns, refresh, and incremental refresh before moving to data modeling, relationships, and schema design.
Part 4: Data Modeling, Relationships & Schema Design — Questions 81–120
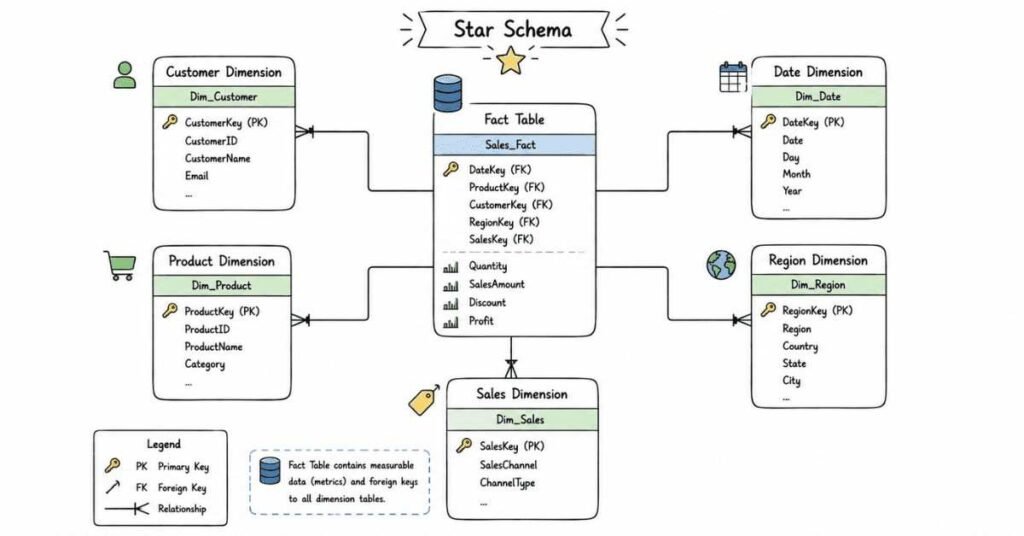
This part covers the structure behind every good Power BI report. It focuses on tables, relationships, model design, and the schema choices that affect performance, clarity, and DAX behavior.
81) What is data modeling in Power BI?
Data modeling is the process of organizing tables and relationships so Power BI can analyze data efficiently. It defines how different tables work together.
82) Why is data modeling important?
Because a good model makes reporting easier, faster, and more accurate. Poor modeling can cause confusing visuals and incorrect results.
83) What is a fact table?
A fact table contains measurable business events or transactions, such as sales or orders. It usually holds numeric values and foreign keys.
84) What is a dimension table?
A dimension table contains descriptive information such as customer, product, or date details. It provides context to the facts.
85) What is the difference between fact and dimension tables?
Fact tables store metrics and transactions, while dimension tables store labels and attributes. Together they support analysis.
86) What is a star schema?
A star schema is a model where one central fact table is connected to multiple dimension tables. It is one of the most common Power BI modeling patterns.
87) Why is star schema preferred?
Because it is simple, efficient, and works well with DAX and reporting. It is often the best default choice for BI models.
88) What is a snowflake schema?
A snowflake schema is a more normalized model where dimension tables are split into related sub-tables. It is more complex than a star schema.
89) What is the difference between star and snowflake schema?
Star schema is flatter and simpler, while snowflake schema is more normalized and detailed. Power BI often works better with star schema.
90) What is a relationship in Power BI?
A relationship connects two tables based on a common column. It allows Power BI to combine data across tables.
91) Why are relationships important?
Because they allow filtering and aggregation across tables. Without correct relationships, the model will not behave properly.
92) What is cardinality?
Cardinality describes the type of relationship between tables, such as one-to-one, one-to-many, or many-to-many. It is important for model design.
93) What is one-to-many cardinality?
One-to-many means one record in one table can relate to many records in another table. This is the most common relationship type.
94) What is many-to-many cardinality?
Many-to-many means multiple records in one table can match multiple records in another table. It often needs careful handling.
95) Why can many-to-many be problematic?
Because it can produce ambiguous filters and unexpected results. It should be used carefully.
96) What is cross-filter direction?
Cross-filter direction controls how filters move between related tables. It affects how visuals and DAX respond to selections.
97) What is single-direction filtering?
Single-direction filtering means filters flow in one direction only, usually from dimension to fact. It is the common and safer choice.
98) What is bidirectional filtering?
Bidirectional filtering allows filters to flow in both directions. It can be useful but may create ambiguity if overused.
99) What is a bridge table?
A bridge table is used to connect tables in complex many-to-many relationships. It helps reduce ambiguity in the model.
100) Why is a bridge table useful?
It helps manage relationships that cannot be modeled cleanly with direct links. It is common in advanced BI design.
101) What is normalization?
Normalization organizes data into smaller related tables to reduce duplication. It is a common database design concept.
102) What is denormalization?
Denormalization combines data into broader tables for easier reading and faster reporting. BI models often use some level of denormalization.
103) Why is denormalization sometimes useful in Power BI?
Because simpler reporting models can improve usability and DAX behavior. BI models often balance normalization and practical reporting needs.
104) What is a date table?
A date table is a dedicated table containing dates and related fields like year, month, quarter, and week. It is essential for time intelligence.
105) Why is a date table important?
Because DAX time functions often require a proper date table. It improves date-based reporting and consistency.
106) What is a calculated column?
A calculated column is a column created using a DAX expression and stored in the model. It is computed row by row.
107) What is a measure?
A measure is a DAX calculation evaluated on demand based on filter context. It is usually used for aggregations and KPIs.
108) What is the difference between calculated column and measure?
A calculated column is stored in the model, while a measure is calculated when used in a visual. Measures are usually preferred for reporting calculations.
109) Why are measures important?
Because they make reports dynamic and efficient. Most BI calculations are best written as measures.
110) What is a hierarchy?
A hierarchy is an ordered set of fields, such as Year > Quarter > Month > Date. It helps drill through time or category levels.
111) What is a surrogate key?
A surrogate key is an artificial key used to uniquely identify rows. It is commonly used in dimension tables.
112) What is a natural key?
A natural key is a real-world identifier already present in the data, such as an employee ID or product code. It comes from the source system.
113) What is granularity?
Granularity refers to the detail level of the data. A transaction-level fact table has finer granularity than a monthly summary table.
114) Why is granularity important?
Because measures and relationships depend on the level of detail. A mismatch in granularity can lead to wrong results.
115) What is a common modeling mistake?
A common mistake is mixing transaction and summary data without understanding granularity. Another is using too many direct relationships or bidirectional filters.
116) What is a strong answer for modeling questions?
A strong answer explains the table type, relationship type, and why the design supports the report. Interviewers want to hear modeling logic, not just terms.
117) Why does schema design matter in Power BI?
Because schema design affects report performance, DAX simplicity, and data correctness. A well-designed model makes everything easier.
118) How should you think about schema design?
Start with the business question, identify facts and dimensions, define keys, and then build the simplest model that supports the reporting need.
119) Why are schema questions common in Power BI interviews?
Because a BI developer needs to understand how data structure affects the report. Data modeling is one of the most important interview topics.
120) How should you practice modeling?
Practice turning raw tables into star schemas, building relationships, adding a date table, and testing visuals with real filters. Repetition helps modeling become intuitive.
Revision focus
Revise fact table versus dimension table, star schema versus snowflake schema, relationships, cardinality, cross-filter direction, one-to-many versus many-to-many, bridge tables, normalization versus denormalization, date tables, calculated columns versus measures, hierarchies, keys, and granularity before moving to DAX fundamentals, context, and time intelligence.
Part 5: DAX Fundamentals, Context & Time Intelligence — Questions 121–160
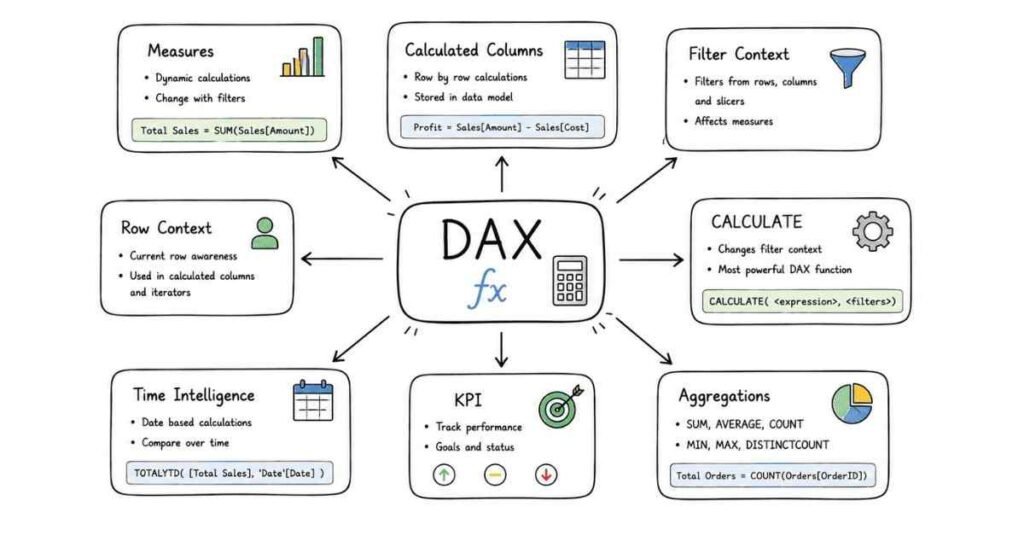
This part covers the calculation language that makes Power BI powerful. It focuses on DAX basics, filters, context behavior, KPI calculations, and time-based analysis.
121) What is DAX?
DAX stands for Data Analysis Expressions. It is the formula language used in Power BI to create measures, calculated columns, and calculated tables.
122) Why is DAX important?
Because it powers most meaningful calculations in Power BI. Without DAX, reports would be limited to simple visuals and imported values.
123) What is the difference between DAX and Excel formulas?
DAX is designed for data models and filter context, while Excel formulas work mainly on cell references. DAX is more powerful for BI calculations.
124) What is a DAX measure?
A DAX measure is a calculation evaluated dynamically based on filter context. It is commonly used for KPIs and aggregations.
125) What is a calculated column in DAX?
A calculated column is a row-by-row expression stored in the model. It is evaluated when the model is refreshed.
126) What is a calculated table?
A calculated table is a table created using a DAX expression. It is stored in the model and refreshed with the data.
127) What is filter context?
Filter context is the set of filters applied to a calculation. It determines which data a measure evaluates.
128) Why is filter context important?
Because most DAX results depend on it. Understanding filter context is essential for correct Power BI calculations.
129) What is row context?
Row context means DAX evaluates the current row one record at a time. It is common in calculated columns and iterators.
130) What is the difference between row context and filter context?
Row context works on individual rows, while filter context works on the filtered dataset. They are different evaluation behaviors in DAX.
131) What is context transition?
Context transition happens when row context is converted into filter context, often through CALCULATE. It is a key advanced DAX concept.
132) What is CALCULATE?
CALCULATE changes the filter context of a calculation. It is one of the most important DAX functions.
133) Why is CALCULATE important?
Because it allows powerful filtering and conditional calculations. Many advanced measures depend on it.
134) What is SUMX?
SUMX is an iterator function that calculates an expression row by row and then sums the result. It is used when simple SUM is not enough.
135) Why are iterator functions useful?
They help perform calculations that depend on each row’s logic. They are common in advanced measures.
136) What is AVERAGEX?
AVERAGEX evaluates an expression row by row and returns the average. It is another iterator function.
137) What is FILTER?
FILTER returns a table containing rows that meet a condition. It is often used inside other DAX formulas.
138) Why is FILTER useful?
Because it allows detailed condition-based logic in measures. It is a building block for many advanced calculations.
139) What is ALL?
ALL removes filters from a table or column. It is often used when calculating totals or percentages.
140) Why is ALL important?
Because it helps compare filtered values to overall totals. It is commonly used in percent-of-total calculations.
141) What is DISTINCT?
DISTINCT returns unique values from a column or table. It is useful for counting or summarizing categories.
142) What is DISTINCTCOUNT?
DISTINCTCOUNT counts unique values in a column. It is often used for customer, product, or user counts.
143) What is RELATED?
RELATED pulls a value from a related table into the current row context. It is useful in calculated columns.
144) What is RELATEDTABLE?
RELATEDTABLE returns rows from a related table. It is commonly used in row context scenarios.
145) What is IF in DAX?
IF checks a condition and returns one result if true and another if false. It is used for logic-based measures.
146) What is SWITCH?
SWITCH returns different results based on matching values or conditions. It is often cleaner than multiple nested IF statements.
147) Why is SWITCH useful?
Because it makes complex logic easier to read and manage. It is commonly used in classification measures.
148) What is time intelligence?
Time intelligence refers to DAX functions used to analyze data over time. It includes month-to-date, year-to-date, and prior period calculations.
149) Why is time intelligence important?
Because most business reporting needs date-based comparisons. It is essential for sales, finance, and KPI analysis.
150) What is TOTALYTD?
TOTALYTD calculates year-to-date totals. It is a very common time intelligence function.
151) What is DATESYTD?
DATESYTD returns the dates from the start of the year to the current context date. It is often used in custom YTD logic.
152) What is SAMEPERIODLASTYEAR?
SAMEPERIODLASTYEAR returns the same date period from the previous year. It is used for year-over-year comparison.
153) What is DATEADD?
DATEADD shifts dates forward or backward by a specified interval. It is useful in period comparison calculations.
154) What is moving average?
A moving average smooths values over a rolling time window. It helps identify trends more clearly.
155) What is running total?
A running total accumulates values over time from the start period to the current period. It is often used in trend analysis.
156) What is a KPI measure?
A KPI measure is a calculation used to track performance against a target or goal. It helps show whether a metric is improving or falling behind.
157) What is % of total?
% of total is a calculation that shows a value as a share of the overall total. It is often built using CALCULATE and ALL.
158) What is a common DAX mistake?
A common mistake is confusing row context and filter context. Another is writing measures that are correct in one visual but fail in another.
159) What is a strong answer for DAX questions?
A strong answer explains the calculation goal, the context involved, and why the chosen function fits. Interviewers want clear thinking, not just function names.
160) How should you practice DAX?
Practice with KPI measures, YTD, prior year comparisons, running totals, % of total, and row-based calculations. Use a proper date table and test your measures in multiple visuals.
Revision focus
Revise DAX, measures versus calculated columns, calculated tables, row context versus filter context, context transition, CALCULATE, SUMX, FILTER, ALL, DISTINCTCOUNT, RELATED, SWITCH, time intelligence, TOTALYTD, SAMEPERIODLASTYEAR, DATEADD, running totals, moving averages, and % of total before moving to visualizations, dashboards, and report design.
Part 6: Visualizations, Dashboards & Report Design — Questions 161–200
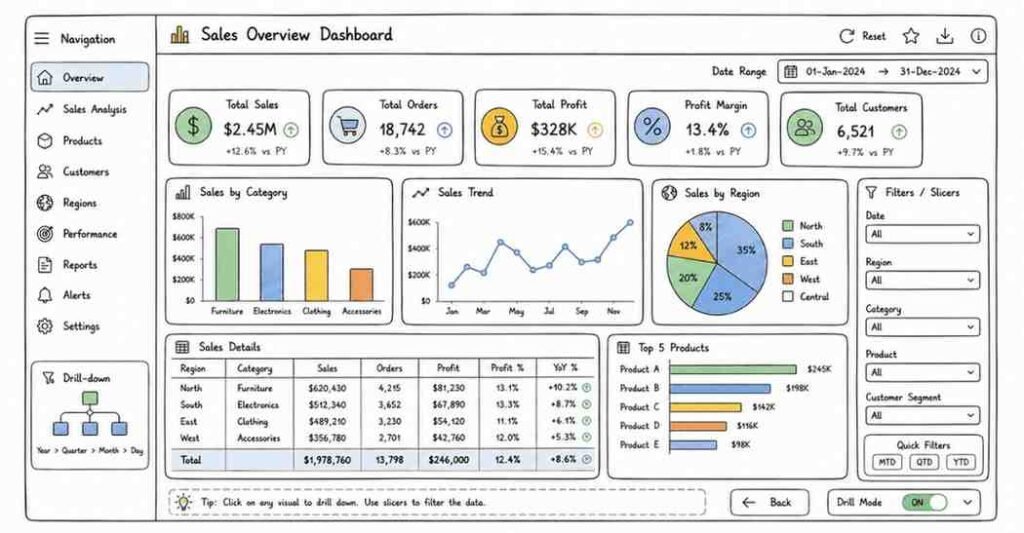
This part covers how to present data in a way that is clear, interactive, and useful. It focuses on visual choices, dashboard layout, report usability, and common design practices in Power BI.
161) What is a visual in Power BI?
A visual is a chart, graph, card, table, or graphic used to represent data. It is the primary way Power BI displays insights.
162) Why are visuals important?
Because they make data easier to interpret quickly. Good visuals help people understand trends and performance at a glance.
163) What is a bar chart used for?
A bar chart is used to compare values across categories. It is useful when labels are long or when horizontal comparison works better.
164) What is a column chart used for?
A column chart is used to compare categories vertically. It is useful for side-by-side category comparisons.
165) What is a line chart used for?
A line chart is used to show trends over time or ordered data. It is ideal for performance tracking.
166) What is a pie chart used for?
A pie chart shows parts of a whole. It works best when there are only a few categories.
167) What is a scatter chart used for?
A scatter chart shows the relationship between two numeric variables. It is useful for correlation and pattern analysis.
168) What is a waterfall chart used for?
A waterfall chart shows how values increase or decrease step by step. It is common in financial analysis.
169) What is a funnel chart used for?
A funnel chart shows progress through stages, such as sales or conversion steps. It helps visualize drop-off.
170) What is a map visual used for?
A map visual displays data by location. It is useful for geographic analysis.
171) What is a KPI card?
A KPI card highlights one important metric. It is used to show key performance values clearly.
172) What is a matrix visual?
A matrix visual presents data in rows and columns with grouping and drill options. It is similar to a pivot table.
173) What is a table visual?
A table visual shows raw or detailed rows of data. It is useful for precise record-level information.
174) How do you choose the right visual?
Choose based on the message you want to communicate. Compare with bar charts, trends with line charts, and composition with cards or tables.
175) Why is visual choice important?
Because the wrong visual can confuse the user or hide the message. Good visual selection improves understanding.
176) What is a dashboard?
A dashboard is a collection of important visuals on a single screen. It gives a quick overview of business performance.
177) Why are dashboards important?
Because they allow managers and stakeholders to monitor key metrics quickly. They are central to BI reporting.
178) What is a report page?
A report page is one canvas in a Power BI report. A report can have multiple pages for different topics.
179) What is a report layout?
Report layout is the arrangement of visuals, text, filters, and spacing on the page. It affects readability and user experience.
180) Why is layout important?
Because a cluttered layout makes the report harder to use. A clean layout improves clarity and professionalism.
181) What is report interactivity?
Report interactivity means users can filter, click, drill, and explore data dynamically. It makes reports more useful than static charts.
182) What is a slicer?
A slicer is a filter visual used to narrow data by a field such as date, category, or region. It gives users control over the report view.
183) What is drill-through?
Drill-through allows the user to move to a detail page filtered by the selected item. It is useful for deeper analysis.
184) What is drill-down?
Drill-down lets the user move from summary to detailed levels within the same visual. It helps explore hierarchies.
185) What is cross-highlighting?
Cross-highlighting shows how one selection affects other visuals without fully filtering them out. It helps preserve context.
186) What is a tooltip page?
A tooltip page is a custom page shown when the user hovers over a visual. It displays extra detail without cluttering the report.
187) Why are tooltips useful?
Because they provide extra information while keeping the report clean. They improve the user experience.
188) What is a bookmark in report design?
A bookmark saves a specific state of the report or page. It is used for navigation and storytelling.
189) What is the purpose of a theme?
A theme controls colors, fonts, and style across the report. It keeps the report consistent and branded.
190) Why is consistency important in report design?
Because consistent visuals and formatting help the report look professional and easier to read. It also improves user trust.
191) What is white space?
White space is the empty area around visuals and text. It helps reduce clutter and improve readability.
192) Why is white space important?
Because crowded reports are harder to scan. Good spacing creates a cleaner and more understandable layout.
193) What is report accessibility?
Report accessibility means designing so more users can use and understand the report. It includes clear colors, labels, and readable visuals.
194) Why is accessibility important in Power BI?
Because reports should work for a wide audience. Inclusive design improves usability and communication.
195) What is a common visualization mistake?
A common mistake is using too many visuals on one page or using the wrong chart type. Another is making the report visually busy.
196) What is a common dashboard mistake?
A common mistake is trying to show everything at once. Good dashboards focus only on the most important metrics.
197) What makes a good dashboard?
A good dashboard is clear, focused, interactive, and easy to read. It should help users answer business questions quickly.
198) What is a strong answer for visualization questions?
A strong answer explains why the visual was chosen and how it supports the business message. Interviewers want communication thinking, not just tool knowledge.
199) Why is report design important in Power BI interviews?
Because Power BI is not only about calculations; it is also about presenting information clearly. Report design shows whether you can build useful BI solutions.
200) How should you practice report design?
Practice building dashboards with a clear story, proper spacing, sensible visuals, and limited clutter. Focus on clarity and usefulness.
Revision focus
Revise bar, column, line, pie, scatter, waterfall, funnel, map, KPI, matrix, and table visuals; dashboards, report pages, layout, interactivity, slicers, drill-through, drill-down, cross-highlighting, tooltips, bookmarks, themes, whitespace, accessibility, and dashboard best practices before moving to Power BI Service, RLS, refresh, and deployment.
Explore PowerBI Career Path
Part 7: Power BI Service, RLS, Refresh & Deployment — Questions 201–240
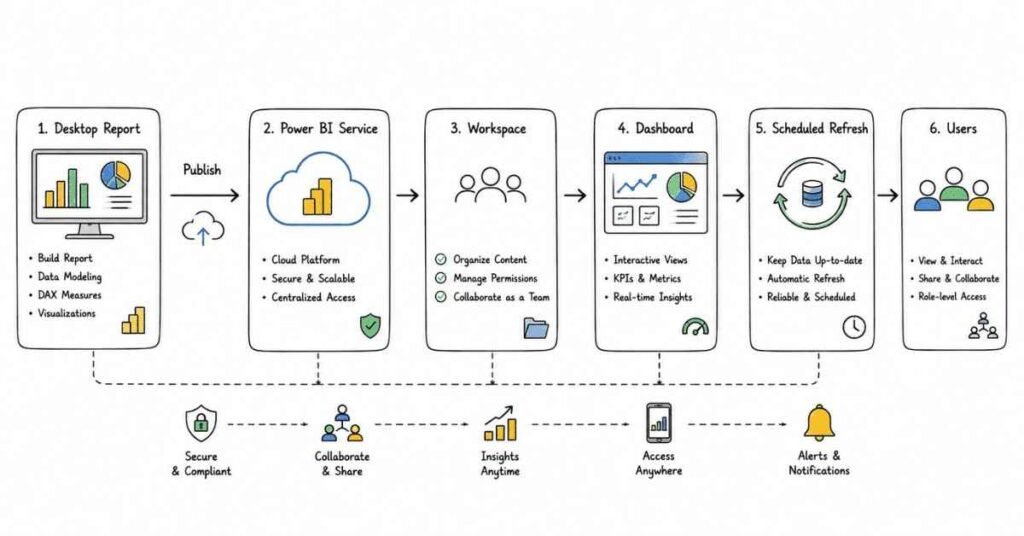
This part covers the cloud and collaboration side of Power BI. It focuses on publishing, sharing, security, refresh, gateways, deployment, and service-level features that are common in real BI environments.
201) What is Power BI Service?
Power BI Service is the cloud platform used to publish, share, and manage Power BI reports and datasets. It is where collaboration and consumption usually happen.
202) Why is Power BI Service important?
Because reports are often shared and maintained in the cloud. It supports teamwork, access control, and scheduled updates.
203) What is publishing in Power BI?
Publishing means sending a report from Power BI Desktop to Power BI Service. It makes the report available online.
204) What is sharing in Power BI Service?
Sharing means giving others access to view or interact with reports or dashboards. Permissions control who can see what.
205) What is a workspace in Power BI Service?
A workspace is a container for reports, dashboards, datasets, and apps. It is used to organize content and collaboration.
206) Why are workspaces useful?
Because they separate content by team, project, or department. They make management easier.
207) What is an app in Power BI?
An app is a packaged version of content from a workspace that can be distributed to users. It provides a controlled viewing experience.
208) What is refresh in Power BI Service?
Refresh updates the dataset with the latest source data. It keeps the report current.
209) Why is refresh important?
Because business reports need up-to-date information. Stale data reduces trust in the report.
210) What is scheduled refresh?
Scheduled refresh runs automatically at set times. It is useful for recurring reports.
211) What is manual refresh?
Manual refresh is triggered by a user when needed. It is useful during development or testing.
212) What is a gateway?
A gateway connects on-premises data sources to Power BI Service. It allows cloud refresh of data stored behind a local network.
213) Why is a gateway needed?
Because Power BI Service cannot directly access some internal data sources. The gateway securely bridges that gap.
214) What is row-level security?
Row-level security, or RLS, restricts which data rows a user can see. It is used to control data access.
215) Why is RLS important?
Because different users should only see the data relevant to them. It improves security and data governance.
216) What is static RLS?
Static RLS uses fixed roles and filters. It is simpler and easier to manage in smaller scenarios.
217) What is dynamic RLS?
Dynamic RLS uses user identity or mappings to filter data automatically. It is more flexible and scalable.
218) What is deployment in Power BI?
Deployment is the process of moving reports and datasets from development to testing or production. It helps manage the release lifecycle.
219) Why is deployment important?
Because BI content should be controlled and validated before broader release. It supports stability and governance.
220) What is a deployment pipeline?
A deployment pipeline is a feature used to manage content across development, test, and production stages. It helps with structured release management.
221) What are permissions in Power BI Service?
Permissions define what users can view, edit, or manage. They control access to content and workspaces.
222) Why are permissions important?
Because BI data is often sensitive. Proper permissions protect access and support governance.
223) What is data lineage?
Data lineage shows how data flows from source to report. It helps track dependencies and impact.
224) Why is data lineage useful?
Because it helps understand where data comes from and what might be affected by a change. It supports maintenance and troubleshooting.
225) What is an incremental refresh policy?
It is a refresh rule that updates only changed or new data partitions. It improves performance for large datasets.
226) Why is incremental refresh useful in service?
Because it reduces refresh time and load on the source system. It is important for scalable reporting.
227) What is a dataflow?
A dataflow is a reusable data transformation layer in Power BI Service. It helps centralize data prep.
228) Why are dataflows useful?
Because they allow reuse of cleaned and shaped data across multiple reports. They improve consistency and reuse.
229) What is a common service-level mistake?
A common mistake is publishing without checking permissions, refresh, or gateway setup. Another is ignoring workspace organization.
230) What is a common RLS mistake?
A common mistake is not testing RLS with actual user identities. Another is building filters that do not match the security requirement correctly.
231) What is a strong answer for refresh questions?
A strong answer explains the source, refresh type, schedule, and gateway if needed. It should show you understand the end-to-end refresh process.
232) What is a strong answer for RLS questions?
A strong answer explains the business need, the filtering logic, and how access is tested. Interviewers want to see both security and practicality.
233) What is a strong answer for deployment questions?
A strong answer explains how reports move through development, test, and production while maintaining control. It should show awareness of governance and stability.
234) Why are service questions important in interviews?
Because Power BI work does not end at report creation. Real BI roles involve publishing, access, refresh, and maintenance.
235) How should you explain Power BI Service in simple terms?
Explain that it is the cloud environment where reports are published, shared, refreshed, and secured for users. That is usually enough for an interview answer.
236) What should you remember about gateways?
Remember that they are needed for on-premises data refresh. They are a key part of many enterprise BI setups.
237) What should you remember about RLS?
Remember that it controls which rows a user can see, and dynamic RLS is often more scalable in larger organizations. Testing is essential.
238) What should you remember about pipelines?
Remember that deployment pipelines help manage release stages and reduce accidental changes. They are useful in structured BI teams.
239) What is the biggest service-level risk?
The biggest risk is assuming the report will work in production the same way it worked locally. Refresh, permissions, and gateway settings must be validated.
240) What is a strong answer for this section overall?
A strong answer shows that you can publish, secure, refresh, and manage Power BI content in a real business environment. Interviewers value practical service-level readiness.
Revision focus
Revise Power BI Service, publishing, sharing, workspaces, apps, scheduled versus manual refresh, gateways, RLS, static versus dynamic RLS, deployment, permissions, data lineage, incremental refresh, and dataflows before moving to SQL, performance optimization, and scenario practice.
Part 8: SQL, Performance Optimization & Scenario Practice — Questions 241–280
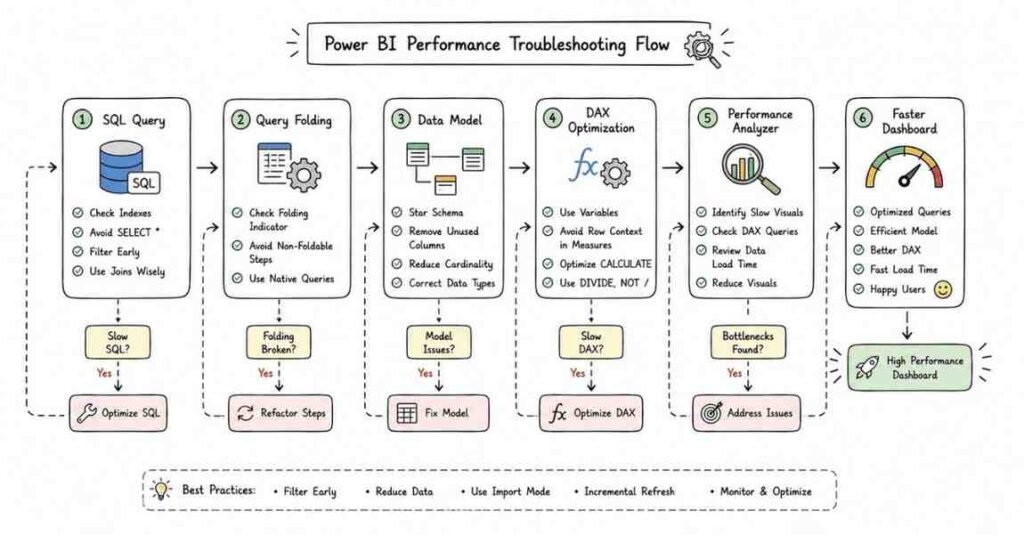
This part covers the practical problem-solving topics that help you stand out in Power BI interviews. It focuses on SQL basics, data source understanding, performance, and scenario-based questions that mirror real BI work.
241) Why is SQL important for Power BI developers?
SQL is important because many Power BI reports use relational databases as source systems. It helps with filtering, shaping, and understanding source data.
242) What is a JOIN in SQL?
A JOIN combines rows from two or more tables based on a related column. It is used constantly in BI data preparation.
243) What is INNER JOIN?
INNER JOIN returns only matching rows from both tables. It excludes rows without a match.
244) What is LEFT JOIN?
LEFT JOIN returns all rows from the left table and matching rows from the right table. Missing right-side values appear as NULL.
245) Why are JOINs important in Power BI work?
Because source data often comes from multiple tables. Knowing joins helps you understand and prepare the data correctly.
246) What is GROUP BY?
GROUP BY collects rows into groups and allows aggregation such as sum or count. It is used to summarize data.
247) What is ORDER BY?
ORDER BY sorts query results in ascending or descending order. It is useful for readability and analysis.
248) What is a WHERE clause?
WHERE filters rows based on a condition. It is used to limit data returned by a query.
249) What is a CTE?
CTE stands for Common Table Expression. It is a temporary named result used for cleaner and more readable SQL queries.
250) Why are CTEs useful?
Because they make complex SQL easier to read and organize. They are common in interview questions and real reporting work.
251) What is a window function?
A window function performs calculations across a set of rows without collapsing the result. It is useful for ranking, totals, and comparisons.
252) Why are window functions important?
Because they support advanced analysis without losing detail. They are widely used in BI and reporting SQL.
253) What is ROW_NUMBER?
ROW_NUMBER assigns a unique sequence number to rows. It is commonly used for ranking and deduplication.
254) What is RANK?
RANK assigns ranking values and leaves gaps when ties occur. It is different from ROW_NUMBER.
255) What is DENSE_RANK?
DENSE_RANK also ranks rows but does not leave gaps after ties. It is useful when compact ranking is needed.
256) What is a common SQL performance issue?
A common issue is querying too much data or using inefficient joins and filters. Bad query design can slow down reports.
257) How can SQL performance be improved?
Use indexes, proper joins, filtered queries, and only the columns you need. Optimizing the source helps Power BI performance too.
258) What is query folding from a SQL perspective?
Query folding means transformations are pushed back to the data source when possible. It allows the database to do more work efficiently.
259) Why is query folding beneficial?
Because it reduces data movement and improves performance. It is especially valuable with large datasets.
260) What is a large dataset challenge in Power BI?
Large datasets can make refresh, modeling, and visuals slower. They require better design and optimization.
261) How can you reduce model size?
Remove unnecessary columns, use the right data types, reduce cardinality, and avoid extra calculated columns when measures are better. Model size affects performance.
262) What is cardinality in performance terms?
Cardinality is the uniqueness of values in a column. High cardinality columns can increase memory usage.
263) What is an aggregation table?
An aggregation table stores summarized data for faster reporting. It helps improve performance on large models.
264) What is the Performance Analyzer?
Performance Analyzer is a tool used to check how long visuals and queries take to load. It helps identify bottlenecks.
265) Why is the Performance Analyzer useful?
Because it helps you find slow visuals or measures. It is a practical optimization tool.
266) What is a bottleneck?
A bottleneck is the part of the system causing slow performance. It could be SQL, model size, DAX, visuals, or refresh.
267) What is a common Power BI optimization mistake?
A common mistake is focusing only on visuals without checking the model or SQL source. Performance must be considered end to end.
268) What is a scenario-based question in Power BI interviews?
It is a practical situation where you must explain how you would solve a reporting problem. It tests real-world thinking.
269) How would you handle a slow report?
First identify whether the issue is in SQL, model size, DAX, visuals, or refresh. Then optimize the bottleneck instead of guessing.
270) How would you handle mismatched numbers between Power BI and SQL?
Check filters, relationships, measures, granularity, and source logic. Mismatches often come from modeling or filter context issues.
271) How would you handle duplicate values in a model?
Identify whether duplicates are in the source, dimension, or fact table. Then clean them or redesign the relationship as needed.
272) How would you handle a report that needs row-level security?
Define the business access rule, create the roles, map the filters, and test with different user identities. Security must be verified before deployment.
273) How would you handle a data refresh failure?
Check the source connection, gateway, credentials, schema changes, and refresh logs. The failure reason should be traced step by step.
274) How would you handle a request for a new dashboard?
Understand the business question, identify the source data, define KPIs, design the model, and then build visuals that tell the story clearly.
275) What should you do when a DAX measure gives unexpected results?
Check filter context, relationships, date table, and the logic inside the measure. Many DAX issues are context-related.
276) What should you do when a visual looks correct but the number seems wrong?
Verify the measure, filters, granularity, and source totals. A visual can look right while the logic is wrong.
277) What is a strong answer for SQL questions?
A strong answer explains the SQL concept, then connects it to BI reporting and source data preparation. Interviewers want practical usage, not only syntax.
278) What is a strong answer for performance questions?
A strong answer identifies the likely bottleneck and explains the optimization method. It should show structured troubleshooting.
279) Why are scenario questions important?
Because Power BI work is mostly problem solving. Interviewers want to know how you think when reports break or requirements change.
280) What is the biggest lesson from scenario practice?
The biggest lesson is to combine SQL, modeling, DAX, service knowledge, and communication. Strong BI candidates solve problems systematically, not randomly.
Revision focus
Revise SQL joins, filtering, grouping, CTEs, window functions, ROW_NUMBER, RANK, DENSE_RANK, performance optimization, cardinality, aggregation tables, Performance Analyzer, slow report troubleshooting, refresh failures, mismatched numbers, and scenario-based problem solving before moving to behavioral, resume, LinkedIn, and career strategy.
Part 9: Behavioral, Resume, LinkedIn & Career Strategy — Power BI Developer Interview Preparation Guide
This final part focuses on presenting yourself well for Power BI roles, not just answering technical questions. Strong candidates are expected to explain dashboards clearly, justify modeling and DAX choices, and position their resume and LinkedIn profile around reporting impact, data modeling, Power Query, DAX, and Power BI Service skills.
STAR method
The STAR method means answering behavioral questions with Situation, Task, Action, and Result. It works especially well in Power BI interviews because many hiring managers want to understand how you handled messy data, slow reports, stakeholder requests, refresh issues, or dashboard redesigns.
Use this Power BI-friendly STAR approach:
- Situation: A reporting issue, dashboard request, refresh failure, DAX problem, or business KPI need.
- Task: What you were responsible for in the project or report.
- Action: What you transformed, modeled, calculated, optimized, designed, or deployed.
- Result: What improved, what insight was delivered, or what you learned.
Example:
Situation: A sales dashboard was slow, and stakeholders were not trusting the numbers because page load time and filter behavior were inconsistent.
Task: The goal was to improve report usability and make KPI calculations more reliable for the business team.
Action: The model was simplified, unnecessary columns were removed, DAX measures were reviewed, and the visuals were redesigned to focus on the most important KPIs and interactions.
Result: The report became faster, easier to understand, and more useful for business reviews, while confidence in the dashboard improved.
20 behavioral questions
Below are 20 common behavioral questions with answer direction.
- Tell me about yourself.
Framework: background → Power BI stack → role target. - Why do you want to work as a Power BI developer?
Framework: interest in reporting and data storytelling → BI fit → long-term direction. - Tell me about a dashboard project you are proud of.
Framework: business need → data/modeling work → visual design → result. - Describe a time you cleaned messy data for reporting.
Framework: data issue → transformation steps → output. - Tell me about a time you handled a DAX challenge.
Framework: business logic need → DAX issue → measure fix. - Describe a time you improved report performance.
Framework: slow report → bottleneck → optimization → result. - Tell me about a time you handled unclear requirements.
Framework: ambiguity → stakeholder clarification → dashboard delivery. - Describe a time you worked with SQL or source systems.
Framework: source issue → query/model support → output. - Tell me about a mistake you made in a report.
Framework: mistake → ownership → correction → lesson. - Describe a time you managed row-level security or access control.
Framework: access need → RLS logic → validation. - Tell me about a time refresh failed.
Framework: issue → diagnosis → fix → prevention. - Describe a time you redesigned a dashboard based on feedback.
Framework: feedback → design revision → improved clarity. - Tell me about a time you explained a dashboard to a non-technical user.
Framework: complexity → simplification → business understanding. - Describe a time you worked with large data.
Framework: scale issue → modeling/performance decisions → outcome. - Tell me about a time you handled mismatched numbers between systems.
Framework: mismatch → validation → root cause → result. - Describe a time you used Power Query effectively.
Framework: source problem → transformation → cleaner model. - Why should we hire you for this Power BI role?
Framework: Power Query + modeling + DAX + dashboard communication. - Where do you see yourself in 3 years?
Framework: deeper BI ownership + stronger data modeling + business impact. - How do you approach a new dashboard request?
Framework: business question → data source → model → report design. - How do you validate numbers before publishing a report?
Framework: source comparison → filter checks → KPI verification.
Keep answers specific and realistic. For freshers, academic projects, internship dashboards, self-built Power BI reports, or SQL-and-Power-BI portfolio work are acceptable if explained honestly and clearly.
50 AI self-preparation prompts
Use these prompts with an AI assistant or for self-practice.
- Ask me Power BI behavioral questions one by one.
- Evaluate my “Tell me about yourself” answer for a Power BI role.
- Rewrite my introduction for a Power BI developer role.
- Rewrite my introduction for a BI analyst role.
- Conduct a mock HR interview for a Power BI developer.
- Conduct a mock technical interview for Power BI basics.
- Ask me Power BI fundamentals questions one by one.
- Ask me Power Query interview questions.
- Ask me data modeling interview questions.
- Ask me DAX interview questions.
- Ask me time intelligence interview questions.
- Ask me Power BI Service interview questions.
- Ask me RLS and refresh interview questions.
- Ask me SQL questions relevant to Power BI.
- Ask me dashboard design interview questions.
- Turn my Power BI project into a STAR answer.
- Improve my Power BI resume bullet points.
- Convert my dashboard project into stronger resume language.
- Create a 30-second Power BI elevator pitch.
- Create a 60-second BI developer elevator pitch.
- Ask follow-up questions after every answer I give.
- Score my answers for clarity and confidence.
- Find weak spots in my Power BI interview preparation.
- Simulate a Power BI developer interview round.
- Simulate a Power Query and modeling round.
- Simulate a DAX round.
- Simulate a Power BI Service and refresh round.
- Simulate a SQL and troubleshooting round.
- Improve my LinkedIn headline for Power BI roles.
- Improve my LinkedIn About section for BI roles.
- Ask me how I designed a star schema.
- Ask me how I improved a slow dashboard.
- Ask me how I handled a refresh failure.
- Ask me how I built dynamic RLS.
- Help me explain a dashboard project clearly.
- Help me explain a DAX measure clearly.
- Make my Power BI interview answers sound more natural.
- Shorten my long answers into interview-ready versions.
- Help me answer “What is your weakness?” for a BI role.
- Help me answer “Why this company?” for a Power BI role.
- Create 20 likely HR questions for Power BI freshers.
- Create 20 likely technical questions for Power BI developers.
- Cross-examine my resume like a Power BI interviewer.
- Check whether my dashboard claims sound realistic.
- Turn my college analytics project into an industry-style BI case study summary.
- Build a 7-day Power BI mock interview plan.
- Create a thank-you email after a Power BI interview.
- Create a recruiter outreach message for Power BI roles.
- Create a no-response follow-up after 5 days.
- Create a final revision checklist from my weak Power BI areas.
Resume optimization
Current Power BI resume guidance strongly favors exact analytics and BI keywords such as DAX, Power Query, data modeling, semantic models, dataflows, RLS, and visualization skills because ATS filters and recruiters search directly for those terms. Resume advice for Power BI candidates also consistently emphasizes project structure, portfolio links, and measurable achievements rather than only listing tools or responsibilities.
Use this structure:
- Name and contact details.
- Resume headline.
- 3–4 line summary.
- Technical skills.
- Experience or projects.
- Education.
- Certifications.
- Portfolio, GitHub, or dashboard links if relevant.
Useful keywords to include naturally:
- Power BI, Power BI Desktop, Power BI Service, DAX, Power Query, Data Modeling, Star Schema, SQL, Power Query Editor, Data Transformation, Dashboard Design, KPI Reporting, Semantic Model, Dataflows, RLS, Incremental Refresh, Query Folding, Power BI Gateway, Report Optimization, Time Intelligence, Business Intelligence.
Better bullet style:
- Built interactive Power BI dashboards using Power Query, DAX, and star-schema modeling for business reporting.
- Cleaned and transformed raw data from Excel, SQL, and other sources using Power Query and reusable transformation steps.
- Designed semantic models with fact and dimension tables, relationships, and date tables for reliable reporting.
- Created DAX measures for KPIs, time intelligence, running totals, and dynamic comparisons.
- Implemented Row-Level Security and scheduled refresh in Power BI Service for secure and up-to-date reporting.
- Optimized report performance by reducing model size, improving DAX logic, and simplifying visuals.
- Validated dashboard outputs against source systems and stakeholder expectations before deployment.
- Published reports to Power BI Service and managed workspaces, refresh, and sharing for end users.
Avoid these mistakes:
- Writing only “worked on Power BI reports.”
- Listing DAX or Power Query without showing how they were used.
- Claiming performance optimization or RLS without project proof.
- Adding too many unrelated tools that dilute your BI profile.
- Skipping dashboard links or project explanations for fresher roles.
Resume summary example
For fresher:
“Entry-level Power BI developer with strong foundations in Power BI Desktop, Power Query, DAX, data modeling, SQL, and dashboard design. Hands-on project experience building interactive reports, KPI dashboards, and business-ready models using star schema, transformation logic, and Power BI Service features. Seeking an opportunity to contribute to reporting, analytics, and business intelligence solutions.”
For experienced candidate:
“Power BI developer with experience building scalable dashboards and semantic models using Power Query, DAX, SQL, and Power BI Service. Comfortable with data transformation, star-schema modeling, KPI reporting, Row-Level Security, refresh management, and report optimization across business reporting environments. Interested in roles that combine technical BI execution with clear business storytelling and performance-focused design.
LinkedIn profile optimization
For Power BI roles, your LinkedIn profile should show your BI identity quickly through title, skills, and project depth. Recruiters usually scan for Power BI, DAX, SQL, modeling, and dashboard work before reading detailed experience.[resumeatlas]
Use these upgrades:
- Headline: include role target plus stack keywords.
- About: 3 short paragraphs with background, tools, and role focus.
- Experience: use action-based BI bullets.
- Featured: add dashboard portfolio links, PBIX case studies, GitHub, or report demos if available.
- Skills: list platform, modeling, and reporting concepts.
- URL: customize it.
- Open to Work: enable it if relevant.
Headline examples:
- General BI: Power BI Developer | DAX, Power Query, Data Modeling, SQL, Dashboard Design
- Fresher: Aspiring Power BI Developer | Power BI, DAX, SQL, Data Modeling, KPI Dashboards
- Experienced: BI Developer | Power BI Service, DAX, SQL, RLS, Report Optimization
About section template:
“I build business intelligence reports and dashboards using Power BI, DAX, Power Query, SQL, and data modeling. My core strengths include data transformation, semantic model design, KPI reporting, dashboard development, and report optimization.
My projects and experience include interactive Power BI dashboards, star-schema models, time-intelligence measures, RLS implementation, and refresh management through Power BI Service. I am especially interested in roles where strong modeling, business understanding, and clear visual communication come together.
I am currently targeting opportunities in Power BI development, BI reporting, dashboard engineering, and analytics-focused roles where I can contribute to reliable, user-friendly business intelligence solutions.”
Project and portfolio strategy
Project explanation matters heavily in Power BI interviews because recruiters and hiring managers often judge skill depth through actual dashboards, data models, DAX logic, and business storytelling. Strong Power BI candidates are usually able to explain not just what the dashboard shows, but why the model and measures were designed that way.
Strong project categories:
- Sales performance dashboard.
- Finance KPI dashboard.
- HR analytics dashboard.
- Inventory or supply chain report.
- Customer churn or service dashboard.
- Executive scorecard.
- SQL + Power BI end-to-end reporting project.
- Dynamic RLS reporting project.
- Performance optimization project.
- Power BI Service deployment and refresh project.
For each project, prepare these six points:
- Business problem.
- Data sources used.
- Model design.
- DAX or KPI logic.
- Your contribution.
- Result and learning.
Example explanation:
“I built a sales performance dashboard in Power BI using SQL as the source and Power Query for cleaning and shaping the data. I designed a star schema with a date table, created DAX measures for sales, growth, YTD, and top performers, and published the report to Power BI Service with scheduled refresh. The project improved reporting clarity for business users and helped me understand how modeling, DAX, and visual design work together.”
Salary guidance in India
Salary estimates for Power BI developers in India vary widely by source, but multiple 2026 references place entry-level roles around ₹3–6 LPA and mid-level roles broadly in the ₹6–12 LPA band, while stronger senior profiles can move into ₹12–20+ LPA depending on SQL, data modeling, and broader BI depth. Some sources also report higher national averages, including ₹9 lakh as a typical developer benchmark and ₹12,39,162 as an India average in broader market reporting, which suggests compensation can rise sharply with experience, location, and specialization.
A practical planning range is:
- Fresher: ₹3–6 LPA.
- 1–3 years: ₹5–10 LPA.
- 3–6 years: ₹8–18 LPA.
- Senior / specialized roles: ₹12–22+ LPA depending on modeling depth, SQL strength, and enterprise BI responsibility.
Use salary discussions carefully and anchor them to your actual dashboard depth, DAX strength, SQL ability, and project ownership rather than inflated internet claims. Compensation varies a lot by city, employer type, and whether the role is reporting-heavy or closer to BI engineering.
Sample line:
“Based on my Power BI, DAX, SQL, and reporting experience, I am looking for a fair opportunity in the range of X to Y LPA, while also considering the role scope, team quality, and long-term growth.”
Thank-you and follow-up emails
Thank-you email template
Subject: Thank you — Power BI Developer interview
Hello [Interviewer Name],
Thank you for taking the time to speak with me today regarding the Power BI Developer role. I enjoyed our discussion, especially the conversation around [DAX / data modeling / dashboard design / Power BI Service / refresh / RLS].
The role aligns strongly with my background in Power BI, reporting, and business-focused analytics, and I would be excited about the opportunity to contribute.
Thank you again for your time and consideration.
Best regards,
[Your Name]
[Phone Number]
[Email]
Follow-up email after 4–7 days
Subject: Follow-up on Power BI Developer interview
Hello [Interviewer Name],
I hope you are doing well. I wanted to follow up on the interview process for the Power BI Developer position. I remain very interested in the role and wanted to check whether there are any updates regarding the next steps.
Thank you for your time and consideration.
Best regards,
[Your Name]
Final 30-day checklist
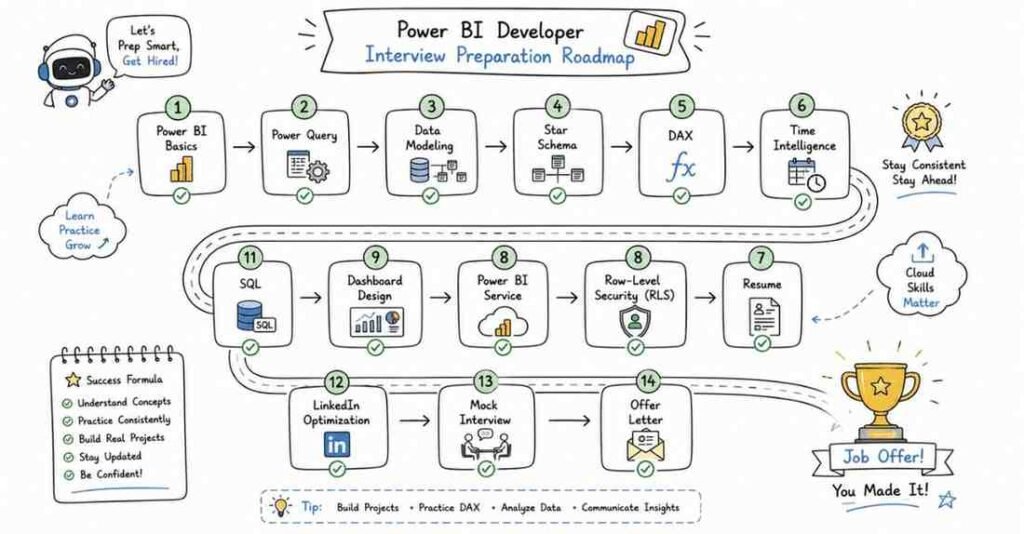
Week 1
- Revise Power BI basics, Desktop versus Service, reports, dashboards, and connection modes.
- Practice speaking about Power BI workflow aloud.
- Finalize 2 dashboard project stories.
- Update resume summary and technical skills.
Week 2
- Revise Power Query, transformations, append, merge, data types, and query folding.
- Practice data cleaning and transformation questions daily.
- Strengthen one Power Query-heavy project explanation.
- Update LinkedIn headline and About section.
Week 3
- Revise data modeling, star schema, relationships, DAX, row context, filter context, and time intelligence.
- Practice DAX and modeling questions.
- Prepare answers around KPI measures, date tables, and dashboard logic.
- Review report design and usability concepts.
Week 4
- Revise Power BI Service, RLS, refresh, SQL, performance, and scenario-based questions.
- Do full mock interviews: HR, Power Query, DAX, modeling, and troubleshooting rounds.
- Review salary range and recruiter communication.
- Apply consistently and track responses.
Final 3 days
- Review only your condensed notes and project summaries.
- Practice concise spoken answers.
- Keep resume, portfolio links, dashboards, and documents ready.
- Focus on clarity, calmness, and consistency.
Revision focus
Revise behavioral answers, dashboard storytelling, resume wording, LinkedIn positioning, salary discussion, and follow-up email templates before your final interview rounds.