How to Become an Advanced Excel Expert in 2026 Complete Career Guide
Table of Contents
Advanced Excel is one of the most useful workplace skills because it helps you clean data, analyze reports, build dashboards, and make faster decisions. If you can master formulas, pivot tables, lookups, charts, and automation, you can become valuable in roles across finance, operations, HR, sales, marketing, and analytics. This guide shows you the exact roadmap to become job-ready in 2026, whether you are a fresher, a working professional, or someone who wants to improve productivity and career growth.

What an Advanced Excel Expert Does
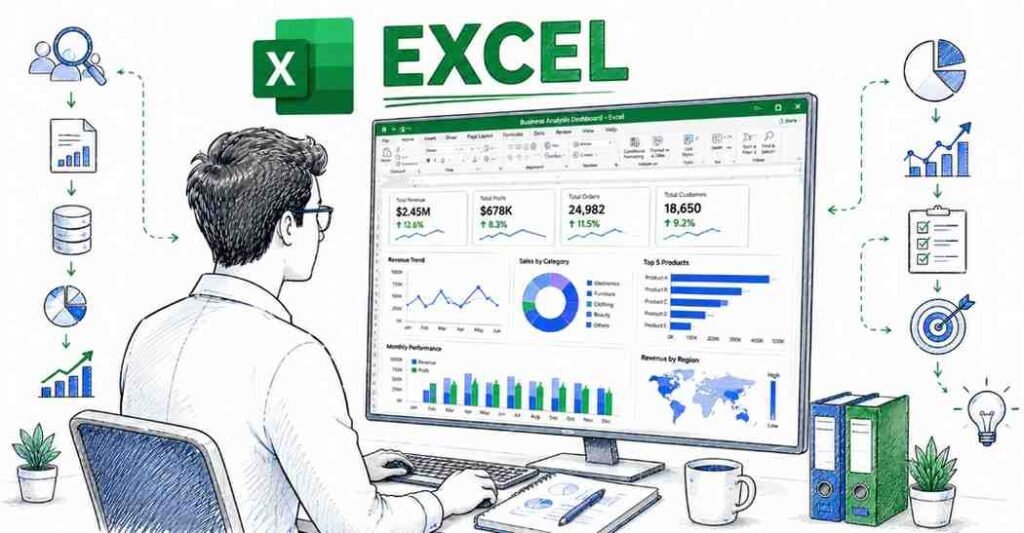
An advanced Excel expert works with data to create reports, summaries, dashboards, and automated workflows. The role is not just about entering numbers; it is about turning raw data into clear business information.
Excel is used in almost every office. That is why people who can use it well often become the go-to person in their team for reporting and analysis.
Main responsibilities
- Clean and organize data.
- Build formulas and calculations.
- Create pivot tables and dashboards.
- Analyze trends and patterns.
- Prepare reports for management.
- Automate repetitive tasks.
- Support business decisions with data.
Why Advanced Excel Is a Smart Career Skill
Advanced Excel is a smart skill because it helps you become more productive in almost any office role. It is also one of the easiest ways to stand out when applying for jobs in operations, MIS, business analysis, and reporting.
The skill is also practical for career growth. If you know Excel well, you can move faster in interviews, work more efficiently, and handle business data with confidence.
Why students and professionals choose it
- Useful across many industries.
- Easy to start and easy to apply at work.
- Improves reporting and decision making.
- Helps in interviews for office and analytics roles.
- Supports career growth in non-technical and technical paths.
🌟 Continue your learning journey with Our → Courses.
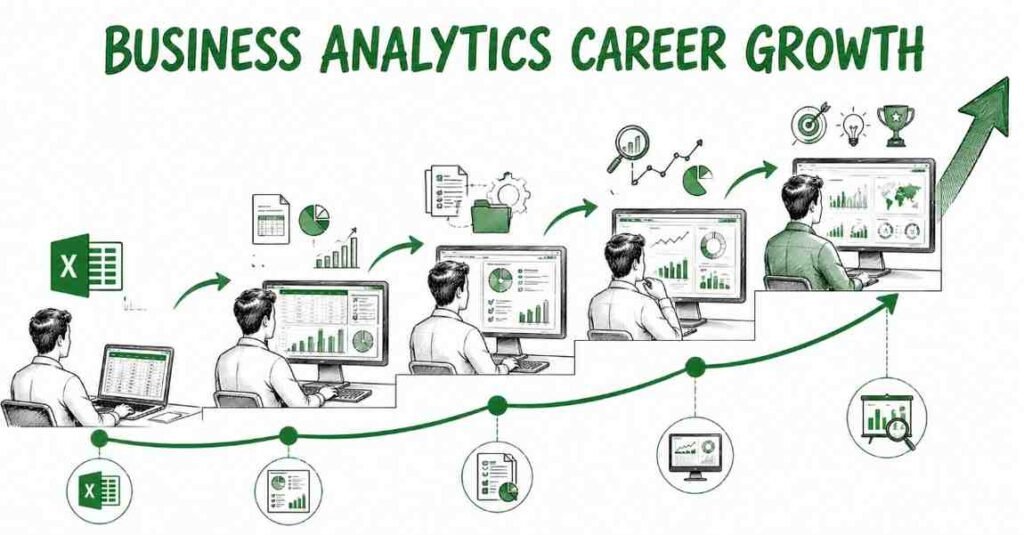
Advanced Excel Roles Compared
Excel appears in many job titles, depending on how deeply you use it.
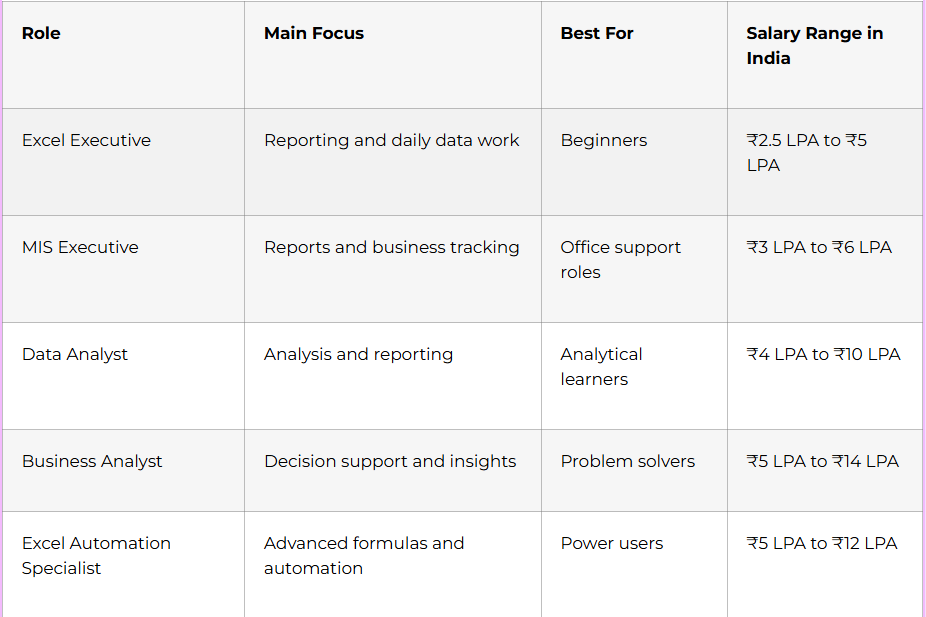
If you are starting out, Excel can open doors into operations, MIS, finance, analytics, and business support roles.
Complete Learning Roadmap
Phase 1: Excel Foundations
Before learning advanced features, you need to be comfortable with the workbook structure and basic operations.
Focus on:
- Cells, rows, columns, sheets, and workbooks.
- Data entry and formatting.
- Basic formulas.
- Sorting and filtering.
- Table structure.
- Relative and absolute references.
- Keyboard shortcuts.
Phase 2: Core Formulas
Formulas are the heart of Excel. Once you understand them, your work becomes faster and more accurate.
Learn:
- SUM, AVERAGE, MIN, MAX.
- COUNT, COUNTA, COUNTIF, COUNTIFS.
- SUMIF, SUMIFS.
- IF, IFS, AND, OR.
- ROUND, ROUNDUP, ROUNDDOWN.
- CONCAT, TEXTJOIN.
- LEFT, RIGHT, MID, LEN.
- TRIM, CLEAN, PROPER, UPPER, LOWER.
Phase 3: Lookup and Reference Functions
These functions are used heavily in office reporting and data matching tasks.
Learn:
- VLOOKUP.
- HLOOKUP.
- XLOOKUP.
- INDEX and MATCH.
- IFERROR.
- CHOOSE.
- OFFSET.
- INDIRECT.
Phase 4: Data Analysis Tools
Excel becomes powerful when you use tools that summarize large datasets.
Learn:
- Sort and filter.
- Remove duplicates.
- Text to columns.
- Conditional formatting.
- Data validation.
- Pivot tables.
- Pivot charts.
- Slicers.
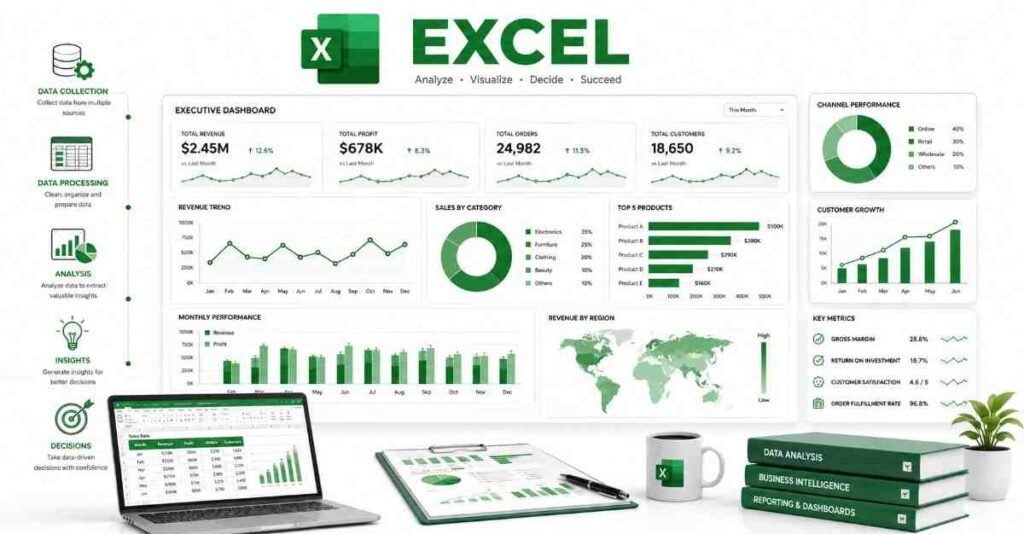
Phase 5: Dashboards and Visualization
Dashboards help you present data in a simple visual format that management can understand quickly.
Learn:
- Chart types.
- KPI cards.
- Dynamic charts.
- Pivot dashboards.
- Slicers and timelines.
- Scenario-based reports.
- Clean layout design.
Phase 6: Automation and Productivity
Automation saves time and reduces mistakes. Once you know advanced Excel, you should learn how to reduce repetitive work.
Learn:
- Macros.
- VBA basics.
- Keyboard shortcuts.
- Power Query basics.
- Power Pivot basics.
- Workflow cleanup.
Formulas, Pivot Tables, and Dashboards
These three areas create most of the value in advanced Excel work.
Formulas to master
- Logical formulas like IF and IFS.
- Lookup formulas like XLOOKUP and INDEX-MATCH.
- Aggregation formulas like SUMIFS and COUNTIFS.
- Text formulas for cleaning and combining data.
- Date formulas for tracking timelines.
Pivot table skills to master
- Grouping data.
- Summarizing sales and performance data.
- Creating filters and slicers.
- Building report views quickly.
- Combining pivots with charts.
Dashboard skills to master
- Showing trends with charts.
- Highlighting KPIs.
- Using clean colors and labels.
- Making reports easy for managers to read.
- Designing dynamic dashboards with slicers.
Salary Expectations in India
Salary depends on your Excel depth, business understanding, and reporting experience. Excel experts who also know dashboards, automation, and analysis usually earn more.
Experience Level | Typical Salary |
Fresher | ₹2.5 LPA to ₹4 LPA |
1–3 years | ₹4 LPA to ₹7 LPA |
3–5 years | ₹7 LPA to ₹12 LPA |
5+ years | ₹12 LPA to ₹18 LPA+ |
People who move into MIS, analytics, or business intelligence after Excel often get better salary growth.
Portfolio That Gets Interviews
A strong portfolio shows that you can actually use Excel for business problems. Recruiters like practical examples more than certificates alone.
What to include
- Sales report dashboard.
- Employee attendance tracker.
- Expense tracking sheet.
- KPI report with pivots.
- Data cleaning case study.
- Dynamic chart dashboard.
- Automation example with formulas or macros.
Portfolio checklist
- Use clean formatting.
- Show the problem and solution.
- Include screenshots.
- Mention formulas and tools used.
- Keep files easy to understand.
- Build examples from real-world business cases
Job Search Strategy
Your resume should clearly show your Excel strength and the kind of data work you can handle. Many recruiters search for reporting, MIS, operations, and analytics experience.
Resume keywords
- Advanced Excel
- Pivot tables
- XLOOKUP
- INDEX-MATCH
- MIS reporting
- Dashboards
- Data cleaning
- Conditional formatting
- Power Query
- VBA
- Reporting automation
- Data analysis
Where to apply
- LinkedIn Jobs
- Naukri
- Indeed
- company career pages
- MIS and reporting roles
- analytics support roles
- operations and finance roles
Interview preparation
Be ready to answer questions like:
- What is the difference between VLOOKUP and XLOOKUP?
- How do you use pivot tables?
- How do you clean messy data in Excel?
- What is the difference between relative and absolute reference?
- How do you build a dashboard?
- How do you automate repetitive tasks in Excel?
📁 Build a job-ready portfolio with our project documentation interview Guide templates & sample dashboards.
30-Day Starter Plan
If you want to begin now, follow this simple plan.
Week 1
- Learn Excel basics.
- Practice shortcuts.
- Understand cells, sheets, and references.
- Create your first simple report.
Week 2
- Learn formulas.
- Practice IF, SUMIF, COUNTIF, and lookup functions.
- Clean sample datasets.
- Start a basic practice file.
Week 3
- Learn pivot tables.
- Create charts.
- Build a small dashboard.
- Practice filtering and formatting.
Week 4
- Learn Power Query basics.
- Create one portfolio project.
- Update your resume.
- Apply for jobs or internships.
🚀 Start your analytics journey with structured, step-by-step learning paths for Excel & BI.
Why Learn Advanced Excel at Frontlines Edutech
Frontlines Edutech is a practical choice for students and working professionals who want structured learning, regional support, and career-focused training. The best programs combine formulas, dashboards, project work, and interview preparation in a way that makes job readiness realistic.
What to look for in training
- Strong formula practice.
- Pivot table and dashboard training.
- Real reporting projects.
- Automation and productivity shortcuts.
- Resume and interview support.
- Regional-language explanation if needed.
Frequently Asked Questions
1. How long does it take to become an advanced Excel expert?
It usually takes 1 to 3 months of consistent practice to become job-ready in advanced Excel, depending on how much hands-on work you do.
2. Is advanced Excel a good career skill in India?
Yes, it is one of the most practical workplace skills because companies across industries use Excel for reporting, analysis, and decision making.
3. Which skill should I learn first?
Start with Excel basics, formulas, and shortcuts. After that, move into pivot tables, dashboards, and automation.
4. Do I need coding to learn advanced Excel?
No, coding is not required for advanced Excel. VBA and Power Query are useful, but most learners can become highly effective without programming.
5. What is the best specialization for beginners?
MIS reporting and business reporting are the easiest starting points. If you like analysis, you can later move into data analyst work.
6. Can I get a job without experience?
Yes, if you have practical portfolio files, a strong resume, and basic reporting knowledge. Excel is one of the easiest skills to prove with real examples.
7. Which tools should I learn first?
Start with formulas, pivot tables, charts, conditional formatting, and XLOOKUP. Then move to Power Query, Power Pivot, and macros.
8. Is advanced Excel remote-friendly?
Yes, many reporting and data support roles are remote-friendly because most work can be done digitally.
9. What kind of projects should I show in interviews?
Show sales dashboards, expense trackers, KPI reports, and data cleaning files. Employers want to see practical reporting and analysis skills.
🌟 Continue your learning journey with Roadmaps → Resources → Interview Guides → Courses.