Advanced Excel with AI: Complete 90-Day Roadmap to Land Your First Job
Table of Contents
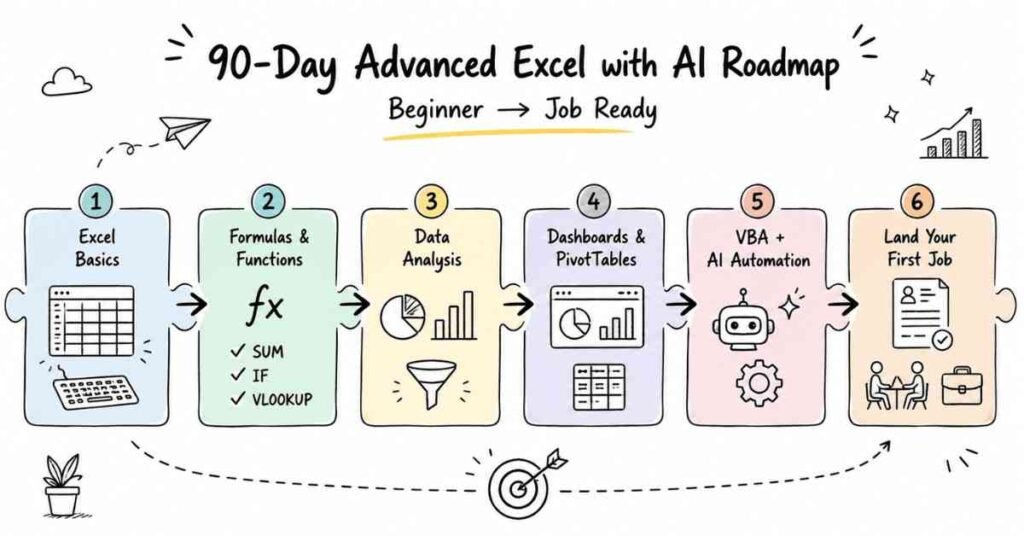
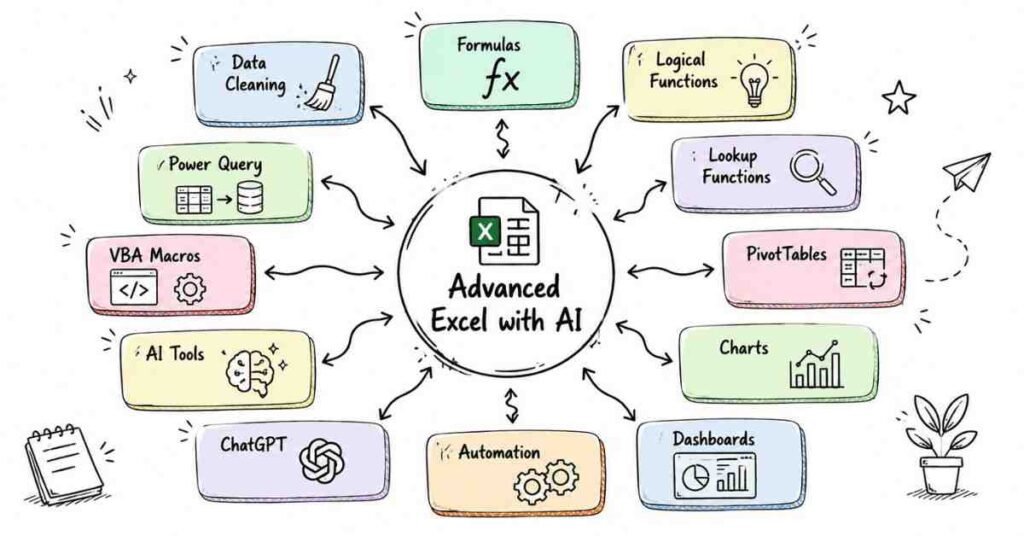
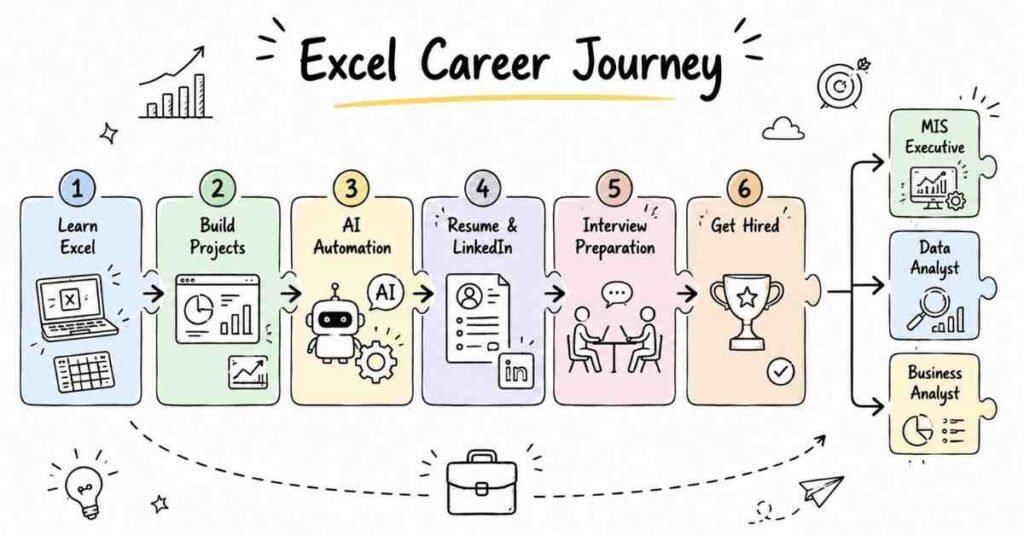
This is a structured 90-day roadmap to go from Excel beginner to a job-ready professional who can build automated dashboards, write complex formulas, use VBA macros, and leverage ChatGPT all inside Microsoft Excel. Built on Frontlines Edutech’s Advanced Excel with AI course curriculum, this plan is designed for students and freshers in India who want a skill that’s in-demand across every industry. Excel appears in over 531,000 job listings more than Python, SQL, or machine learning. By Day 90, you’ll have a certified portfolio, an optimised LinkedIn profile, and the interview confidence to land roles paying ₹3–6 LPA to start, growing to ₹15–25 LPA with experience.
Why Excel with AI Is the Smartest Skill to Learn Right Now
Most students assume Excel is “basic.” That’s exactly why those who master it especially with AI stand out. Here’s the hard truth:
- 85% of clerical, administrative, and analyst roles require Excel proficiency
- Certified Excel professionals earn 12% more on average than non-certified peers
- Companies like Infosys, TCS, Wipro, Accenture, Cognizant, and IBM use Excel daily for reporting, data analysis, and automation
- Excel with ChatGPT integration means you finish in 30 minutes what used to take half a day
This roadmap isn’t about memorising formulas. It’s about becoming the person in the office who solves problems with data faster than anyone else.
The 3-Month Learning Structure at a Glance
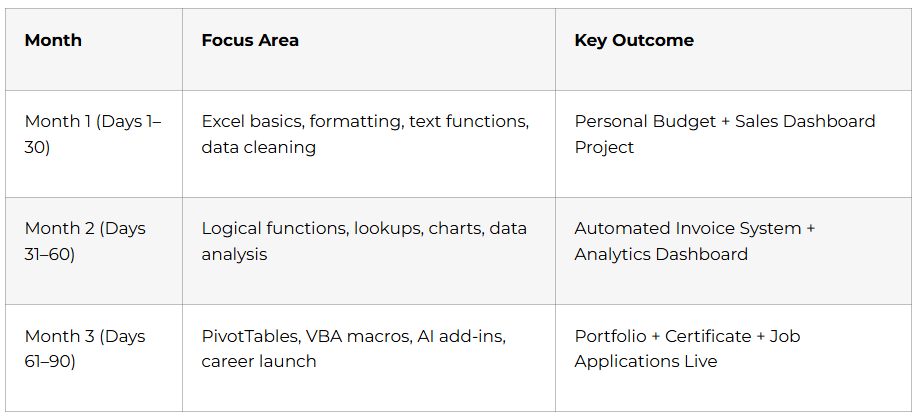
Month 1: Build Your Foundation (Days 1–30)
Even if you’ve never opened Excel before, by Day 30 you’ll be building professional spreadsheets with AI assistance. Don’t skip this month everything in Months 2 and 3 builds on these fundamentals.
Week 1: Excel Interface + ChatGPT Basics (Days 1–7)
- Day 1 — Excel workspace, ribbon, formula bar, keyboard shortcuts, creating your first workbook
- Day 2 — Set up ChatGPT; learn how AI assists your Excel work; understand AI capabilities and limits
- Day 3 — Data entry: text, numbers, dates; auto-fill; best practices for organising rows and columns
- Day 4 — Cell formatting: fonts, colours, borders, number formats for currency and percentages
- Day 5 — Date and time formats; how Excel stores dates as numbers; AI-generated date formulas
- Day 6 — Cell references: relative (A1), absolute ($A$1), and mixed when and why to use each
- Day 7 — Mini Project: Build a personal budget spreadsheet from scratch using ChatGPT for guidance
💡 Career Tip: Right now, this week set up your LinkedIn profile. Headline: “Aspiring Data Analyst | Excel with AI | Frontlines Edutech” recruiters in Hyderabad and Bangalore search these keywords every day.
Week 2: Prompt Engineering + Core Formulas (Days 8–14)
Most students ask ChatGPT the wrong way and get useless answers. Week 2 fixes that:
- Day 8–9 — Prompt engineering framework: how to write specific, context-rich prompts for Excel
- Day 10 — SUM, AVERAGE — the foundation of every financial spreadsheet
- Day 11 — MIN, MAX, COUNT, COUNTA, COUNTBLANK — for data validation and reporting
- Day 12 — Describe what you need in plain English → AI writes the formula → you understand it
- Day 13 — AI formula explanation: break down complex nested functions step-by-step
- Day 14 — AI formula debugging: fix #VALUE!, #REF!, #DIV/0! errors using ChatGPT
Week 3: Data Management with AI Support (Days 15–21)
- Sorting: single-level, multi-level, by colour, custom lists
- Filtering: auto-filters, custom conditions, date ranges, text filters
- Data validation: dropdown lists, number/date/text rules, dependent dropdowns with AI
- Remove duplicates identifying duplicate records across large datasets
- Day 21 Project: Build a comprehensive sales tracking spreadsheet with sorting, filtering, and validation
Week 4: Text Functions + Data Cleaning (Days 22–30)
This is the week that makes you genuinely useful to any employer. Clean, usable data is everything in business analytics.
- Text to Columns — split full names, addresses, and codes into separate columns
- Flash Fill — Excel’s intelligent pattern recognition for instant data transformation
- LEFT, RIGHT, MID — extract specific characters from any text string
- LEN, CONCATENATE / TEXTJOIN — combine text, validate data length, build dynamic labels
- Data cleanup: remove extra spaces (TRIM), fix caps (PROPER/UPPER/LOWER), standardise formats
- Handling missing data: identify blanks, decide when to fill or flag, use ChatGPT for strategy
- Day 29 Project: Clean a messy customer database using all text functions
- Day 30: Month 1 review + assessment + personalised feedback
Month 2: Intermediate Mastery with AI (Days 31–60)
Month 2 is where you stop being a “spreadsheet user” and start being a data analyst. Every formula and technique here shows up in real interviews.
Week 5: Logical & Conditional Functions (Days 31–37)
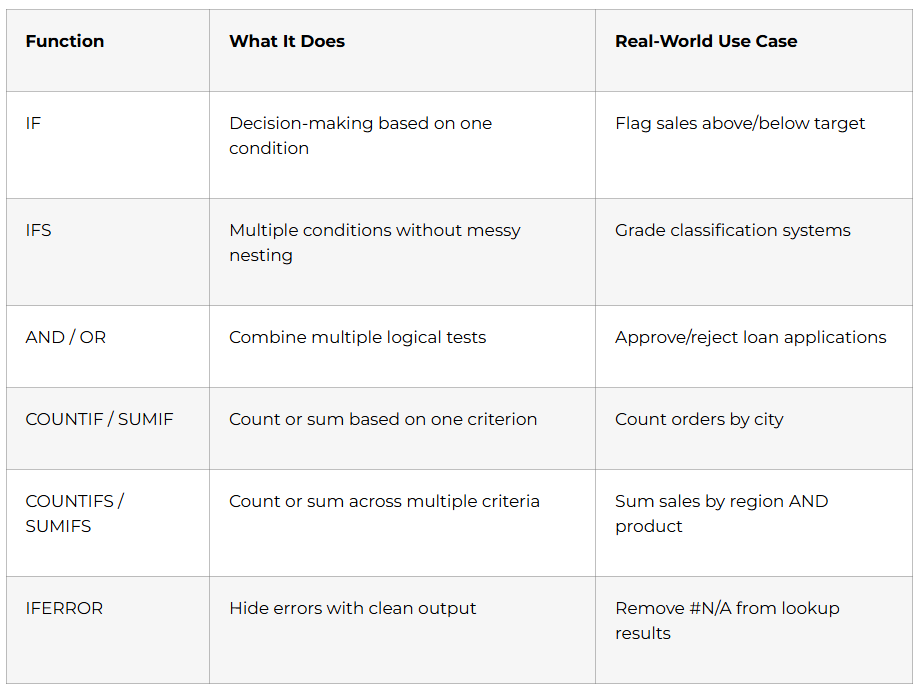
- Day 37 Project: Build an employee performance tracker with automated flags and alerts using AI
Week 6: Lookup Functions — The Most Tested Interview Topic (Days 38–44)
Every data analyst interview includes at least one VLOOKUP or XLOOKUP question. Master all four:
- VLOOKUP — vertical lookups, exact vs. approximate match, common errors and fixes
- HLOOKUP — horizontal table lookups; when to use over VLOOKUP
- XLOOKUP — the modern replacement: search any direction, return multiple values, cleaner syntax
- INDEX + MATCH — the most powerful combo; works where VLOOKUP fails
- Day 43 — Describe lookup problems to ChatGPT in plain English, get step-by-step solutions
- Day 44 Project: Build an automated invoice system that pulls product prices, customer details, and tax rates using lookup functions
💡 Career Tip: By Week 6, you should have at least 2 Excel project files saved and documented. Interviewers will ask you to share your screen and walk through a working spreadsheet. Start building that habit now.
Week 7: Data Visualisation with AI Guidance (Days 45–51)
Numbers don’t move people charts do. This week teaches you to tell stories with data:
- Day 45–46 — Column, line, pie charts; customising colours, labels, legends with AI suggestions
- Day 47 — Combo charts, scatter plots, waterfall charts when to use each
- Day 48 — Describe your data to ChatGPT → get specific chart type and colour scheme recommendations
- Day 49 — Dynamic charts that auto-update when new data is added
- Day 50 — Dashboard design: visual hierarchy, layout principles, user experience for non-technical audiences
- Day 51 Project: Build a multi-chart sales performance dashboard your portfolio piece #3
Week 8: Data Analysis + What-If Scenarios (Days 52–60)
- Descriptive Statistics — mean, median, mode, standard deviation using Excel’s Analysis Toolpak
- AI for Data Interpretation — upload datasets to ChatGPT, get plain-English trend analysis
- Goal Seek — work backwards from a desired result to find the input needed
- Data Tables — one-variable and two-variable tables for scenario comparison
- Business Scenario Simulation — build financial models with multiple scenarios for decision-making
- Day 59 Project: Full business dataset analysis raw data → insights → visualisations → written recommendations
- Day 60: Month 2 assessment + review + prepare for advanced topics
Month 3: Advanced Mastery & Career Launch (Days 61–90)
This is where you become the person every team wants. PivotTables, VBA automation, and AI-powered add-ins plus a complete career launch sprint.
Week 9: PivotTables & Advanced Analysis (Days 61–67)
PivotTables are the #1 most asked-about Excel feature in interviews. Spend serious time here.
- Day 61 — PivotTable fundamentals: drag fields into rows, columns, values, filters
- Day 62 — Calculated fields for custom metrics; summarisation by sum, average, count, %
- Day 63 — Grouping dates by month/quarter/year; grouping numbers into ranges
- Day 64 — Slicers: interactive visual filters; connect slicers across multiple PivotTables
- Day 65 — PivotCharts: dynamic charts that update with your PivotTable automatically
- Day 66 — Describe your analysis to ChatGPT; get step-by-step PivotTable setup instructions
- Day 67 Project: Full sales analysis dashboard using multiple PivotTables, PivotCharts, and slicers executive-ready
Week 10: Automation with Macros & VBA (Days 68–74)
If PivotTables are what gets you hired, VBA is what gets you promoted.
- Day 68–69 — Record macros for repetitive tasks; assign macros to buttons; relative reference recording
- Day 70 — Read VBA code behind recorded macros; understand basic syntax; make simple edits
- Day 71 — Describe automation task to ChatGPT in plain English → get complete VBA script → implement safely
- Day 72 — Write custom user-defined functions (UDFs) that work like built-in Excel functions
- Day 73 — Advanced automation: self-updating reports, data imports from multiple sources, form-based data entry
- Day 74 Project: Automated monthly report generator using macros and VBA with error handling
Week 11: Advanced AI Tools & Power Query (Days 75–81)
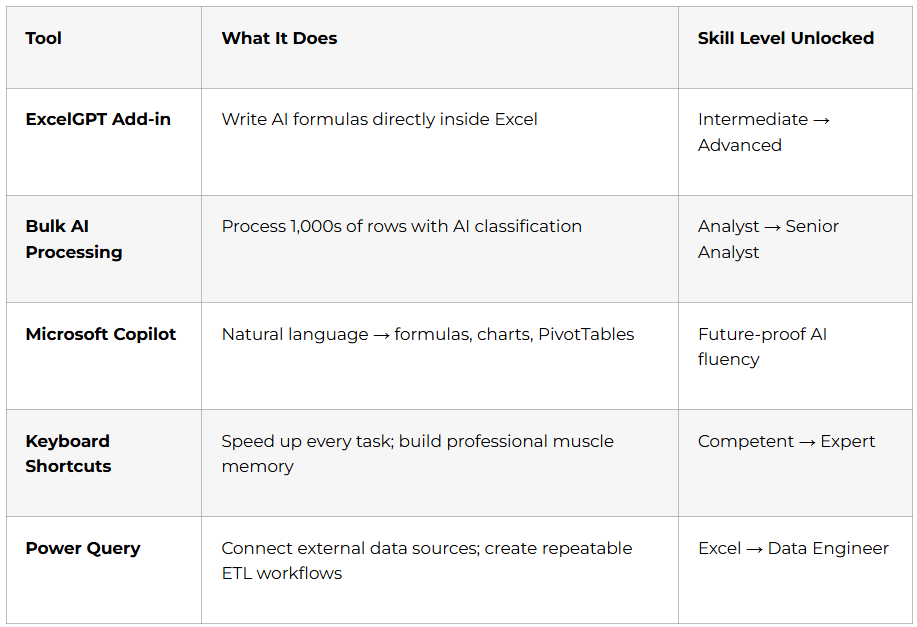
- Day 81 Project: End-to-end automated analytics pipeline combining Excel + AI add-ins + macros + Power Query
Week 12: Career Launch Sprint (Days 82–90)
This week is purely about getting hired. Here’s the exact action plan:
- Day 82 — Select your top 5–7 projects; record screen demos; prepare GitHub/portfolio
- Day 83 — ATS-optimised resume: quantify results (“Automated reporting saving 15 hours/week”), action verbs, Excel with AI as key differentiator
- Day 84 — LinkedIn deep optimisation: headline (“Data Analyst | Excel + AI Automation | Hyderabad”), summary, skills endorsements, project media uploads
- Day 85 — Set up profiles on Naukri, LinkedIn Jobs, Indeed, Glassdoor; set job alerts for “MIS Executive”, “Data Analyst“, “Excel Analyst”
- Day 86 — Technical interview prep: formula questions, live Excel tests, dashboard walkthroughs
- Day 87 — Behavioural interview prep: STAR method stories about your 90-day projects
- Day 88 — Salary research: ₹3–6 LPA entry-level in Hyderabad/Bangalore; negotiation techniques for freshers
- Day 89 — Final assessment; capstone project; receive Frontlines Edutech course completion certificate
- Day 90 — Applications go live; portfolio published; career begins 🎯
🚀 Don’t Let Interviews Stop Your Career Journey
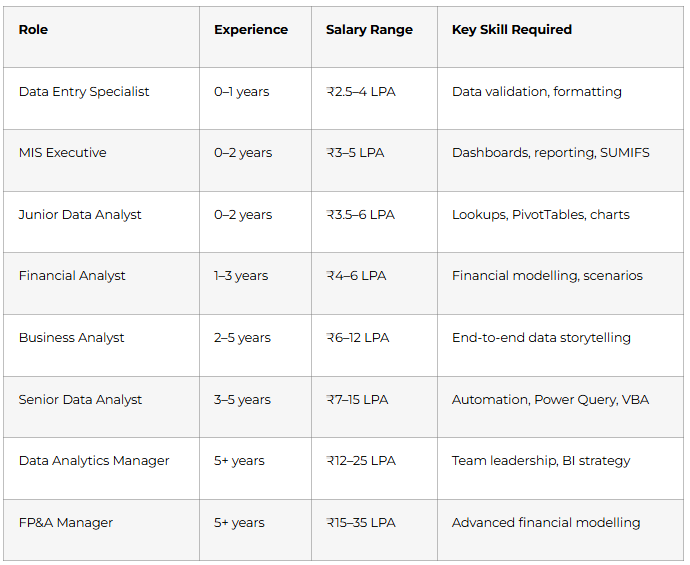
Excel Career Paths & Salary Guide (India 2025)
Top cities hiring Excel professionals: Hyderabad, Bangalore, Mumbai, Pune, Gurgaon, Chennai, Noida
Why Choose Frontlines Edutech
Frontlines Edutech is based right here in Hyderabad and has empowered over 3,000 learners across the Telugu states to transform their careers. We teach in your language, at your pace, and at a price that makes sense.
- Mentors from top companies — not pre-recorded theory from someone who never worked in industry
- Hands-on projects every week — you graduate with a portfolio, not just a certificate
- Telugu-friendly teaching — complex concepts broken down so they actually click
- Daily assignments + Q&A sessions — you’re never stuck for more than 24 hours
- Resume + LinkedIn + mock interview support — career preparation built into the course, not added as an afterthought
- Placement updates — we actively share job leads matching your skill level
Frequently Asked Questions
Q1: Do I need prior Excel knowledge to start this 90-day roadmap?
No. This roadmap begins from Day 1 basics opening Excel, entering data, understanding cell references. It is designed for complete beginners, including students, freshers, and working professionals switching domains.
Q2: How many hours per day do I need to spend on this Excel course?
Plan for 2–3 hours daily. Students balancing college or a job can manage with focused, uninterrupted sessions. Skipping days is not recommended since each week’s content builds directly on the previous one.
Q3: Is Advanced Excel with AI still worth learning in 2025?
Yes. Excel appears in over 531,000 active job listings in India more than Python, SQL, or machine learning. Adding AI and ChatGPT integration to your Excel skills makes you significantly more valuable and faster than peers.
Q4: What jobs can I get after completing this Advanced Excel course?
You can apply for MIS Executive (₹3–5 LPA), Junior Data Analyst (₹3.5–6 LPA), Financial Analyst Trainee (₹4–6 LPA), and Operations Analyst roles across IT companies, banks, e-commerce firms, and consulting companies.
Q5: Will I learn VBA and macros in this course?
Yes. Week 10 (Days 68–74) is fully dedicated to macro recording and VBA scripting, including using ChatGPT to generate complete automation scripts in plain English. No prior programming knowledge is required.
Q6: Does Frontlines Edutech provide placement assistance for the Excel course?
Yes. Frontlines Edutech provides resume building, LinkedIn profile optimisation, mock interviews, and placement updates as part of the course. Students have been placed at Infosys, TCS, Wipro, Accenture, Cognizant, and IBM.
Q7: What is the difference between Excel and Advanced Excel with AI?
Basic Excel covers data entry and simple formulas. Advanced Excel with AI includes PivotTables, XLOOKUP, VBA automation, Power Query, dashboard design, and ChatGPT integration skills that directly qualify you for analyst-level roles.
Published by Frontlines Edutech | blog.frontlinesedutech.com
For enrollments: +91-83330 77727 | support@frontlinesedutech.com
Continue Your Learning Journey with courses path pages