90-Day Power BI Course Roadmap: From Beginner to Job-Ready BI Analyst
Table of Contents
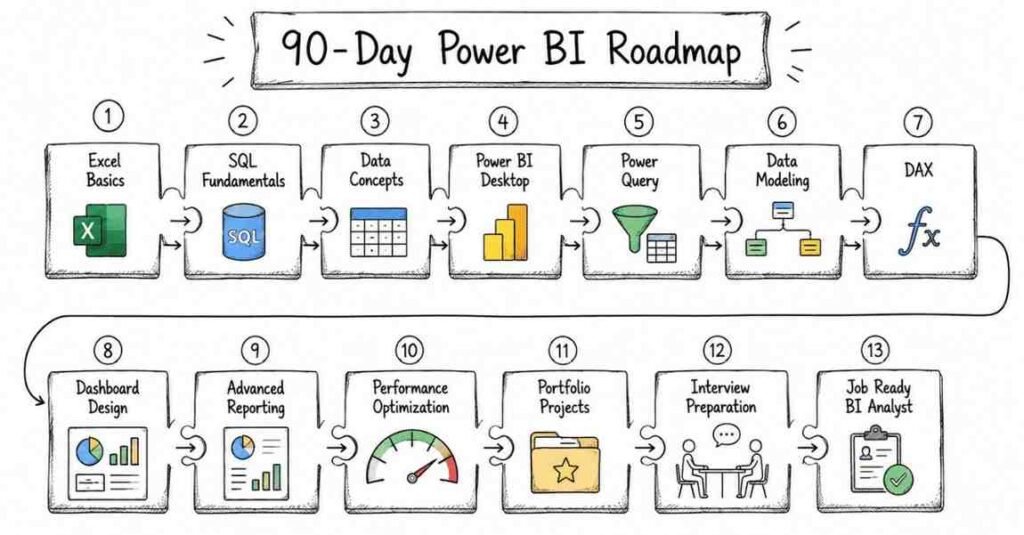
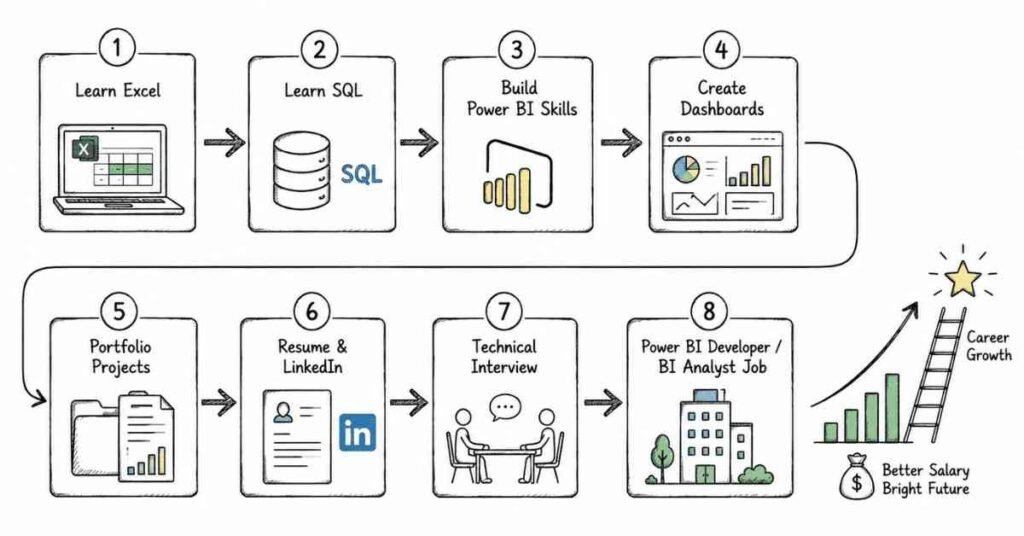
This 90-day Power BI roadmap is designed to take you from complete beginner to job-ready BI analyst with a practical, step-by-step plan. You will start with Excel, data basics, and SQL, then move into Power Query, data modeling, DAX, dashboards, reporting, and business analysis before finishing with projects and interview preparation. The goal is simple: help students in Hyderabad, Telangana, Andhra Pradesh, and across India learn the Power BI skills that employers actually ask for. Power BI roles are in demand because businesses need clear dashboards, faster decision-making, and data-driven reporting. By the end of 90 days, you should be ready for entry-level BI jobs with confidence and a solid portfolio.
Why Power BI Is a Smart Career Choice
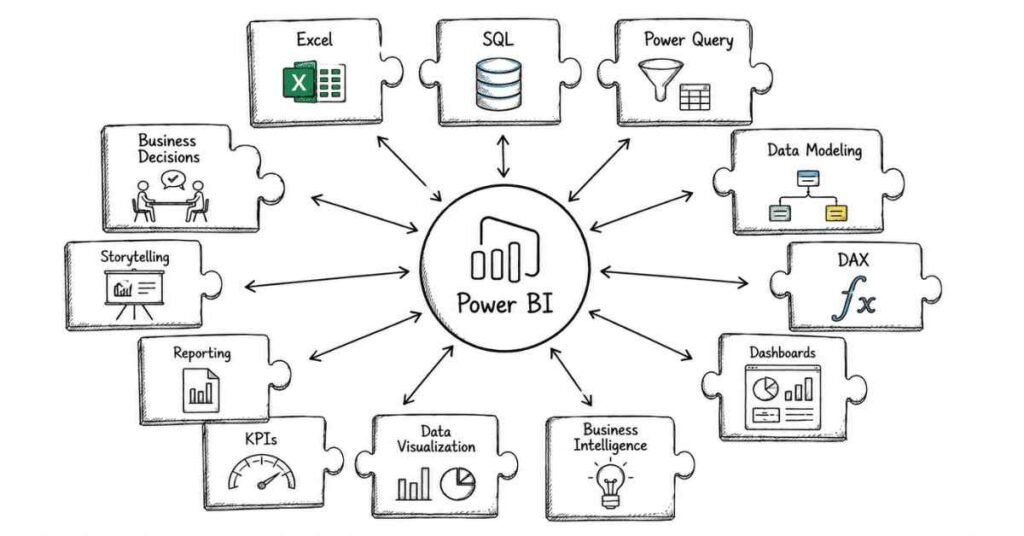
Power BI is one of the most practical careers in analytics because every business wants to understand its data better. Companies need professionals who can clean data, model it correctly, build dashboards, and present insights in a way that leaders can act on. That is why Power BI skills are useful across IT services, finance, retail, healthcare, manufacturing, e-commerce, and consulting.
This is also a field where practical knowledge matters more than memorizing theory. If you can transform raw data into reports and explain business insights clearly, you already have what many employers want. That is why this roadmap focuses on hands-on learning from the beginning.
- Power BI helps businesses make data-driven decisions.
- It is used across enterprise teams, startups, and consulting firms.
- Entry-level candidates can grow quickly with strong dashboard work.
- The skill set is useful for both freshers and working professionals.
- Power BI knowledge often leads to strong long-term career growth.
90-Day Learning Plan
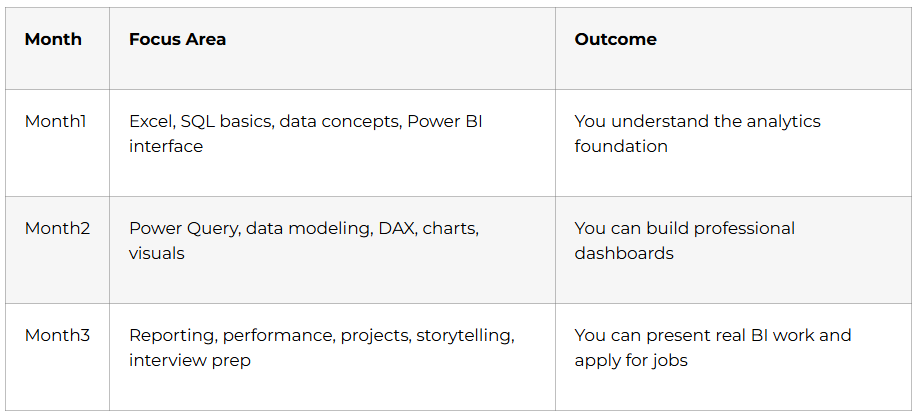
Month 1: Data and BI Foundations
Month 1 is all about building the base. If you skip the basics, the advanced dashboard work will feel confusing later. Excel, SQL, and data concepts are the everyday language of BI analysis, so this month gives you the confidence to work on real projects.
Want to Become a Power BI Analyst? Start Here
Week 1: Excel Basics for Analytics
Excel is still one of the most important tools for anyone entering Power BI. Learn formulas, functions, sorting, filtering, charts, and basic data cleaning. You should also understand why Excel is often used to inspect and prepare data before bringing it into Power BI.
- Learn the Excel interface and basic navigation.
- Practice formulas and common functions.
- Use sorting and filtering on data.
- Create simple charts and summaries.
- Clean messy data tables.
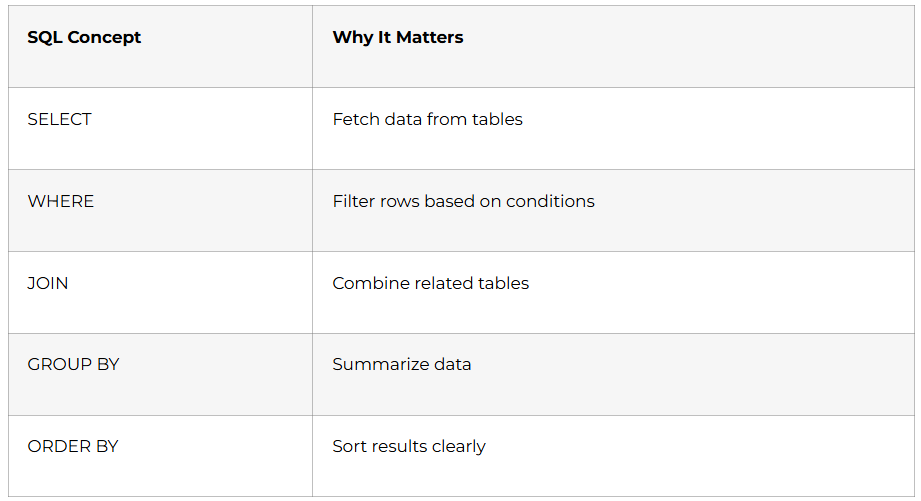
Week 2: SQL Basics
SQL helps you understand and retrieve data from databases. Learn SELECT, WHERE, GROUP BY, ORDER BY, and joins so you can work with structured data confidently. Even if Power BI does a lot of the visualization work, SQL remains a very useful skill in BI roles.
Week 3: Data Concepts and Power BI Introduction
Before creating dashboards, you need to understand data types, rows, columns, and relationships. Learn what Power BI is, how it fits into business intelligence, and how it connects to Excel, SQL, and other sources. This week should also introduce the Power BI desktop interface and core workflow.
- Learn data types and structures.
- Understand business intelligence basics.
- Explore Power BI Desktop.
- Practice importing sample data.
- Review the reporting workflow.
Week 4: Month 1 Review and Mini Project
By the end of Month 1, you should be able to open data, inspect it, clean it lightly, and explain the basics of BI. Use this week to revise key concepts and build a small project such as an Excel sales summary or a simple SQL report that can later be visualized in Power BI.
Month 2: Power BI Reporting Skills
Month 2 is where you begin to work like a real BI analyst. You move from raw data to transformation, modeling, and visualization. This is the stage where Power BI starts feeling like a practical job skill instead of a theory subject.
Week 5: Power Query
Power Query is one of the most useful tools in Power BI because it helps you clean and transform data before building reports. Learn how to remove errors, change data types, split columns, merge tables, and reshape messy datasets. Clean data leads to better dashboards.
- Learn Power Query basics.
- Change and fix data types.
- Remove duplicates and errors.
- Split, merge, and transform columns.
- Prepare data for reporting.
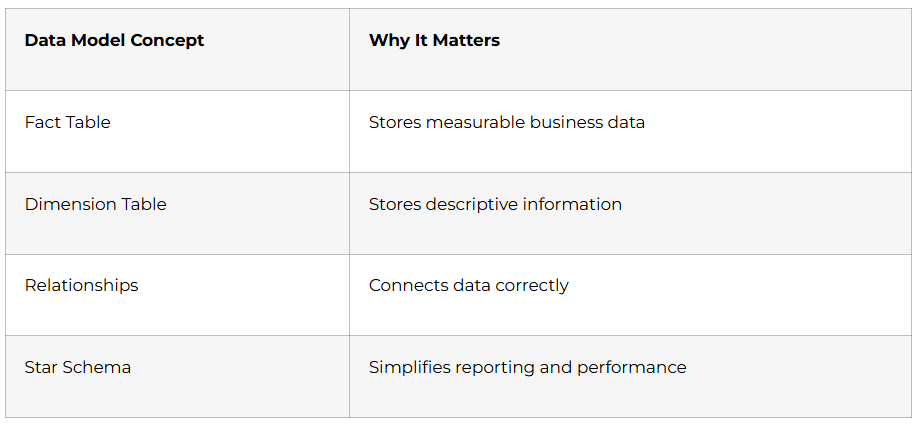
Week 6: Data Modeling
Good dashboards depend on good data models. Learn tables, relationships, star schema basics, and how fact and dimension tables work. If your model is weak, your report performance and calculations will suffer. This week is one of the most important steps in becoming a strong Power BI professional.
Week 7: DAX Basics
DAX is the formula language used in Power BI for calculations. Learn measures, calculated columns, SUM, COUNT, CALCULATE, and simple time-based ideas. DAX is important because most business dashboards need dynamic calculations, not just static charts.
- Learn what DAX is used for.
- Create simple measures.
- Understand calculated columns.
- Practice SUM and COUNT.
- Review filter context basics.
Week 8: Charts, Visuals, and Dashboard Design
Visual design matters because dashboards should be easy to read and easy to act on. Learn how to choose the right charts, use slicers, add filters, and arrange visuals clearly. A good dashboard does not just look attractive; it helps users understand the story behind the data.
Month 3: Business Reporting and Job Readiness
Month 3 focuses on making you job-ready. You will combine the tools you learned, practice reporting workflows, and prepare projects that you can show employers. A good Power BI portfolio proves that you can clean data, model it, and present insights, not just memorize terms.
Week 9: Advanced Visuals and Reporting
Now that you know the basics, it is time to create more meaningful reports. Learn drill-through, tooltips, KPI cards, page navigation, and report formatting. Also understand how to design reports for business users so they can answer real questions quickly.
- Learn advanced Power BI visuals.
- Practice report formatting and layout.
- Use slicers and filters smartly.
- Create KPI and summary views.
- Improve report readability.
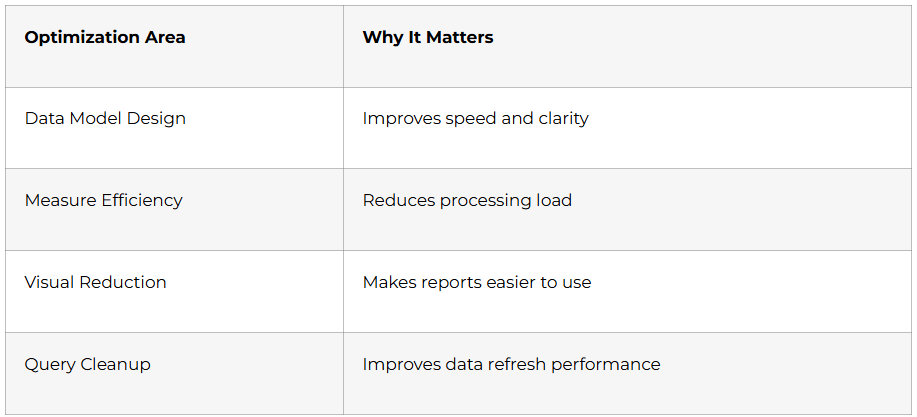
Week 10: Performance and Optimization
Large dashboards can become slow if they are not designed well. Learn how to improve report performance, reduce unnecessary calculations, and keep data models efficient. This week is important because companies want reports that are not just useful, but fast and reliable.
Week 11: Project Building
Use this week to create portfolio projects that prove your skills. Build a sales dashboard, a finance report, a HR analytics dashboard, or a business performance report using Excel or SQL data. Make sure each project includes business goals, key metrics, visuals, and a short explanation of your insights.
Week 12: Storytelling and Interview Prep
The final week should be used for resume building, LinkedIn optimization, portfolio updates, and interview practice. Focus on explaining your dashboards clearly, because interviewers often care more about your reasoning than your memorization. Be ready to explain what you found in the data and why your report matters for business decisions.
Prepare for Your Power BI Interviews with Confidence
Power BI Career Paths and Salary Guide
Why Choose Frontlines Edutech
Frontlines Edutech helps students learn practical, job-focused skills in a way that feels clear and achievable. The training is designed for beginners who want real analytics understanding, not just theory. Students also benefit from guided learning, interview support, and a roadmap that matches current industry needs.
- Hands-on learning with real projects.
- Beginner-friendly explanations for complex topics.
- Job-focused curriculum with practical outcomes.
- Support for resumes, interviews, and career preparation.
- Training aligned with Indian hiring expectations.
Frequently Asked Questions
Q1: Do I need coding experience to learn Power BI?
No, you do not need advanced coding experience to start. Basic computer knowledge is enough for the first month, and data handling is introduced gradually.
Q2: What is the salary for a Power BI fresher in India?
A Power BI fresher in India can typically expect around ₹3.5 to ₹6 LPA, depending on the role, company, and skill level. Candidates with dashboards and SQL skills can earn more.
Q3: Is Power BI a good career for beginners?
Yes, Power BI is a strong career option for beginners because every business needs reporting and insights. It offers good demand, structured roles, and clear growth paths.
Q4: What will I learn in this 90-day roadmap?
You will learn Excel, SQL, Power Query, data modeling, DAX, dashboard design, reporting, optimization, and interview preparation. You will also work on practical projects and portfolio building.
Q5: Can I get a job after learning Power BI in 90 days?
Yes, you can become job-ready in 90 days if you practice regularly and build projects. A strong portfolio and interview preparation are important for getting shortlisted.
Q6: Does Power BI use SQL heavily?
Yes, SQL is an important part of Power BI work. Analysts often use SQL to fetch, verify, and validate the data behind their reports.
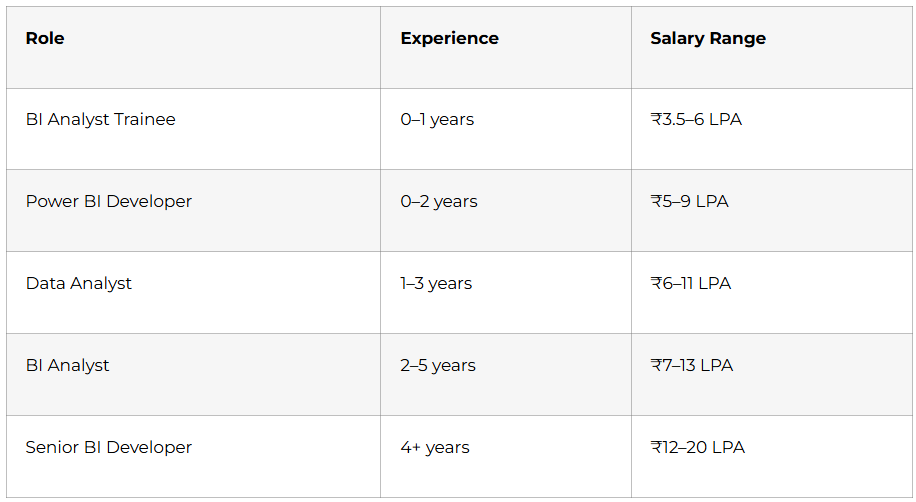
Q7: What kind of jobs can I apply for after this course?
You can apply for BI trainee, Power BI developer, and data analyst roles. With more experience, you can grow into BI analyst and senior reporting positions.
Q8: Is Power BI used in real companies?
Yes, Power BI is widely used by companies across finance, retail, IT, healthcare, and consulting to track performance and make decisions. That is what makes it such a practical career path.
Published by Frontlines Edutech | blog.frontlinesedutech.com
For enrollments: +91-83330 77727 | support@frontlinesedutech.com