
Data Analytics Interview Preparation Guide 2026
Table of Contents
Part 1: Introduction & 30-Day Study Plan
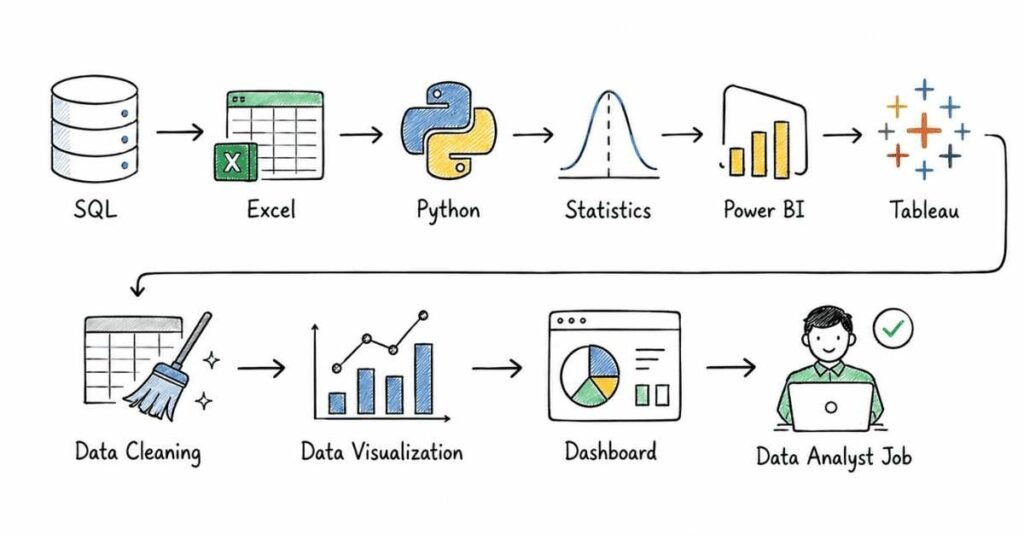
This first part sets up the full roadmap for data analytics interview preparation, including role clarity, core skills, interview stages, portfolio expectations, and a practical 30-day study plan. Current India salary sources place average data analyst pay around ₹6.5 lakh per year on Indeed and about ₹5.79 lakh on PayScale, with entry-level compensation reported around ₹4.13–5.15 lakh and higher city-based variation in places like Gurgaon and Bengaluru.
What this guide covers
This guide is designed to prepare you for data analytics interviews in a structured and progressive way. It will cover analytics fundamentals, business thinking, SQL, advanced SQL and databases, Excel, Python for analysis, statistics and A/B testing, data visualization and dashboards, case studies, portfolio presentation, and finally behavioral and career preparation.
It is meant for freshers, aspiring data analysts, business analysts moving into analytics, reporting professionals, and working candidates who want a more systematic interview plan. The goal is not only to help you answer technical questions, but also to explain your thinking clearly in business terms.
Who this guide is for
This guide is useful if you are:
- A fresher preparing for your first data analyst interview.
- A business analyst or reporting analyst moving into deeper analytics work.
- An Excel user trying to become stronger in SQL, Python, and dashboards.
- A working professional switching into analytics from operations, finance, marketing, or support.
- A candidate who knows tools but struggles with case studies, statistics, or interview structure.
The content starts from fundamentals and gradually moves toward practical analytics reasoning and interview-ready communication.
What data analytics is
Data analytics is the process of collecting, cleaning, transforming, exploring, and interpreting data to answer business questions and support decisions. In a company setting, analysts usually sit between raw data and business action: they help teams understand performance, diagnose problems, identify opportunities, and communicate what the numbers actually mean.
A strong interview answer should show that data analytics is not only about tools. It is about solving business problems with structured reasoning, accurate analysis, and clear communication.
Join the Data Analytics Course →
What data analysts actually do
Data analysts usually work on a mix of technical and business tasks:
- Writing SQL queries to extract and combine data.
- Cleaning and validating data in Excel, SQL, or Python.
- Building dashboards in Tableau or Power BI.
- Analyzing trends, funnels, cohorts, or performance metrics.
- Supporting experiments, reporting, and stakeholder decisions.
- Presenting findings in a way non-technical teams can use.
That is why most interviews test both technical skills and business interpretation. You may be asked to write a query, explain a metric drop, choose a chart, or discuss how you would validate suspicious data.
Roles in data analytics
Data analytics interviews vary because “analytics” can mean different things depending on the job. Common role types include:
- Data Analyst: general analysis, SQL, dashboards, reporting, insights.
- Business Analyst: business process and stakeholder focus, often with analytics overlap.
- Reporting Analyst: KPI reporting, dashboards, and recurring data delivery.
- Product Analyst: user behavior, funnels, experiments, and product metrics.
- Marketing Analyst: campaign performance, attribution, CAC, retention, and ROI.
- BI Analyst: reporting architecture, dashboarding, and data modeling support.
In interviews, one of the smartest things you can do is tailor your preparation to the role type. A product analyst role may emphasize experimentation and funnels, while a BI role may focus more on SQL, reporting logic, and dashboard quality.
Core skills interviewers usually check
Most data analytics interviews evaluate a combination of these skill areas:
- SQL for data extraction and transformation.
- Excel for quick analysis and reporting.
- Python or sometimes R for data cleaning and exploratory analysis.
- Statistics and probability for reasoning and experiments.
- Tableau or Power BI for visualization and dashboards.
- Business thinking for metrics, KPIs, and decision-making.
- Communication for presenting results clearly.
Recent interview-prep guides consistently emphasize SQL, statistics, case studies, and communication as central parts of data analyst interviews, rather than treating analytics as only a tooling exercise. That means interview success usually depends on both technical depth and interpretation skill.
Common interview process
A typical data analytics hiring process often includes several stages:
- Recruiter or HR screening.
- SQL or technical screening round.
- Excel, Python, or analytics exercise.
- Statistics or business reasoning round.
- Case study, dashboard review, or take-home assignment.
- Behavioral or hiring manager round.
Current interview-prep resources specifically call out SQL practice, technical skill checks, statistics, case studies, and behavioral preparation as standard components of the process. Not every company uses all stages, but SQL and business reasoning are especially common across roles.
Why SQL matters so much
SQL is often the single most important hard skill for data analyst interviews because it sits at the center of data extraction, filtering, aggregation, joins, and metric calculation. Even if a role uses dashboards heavily, companies still want analysts who can independently work with source data rather than depend entirely on prebuilt reports.
That is why this guide gives SQL two full parts: one for fundamentals and one for more advanced SQL and database concepts. For many candidates, SQL is the difference between “interested in analytics” and “interview-ready for analytics.”
Why business thinking matters
Many candidates know formulas, syntax, or chart types but struggle to explain why an analysis matters. Interviewers often care less about whether you can define a LEFT JOIN from memory and more about whether you can connect a query result to a business recommendation.
For example, if revenue drops, a good analyst does not stop at “sales decreased.” They ask:
- Which segment dropped?
- Is it traffic or conversion?
- Is this seasonal or unusual?
- Is the data reliable?
- What action should the team take next?
That business framing is what separates mechanical answering from strong analytics thinking.
Portfolio expectations
A portfolio is not always mandatory, but it is increasingly helpful for freshers and career switchers because it gives you something concrete to discuss. A useful analytics portfolio usually includes:
- 2–4 projects.
- Clean problem statements.
- Real or realistic datasets.
- Clear analysis steps.
- Visual outputs or dashboards.
- Business conclusions and limitations.
A weak portfolio only shows code or screenshots. A strong portfolio shows reasoning: what the question was, what data you used, what methods you applied, what you found, and why it matters.
Tools you should be comfortable with
For most entry-level and mid-level data analytics interviews, you do not need mastery of every tool. You do need working comfort with the most common ones:
- SQL.
- Excel.
- Python with pandas.
- Tableau or Power BI.
- Basic statistics.
- Presentation or storytelling skills.
Interview-prep guides for 2026 continue to frame SQL, Python, Excel, statistics, and dashboard tools as the practical core of analyst readiness. The exact stack varies by employer, but these are the most transferable foundations.
Salary expectations in India
Indeed reports an average data analyst salary in India of ₹6,50,741 per year, with entry-level analysts around ₹5,15,010 and senior data analysts around ₹11,30,130, while PayScale reports an average of ₹579,254 with entry-level compensation around ₹413,462. Indeed also reports higher-paying cities such as Gurgaon at about ₹8,43,911, Bengaluru at ₹7,87,663, and Noida at ₹7,52,998, showing that city and employer type meaningfully affect pay. Broader 2026 market guides place freshers around ₹3.5–5 LPA, mid-level analysts around ₹6–10 LPA, and senior analysts around ₹15–20+ LPA depending on skills and role scope.
For preparation purposes, a practical range is:
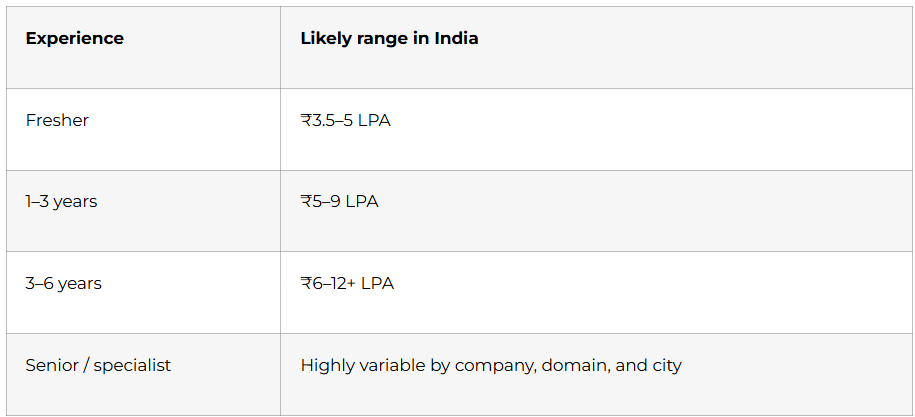
Use salary numbers as market context, not as a rigid promise. Analytics pay varies a lot based on SQL strength, domain knowledge, dashboarding skill, and whether the role leans toward BI, product, or advanced analytics.
30-day study plan
Explore the Data Analytics Roadmap →
Week 1: Analytics fundamentals and business thinking
Focus on what data analytics is, types of analytics, key business metrics, KPIs, data quality, and analyst responsibilities. Begin light SQL revision and practice explaining simple business scenarios out loud.
Week 2: SQL and database basics
Study SELECT, WHERE, GROUP BY, HAVING, JOINs, subqueries, CTEs, and common interview query patterns. This week should include daily hands-on SQL writing, not only reading solutions.
Week 3: Excel, Python, and statistics
Revise Excel formulas, lookups, pivot tables, filtering, and basic dashboards. Alongside that, practice pandas basics, data cleaning, descriptive statistics, hypothesis testing concepts, and simple probability.
Week 4: Visualization, case studies, portfolio, and mock interviews
Practice chart selection, dashboard storytelling, metric interpretation, and case-study thinking. Review your portfolio, refine your resume and LinkedIn, and do mock technical plus behavioral interviews.
Daily study routine
A simple daily structure works well:
- 45 minutes of concept revision.
- 60 minutes of hands-on practice, especially SQL or Python.
- 30 minutes of interview-style speaking practice.
- 15 minutes of portfolio, notes, or resume refinement.
If you are a fresher, spoken explanation practice is especially important. Many candidates can solve a problem, but fewer can explain their assumptions, trade-offs, and conclusions clearly under interview pressure.
How to think in data analytics interviews
A strong analytics answer usually follows this pattern:
- Clarify the business question.
- Identify the right data.
- Check data quality and assumptions.
- Choose the analysis method.
- Interpret the result.
- Recommend next actions.
For example, if asked why app engagement dropped, do not jump directly to conclusions. First clarify the metric, timeframe, user segment, tracking reliability, and whether there was a product or campaign change. That structured approach signals analyst thinking much more than a fast but shallow answer.
Part 2: Data Analytics Basics & Business Thinking — Questions 1–40
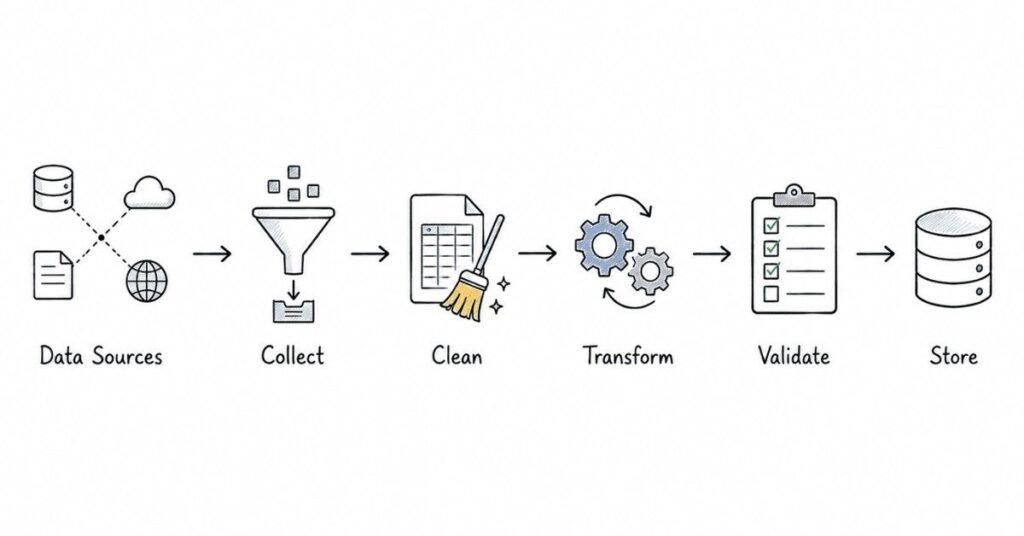
This part builds the business and analytical foundation for the rest of the guide. Modern analytics frameworks commonly divide analytics into descriptive, diagnostic, predictive, and prescriptive types, while widely used data-quality frameworks evaluate trustworthiness through dimensions such as accuracy, completeness, consistency, timeliness, uniqueness, and validity.
Questions 1–40
1) What is data analytics?
Data analytics is the process of examining data to answer questions, find patterns, support decisions, and improve outcomes. In interview terms, a strong answer connects analytics to business problem-solving, not just tools or dashboards.
2) Why do companies use data analytics?
Companies use data analytics to understand what is happening, why it is happening, what may happen next, and what action to take. These goals align closely with the four common categories of analytics: descriptive, diagnostic, predictive, and prescriptive.
3) What is the difference between data analytics and data analysis?
A practical interview answer is that data analysis usually refers to the specific act of examining data, while data analytics is broader and includes the full process of collecting, cleaning, analyzing, interpreting, and applying data to decisions. In many companies, though, the terms are used interchangeably.
4) What are the four main types of analytics?
The four commonly used types are descriptive, diagnostic, predictive, and prescriptive analytics. This framework is one of the most basic and most frequently asked conceptual topics in analytics interviews.
5) What is descriptive analytics?
Descriptive analytics focuses on understanding what happened in the past, such as sales last month, churn last quarter, or website traffic trends. It is usually the starting point for most business reporting and dashboarding.
6) What is diagnostic analytics?
Diagnostic analytics focuses on understanding why something happened, such as why revenue dropped or why churn rose. It often involves drill-downs, segmentation, comparisons, and root-cause analysis.
7) What is predictive analytics?
Predictive analytics focuses on what is likely to happen next by using patterns from past and current data. Common examples include forecasting sales, predicting churn, or estimating demand.
8) What is prescriptive analytics?
Prescriptive analytics focuses on what action should be taken, often by identifying the best possible response based on predictions and constraints. It is the most action-oriented of the four analytics types.
9) Are the four types of analytics always separate?
No, they often build on one another in practice: teams may first describe what happened, then diagnose why, then predict what could happen next, and finally recommend actions. A strong interview answer should show that these categories complement each other rather than function as isolated boxes.
10) What is an example of all four analytics types in one business scenario?
Example: Descriptive tells you sales fell 12% last month, diagnostic shows the drop came from repeat customers in one region, predictive estimates another decline next month, and prescriptive suggests targeting retention offers in that region. This is a useful structure in interviews because it shows both concept understanding and business application.
Data types and structures
11) What is structured data?
Structured data is data organized in a predefined format, usually in rows and columns, such as tables in relational databases or spreadsheets. It is the most common type of data used in SQL-based analytics.
12) What is unstructured data?
Unstructured data does not fit neatly into rows and columns and includes things like text, images, emails, audio, or documents. Analysts may still work with it, but it often requires different tools and preprocessing before analysis.
13) What is semi-structured data?
Semi-structured data has some organizational pattern but not a rigid relational schema, such as JSON or XML. It appears often in modern analytics workflows where event or API data is involved.
14) What is quantitative data?
Quantitative data is numerical data that can be measured or counted, such as revenue, number of users, or order value. It is the basis for most calculations, aggregations, and statistical analysis.
15) What is qualitative data?
Qualitative data describes qualities or categories rather than quantities, such as customer feedback themes, product categories, or satisfaction labels. It is often used for grouping, tagging, or interpreting behavior.
16) What is categorical data?
Categorical data represents labels or groups, such as region, plan type, gender, or payment method. It is often used in segmentation, grouping, and comparison tasks.
17) What is continuous data?
Continuous data can take any value within a range, such as time spent, temperature, revenue, or height. It is commonly used in statistical summaries and distributions.
18) What is discrete data?
Discrete data consists of countable values, such as number of orders, support tickets, or app installs. It often appears in dashboards, operational reports, and KPI tracking.
19) What is transactional data?
Transactional data records individual events or actions, such as purchases, clicks, logins, or support cases. Analysts often aggregate this type of data to identify trends and business patterns.
20) What is master data?
Master data refers to core business entities that remain relatively stable, such as customers, products, employees, or locations. Understanding the difference between master and transactional data helps analysts join tables correctly and avoid logic mistakes.
Inheritance
11) What is inheritance in Java?
Inheritance is the mechanism by which one class acquires the properties and behavior of another class. In Java, this is done using the extends keyword for classes.
12) Why is inheritance useful?
Inheritance reduces code duplication and helps create logical class hierarchies. It is useful when there is a clear “is-a” relationship between classes.
13) What is a superclass and a subclass?
A superclass, or parent class, is the class being inherited from, while a subclass, or child class, inherits from it. This relationship is central to understanding Java OOP hierarchies.
14) Does Java support multiple inheritance with classes?
No, Java does not allow one class to directly extend multiple classes. Java supports single inheritance for classes, though a class can implement multiple interfaces.
15) What is the extends keyword used for?
The extends keyword is used when one class inherits from another class. It creates the parent-child relationship used in inheritance.
Metrics, KPIs, and business context
21) What is a metric?
A metric is any measurable value used to track performance, behavior, or activity, such as daily active users, conversion rate, or average order value. Metrics are everywhere in analytics, but not all metrics are equally important.
22) What is a KPI?
A KPI, or Key Performance Indicator, is a metric that is directly tied to an important business objective. In other words, every KPI is a metric, but not every metric qualifies as a KPI.
23) What is the difference between a metric and a KPI?
A metric measures something, while a KPI measures something strategically important to the business goal. For example, page views may be a metric, while conversion rate or customer retention may be a KPI depending on the business objective.
24) Why is the KPI vs metric distinction important in interviews?
Interviewers ask this because strong analysts do not just calculate numbers; they prioritize the numbers that matter for decisions. A good answer shows you understand business relevance, not only reporting mechanics.
25) What are leading and lagging indicators?
Leading indicators tend to move before a business outcome and can signal future performance, while lagging indicators reflect results after the fact, such as revenue or churn after a period ends. Strong analysts often monitor both because one helps anticipate and the other confirms outcomes.
26) What is a business objective?
A business objective is the broader goal the company wants to achieve, such as increasing revenue, improving retention, reducing cost, or growing activation. Metrics and KPIs should always be connected back to a business objective.
27) Why should analysts understand business context?
Because the same number can mean different things depending on the business model, customer segment, seasonality, or strategy. Analysts who ignore business context often produce technically correct but practically useless analysis.
28) What is a baseline in analytics?
A baseline is the reference point used for comparison, such as last week, last month, the previous quarter, or a control group. Without a baseline, it is hard to decide whether performance is strong, weak, or unchanged.
29) What is benchmarking?
Benchmarking means comparing performance against a standard, such as industry averages, historical performance, or internal targets. It helps interpret whether a result is actually good or bad rather than just numerically large or small.
30) What is segmentation in analytics?
Segmentation means breaking data into meaningful groups, such as by geography, user type, device, channel, or plan. This is a core diagnostic technique because overall averages can hide important differences across segments.
Data quality and analyst responsibilities
31) What is data quality?
Data quality refers to how trustworthy, accurate, and usable data is for a specific purpose. Interviewers care about this because even advanced analysis becomes unreliable if the underlying data is poor.
32) What are the six common data quality dimensions?
Widely used frameworks identify six core dimensions: accuracy, completeness, consistency, timeliness, uniqueness, and validity. These dimensions are commonly used to assess whether data is fit for business use.
33) What is accuracy in data quality?
Accuracy means data values are as close as possible to the real-world truth they represent. For example, if a customer’s address or revenue value is wrong, the data lacks accuracy.
34) What is completeness in data quality?
Completeness means all required values are present and not missing where they are needed. Missing order amounts, blank customer IDs, or incomplete dates are common completeness issues.
35) What is consistency in data quality?
Consistency means data agrees across records, systems, or formats and does not conflict with itself. For example, a customer marked inactive in one system but active in another is a consistency problem.
36) What is timeliness in data quality?
Timeliness means data is available and up to date when it is needed. A dashboard that updates too late for decision-making may contain technically correct but operationally poor-quality data.
37) What is uniqueness in data quality?
Uniqueness means each entity should appear only once when duplicates are not expected. Duplicate customer, transaction, or product records can distort aggregates and lead to incorrect insights.
38) What is validity in data quality?
Validity means data conforms to expected type, format, range, or business rules. A date stored in the wrong format or an impossible age value is a classic validity problem.
39) What should an analyst do before starting analysis?
Before analysis, an analyst should clarify the question, identify the correct data source, check definitions, validate the data, look for missing or duplicated records, and confirm the timeframe and filters. This kind of answer is strong in interviews because it shows disciplined thinking rather than rushing into charts or SQL.
40) What is the role of an analyst in decision-making?
An analyst’s role is to convert raw data into trustworthy, relevant, and understandable insights that help stakeholders make better decisions. The best interview answer emphasizes that analysts support decisions through clarity, evidence, and business context, not just by producing reports.
Revision focus
For this part, revise the four analytics types, the difference between metrics and KPIs, common data types, segmentation, baseline thinking, and the six data-quality dimensions. These topics matter because they form the language of analytics interviews and shape how you answer later SQL, case-study, and business questions.
Part 3: SQL Fundamentals — Questions 41–80
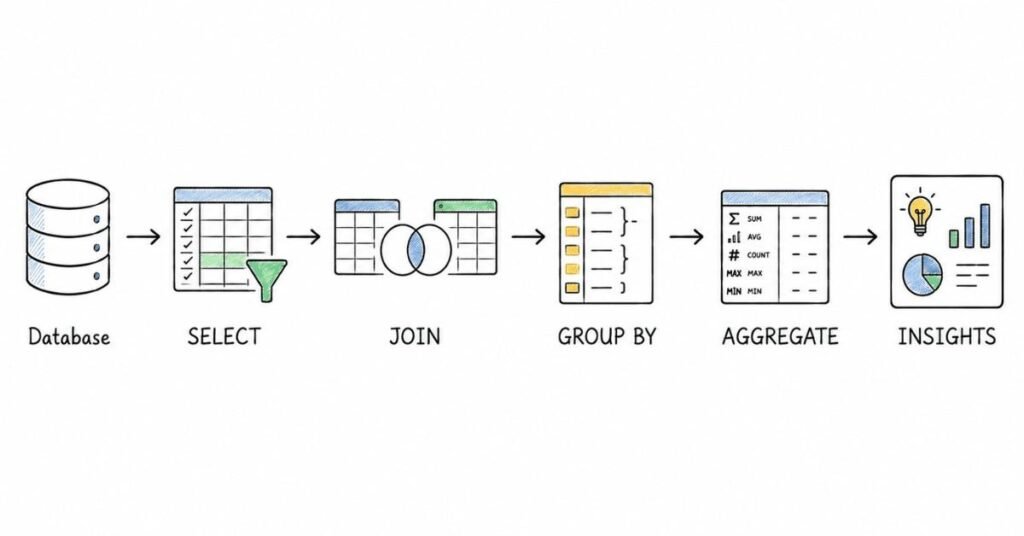
This part covers the SQL foundation that shows up in almost every data analytics interview. Core SQL learning resources consistently emphasize SELECT, WHERE, GROUP BY, HAVING, ORDER BY, joins, subqueries, and CTEs as the essential building blocks, and standard references define HAVING specifically as the clause used to filter grouped results after aggregation rather than filtering individual rows before grouping.
Questions 41–80
41) What is SQL?
SQL, or Structured Query Language, is the standard language used to query, filter, transform, and manage data stored in relational databases. For analysts, it is the main tool for extracting data and answering business questions directly from source tables.
42) Why is SQL so important for data analyst interviews?
SQL is important because analysts use it for filtering records, combining tables, calculating metrics, and validating business logic. In most interviews, SQL is treated as a practical working skill, not just a theoretical topic.
43) What does a basic SQL query look like?
A basic query usually follows this structure: SELECT columns FROM table WHERE condition. This is the simplest pattern for retrieving only the data you need from a table.
44) What does SELECT do?
SELECT specifies which columns or expressions you want returned in the result set. It is the starting point of almost every SQL query.
45) What does FROM do?
FROM identifies the table or source from which the query should retrieve data. Without FROM, the database does not know where the selected columns are coming from.
46) What does WHERE do?
WHERE filters rows before grouping or aggregation happens, so it is used to limit the dataset based on row-level conditions. This is one of the most important clause-order concepts in SQL interviews.
47) What is the difference between WHERE and HAVING?
WHERE filters individual rows before grouping, while HAVING filters grouped results after aggregation has been performed. This distinction is one of the most frequently tested SQL interview concepts.
48) What does ORDER BY do?
ORDER BY sorts the final result set in ascending or descending order. It is usually applied at the end of the query after selection, filtering, and grouping.
49) What does LIMIT do?
LIMIT restricts the number of rows returned in the result. It is commonly used in analysis and debugging when you want to preview a subset of data quickly.
50) What is the purpose of aliases in SQL?
Aliases rename columns or tables temporarily using AS, making queries shorter and easier to read. They are especially useful in joins, calculated fields, and grouped results.
Filtering and conditions
51) What operators are commonly used in WHERE clauses?
Common operators include =, !=, >, <, >=, <=, IN, BETWEEN, LIKE, IS NULL, and logical operators such as AND, OR, and NOT. These operators help define row-level conditions in a precise way.
52) What does IN do in SQL?
IN checks whether a value matches any value in a list or subquery result. It is useful when filtering against multiple allowed values instead of writing many OR conditions.
53) What does BETWEEN do?
BETWEEN filters values within a specified inclusive range, such as dates, prices, or scores. It is often used for time-based analysis.
54) What does LIKE do?
LIKE is used for pattern matching in text fields, often with wildcards such as % and _. It is commonly used when searching for names, email domains, or partial strings.
55) How do you filter NULL values in SQL?
You use IS NULL or IS NOT NULL, not = NULL, because NULL represents missing or unknown values rather than a normal comparable value. This is a small but very common interview trap.
56) What does DISTINCT do?
DISTINCT removes duplicate rows from the result set based on the selected columns. It is useful when you want unique values, such as unique customers, cities, or product categories.
Aggregation and grouping
57) What are aggregate functions in SQL?
Aggregate functions summarize multiple rows into one result, such as COUNT(), SUM(), AVG(), MIN(), and MAX(). Analysts use them constantly for KPIs and grouped metrics.
58) What does COUNT(*) do?
COUNT(*) returns the total number of rows in the result set, including rows with NULL values in individual columns. It is often used to count transactions, users, or records.
59) What is the difference between COUNT(*) and COUNT(column)?
COUNT(*) counts all rows, while COUNT(column) counts only rows where that specific column is not NULL. This difference matters in data-quality checks and KPI logic.
60) What does GROUP BY do?
GROUP BY groups rows that share the same values into summary rows, usually so aggregate functions can be applied to each group. It is the standard way to calculate totals, averages, or counts by category.
61) When do you use GROUP BY?
You use GROUP BY when you want summarized output by one or more dimensions, such as sales by month, orders by city, or users by device type. It turns row-level data into grouped business summaries.
62) What is a common mistake with GROUP BY?
A common mistake is selecting columns that are neither aggregated nor included in the GROUP BY clause. This causes errors in most SQL systems because the database cannot determine which row-level value to return for those columns.
63) What does HAVING do?
HAVING filters grouped data after aggregation has been performed, unlike WHERE, which filters rows before grouping. For example, you would use HAVING COUNT(*) > 5 to keep only groups with more than five rows.
64) Can you use WHERE and HAVING together?
Yes, and this is very common: WHERE filters the raw rows first, then GROUP BY groups them, and HAVING filters the aggregated groups afterward. A strong interview answer often includes that exact order.
65) What is the logical order of execution in a SQL query?
A practical interview-friendly order is: FROM → WHERE → GROUP BY → HAVING → SELECT → ORDER BY → LIMIT. This order explains why you cannot filter aggregates in WHERE and why aliases sometimes are not available everywhere in the query.
Joins
66) What is a join in SQL?
A join combines rows from two or more tables based on a related column, usually a key such as customer_id or order_id. Joins are essential because real business data is usually spread across multiple tables.
67) What is an INNER JOIN?
INNER JOIN returns only rows where matching values exist in both tables. This is the most common join used in analytics.
68) What is a LEFT JOIN?
LEFT JOIN returns all rows from the left table and matching rows from the right table, with NULLs for unmatched rows on the right. It is useful for identifying missing matches, such as customers with no orders.
69) What is a RIGHT JOIN?
RIGHT JOIN returns all rows from the right table and matching rows from the left table, with NULLs where no left-side match exists. In practice, many analysts avoid it and rewrite the query as a LEFT JOIN for readability.
70) What is a FULL JOIN?
FULL JOIN returns all rows from both tables, matching where possible and using NULLs for non-matching sides. It is useful when you want to compare coverage across two datasets.
71) What is the difference between INNER JOIN and LEFT JOIN?
INNER JOIN keeps only matched rows, while LEFT JOIN keeps all rows from the left table whether a match exists or not. Interviewers ask this often because it affects row counts and business conclusions.
72) What happens if a join key has duplicates in one or both tables?
The join can produce more rows than expected because matching duplicates multiply across tables. This is a very common reason for inflated metrics in analytics work.
73) Why do analysts often get wrong answers from joins?
Common reasons include using the wrong join type, joining on the wrong key, ignoring duplicates, or misunderstanding granularity. A strong analyst always checks row counts and business logic after joining.
74) What is granularity in SQL analysis?
Granularity refers to the level of detail in a dataset, such as one row per order, one row per customer, or one row per session. Join mistakes often happen when two tables have different granularities.
75) What is a self join?
A self join joins a table to itself, usually with aliases, to compare rows within the same table. It can be used for hierarchical relationships, duplicate detection, or comparing records across time.
Subqueries, CTEs, and set operations
76) What is a subquery?
A subquery is a query inside another query, usually enclosed in parentheses, and is often used to simplify more complex logic or filter based on another result set. It is useful when one query depends on the result of another.
77) What is a CTE?
A CTE, or Common Table Expression, is a temporary named result set created using WITH that can be used in the main query. CTEs are especially helpful for readability and for reusing intermediate logic in the same query.
78) What is the difference between a subquery and a CTE?
A subquery is embedded directly inside another query and may be harder to read when logic becomes complex, while a CTE gives that intermediate result a name and usually makes the query easier to understand. A strong interview answer also mentions that CTEs are often preferred for readability.
79) What are set operations in SQL?
Set operations combine the results of multiple queries, and common ones include UNION, UNION ALL, INTERSECT, and EXCEPT. They require the queries to return the same number and compatible types of columns.
80) What is the difference between UNION and UNION ALL?
UNION removes duplicate rows, while UNION ALL keeps all rows including duplicates. In interviews, a good answer also notes that UNION ALL is often faster because it skips duplicate elimination.
Revision focus
For this part, revise SELECT, WHERE, ORDER BY, GROUP BY, HAVING, joins, subqueries, CTEs, and UNION versus UNION ALL. The most important interview concepts here are clause purpose, join behavior, grouped filtering, and logical execution order, because these explain many common SQL mistakes before you even start solving harder query problems.
Part 4: Advanced SQL & Database Concepts — Questions 81–120
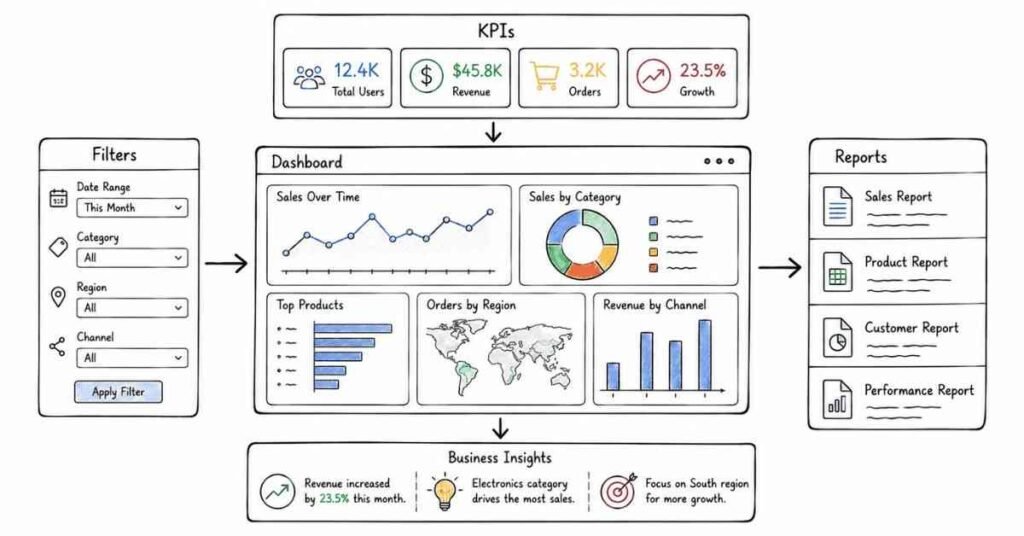
This part covers the SQL and database topics that usually separate beginner-level query writing from stronger interview performance. Advanced SQL interview prep resources consistently emphasize window functions such as ROW_NUMBER(), RANK(), DENSE_RANK(), LAG(), and LEAD(), while database fundamentals continue to center on keys, normalization, NULL handling, and indexing for performance.
Questions 81–120
81) What is a window function in SQL?
A window function performs calculations across a set of related rows while still returning individual rows rather than collapsing them into one grouped result. This is what makes window functions different from standard aggregate functions like SUM() or AVG() used with GROUP BY.
82) Why are window functions important in analytics interviews?
They are important because many real business questions involve ranking, running totals, row comparisons, and top-N analysis without losing row-level detail. Interviewers use them to test whether you can solve more realistic analytics problems than simple grouping queries.
83) What is the OVER() clause?
The OVER() clause defines the window over which a window function operates, often using PARTITION BY and ORDER BY. Without OVER(), functions like ROW_NUMBER() or LAG() cannot define how rows should be grouped or ordered for calculation.
84) What does PARTITION BY do in a window function?
PARTITION BY divides the result set into logical groups so the window function restarts within each group, such as by department, customer, or month. This is essential for tasks like ranking employees within each department rather than across the whole company.
85) What does ORDER BY do inside a window function?
ORDER BY determines the sequence of rows within each partition for ranking, running totals, or previous/next comparisons. Without a clear order, many window functions would not have a meaningful result.
86) What does ROW_NUMBER() do?
ROW_NUMBER() assigns a unique sequential number to each row within its window or partition, even if values are tied. It is commonly used for deduplication, top-N filtering, and pagination.
87) What does RANK() do?
RANK() assigns the same rank to tied values and then skips subsequent rank numbers after the tie. For example, if two rows are tied for rank 2, the next row gets rank 4, not 3.
88) What does DENSE_RANK() do?
DENSE_RANK() also gives the same rank to tied values, but it does not skip rank numbers after ties. If two rows are tied for rank 2, the next row gets rank 3 rather than 4.
89) What is the difference between ROW_NUMBER(), RANK(), and DENSE_RANK()?
ROW_NUMBER() always gives unique sequential numbers, RANK() gives ties the same rank but leaves gaps afterward, and DENSE_RANK() gives ties the same rank without gaps. This is one of the most frequently asked advanced SQL interview comparisons.
90) When should you use ROW_NUMBER() instead of RANK()?
Use ROW_NUMBER() when you need exactly one row per position even if values tie, such as selecting one latest record per customer or deduplicating based on timestamp. Use RANK() when you want ties to remain visible in the result.
91) What does LAG() do?
LAG() returns the value from a previous row within the same ordered window, making it useful for comparisons across time or sequence. Analysts often use it to compare current sales with previous sales or current month with previous month.
92) What does LEAD() do?
LEAD() returns the value from a following row within the same ordered window, which helps compare a current row to the next row in sequence. It is useful for forward-looking comparisons such as checking the next event or next period’s value.
93) What kinds of problems are LAG() and LEAD() good for?
They are good for month-over-month changes, detecting gaps in dates, comparing current and previous transactions, and identifying changes from one event to the next. Interviewers often use them in questions about trends or sequential user behavior.
94) Can aggregate functions be used as window functions?
Yes, functions like SUM(), AVG(), and COUNT() can be used as window functions with OVER() to compute running totals, moving averages, or per-group summaries without collapsing rows. This is a common advanced SQL pattern in analytics.
95) What is a running total in SQL?
A running total is a cumulative sum calculated row by row over an ordered sequence, often by date or transaction order. It is commonly built using SUM(column) OVER (PARTITION BY … ORDER BY …).
Conditional logic and advanced query design
96) What does CASE WHEN do in SQL?
CASE WHEN adds conditional logic inside a query, allowing you to create categories, flags, or calculated values based on rules. It is one of the most useful tools for turning raw values into business-friendly output.
97) Why is CASE WHEN important in interviews?
It is important because many real business problems require custom logic such as bucketing customers, flagging high-value orders, classifying churn risk, or handling special exceptions. Interviewers use it to test whether you can translate business rules into SQL.
98) What is conditional aggregation?
Conditional aggregation means using CASE WHEN inside aggregate functions like SUM() or COUNT() to calculate category-specific metrics in a single query. For example, you can count active and inactive users side by side without writing separate queries.
99) What is a common use of CASE WHEN with aggregation?
A common use is SUM(CASE WHEN condition THEN value ELSE 0 END) to measure totals only for rows that meet a condition. This is a high-frequency pattern in analytics interviews for metrics like paid revenue, successful orders, or retained users.
100) What is a correlated subquery?
A correlated subquery depends on values from the outer query and runs in relation to each row of the outer query. It can solve some problems elegantly, but it may be slower or harder to read than alternatives like joins or window functions.
Keys and relational design
101) What is a primary key?
A primary key uniquely identifies each row in a table and cannot be NULL. It is the main identifier used to distinguish records such as customer_id, order_id, or employee_id.
102) What is a foreign key?
A foreign key is a column that refers to a primary key in another table, creating a relationship between the two tables. It is how relational databases connect orders to customers, events to users, or transactions to products.
103) Why are keys important in analytics?
Keys are important because joins, relationships, deduplication, and grain validation all depend on them. Many SQL errors come from not understanding which field uniquely identifies a record.
104) What is normalization?
Normalization is the process of organizing relational data into separate tables to reduce redundancy and improve consistency. It is a core database design concept and often comes up in interviews as a way to discuss clean schema design.
105) What is denormalization?
Denormalization intentionally combines or duplicates data to make querying faster or simpler, especially for reporting and analytics use cases. It trades some storage efficiency for easier or faster read performance.
106) What is the difference between normalization and denormalization?
Normalization reduces duplication and improves integrity, while denormalization increases convenience or query speed by storing more data together. Interviewers often ask this to test whether you understand the design trade-off between clean modeling and practical analytics access.
107) What is first normal form in simple terms?
A simple answer is that first normal form means table values should be atomic, with no repeating groups or multi-valued cells in a single column. In interviews, it is usually enough to show you understand that a relational table should have one value per cell.
108) Why do analysts need some database design knowledge?
Because understanding keys, table relationships, and grain helps analysts write correct joins and avoid duplicated or missing results. Even if analysts do not design schemas themselves, they regularly depend on schema quality.
Indexes and performance basics
109) What is an index in a database?
An index is a database structure that helps speed up data retrieval for certain queries by making lookups more efficient. It is one of the most basic performance concepts in SQL and database interviews.
110) Why do indexes matter in analytics?
Indexes matter because filtering, joining, and searching large tables can become much faster when the database can use indexed columns efficiently. A basic awareness of indexing shows that you understand query performance, not just query correctness.
111) Are indexes always good?
No, indexes improve read performance for many queries but also take storage and can slow inserts, updates, or deletes because the index must be maintained. A strong answer mentions this trade-off rather than treating indexing as free performance.
112) What kinds of columns are often good index candidates?
Columns frequently used in joins, filters, or sorting, such as IDs, dates, or commonly filtered business keys, are often good candidates. In interviews, it is enough to say indexes are most helpful on columns that queries use repeatedly.
113) What is an execution plan in SQL?
An execution plan describes how the database intends to run a query, including operations like scans, joins, sorts, and index use. It helps diagnose why a query is slow even when the SQL logic is correct.
114) Why is query optimization important?
Query optimization matters because a correct query that runs too slowly on large production data can still be unusable. Interviewers like candidates who can think about both correctness and efficiency.
115) What are some basic ways to optimize a SQL query?
Common basics include filtering early, selecting only needed columns instead of SELECT *, joining on correct keys, using indexes appropriately, avoiding unnecessary subqueries, and checking execution plans. This kind of answer is usually enough for analyst interviews.
NULL handling and edge cases
116) Why is NULL handling important in SQL interviews?
NULLs often create hidden errors in counts, averages, joins, and conditional logic, so interviewers use them to test careful thinking. Candidates who ignore NULL behavior often get technically wrong answers from otherwise good queries.
117) What does COALESCE() do?
COALESCE() returns the first non-NULL value from a list of expressions and is often used to replace NULLs with defaults such as 0, ‘Unknown’, or fallback columns. It is one of the most practical SQL functions for analytics work.
118) How can NULL values affect aggregate functions?
Functions like AVG(column) and COUNT(column) ignore NULL values, while COUNT(*) counts all rows. This difference can change KPI calculations if missing data is not handled carefully.
119) What is a common NULL-related join issue?
A common issue is assuming unmatched rows will behave like normal values when in fact a LEFT JOIN may produce NULLs on the right side, affecting filters, counts, and CASE logic. This is why analysts should inspect joined outputs carefully before aggregating.
120) What is a strong answer if asked how to solve harder SQL interview questions?
A strong answer is: first identify the table grain, then clarify the metric, think through joins and filters, decide whether grouping or window functions are needed, handle NULLs carefully, and only then write the query. Interviewers often value this structured problem-solving approach as much as the final syntax.
Revision focus
For this part, revise window functions, especially ROW_NUMBER(), RANK(), DENSE_RANK(), LAG(), and LEAD(), along with CASE WHEN, conditional aggregation, keys, normalization, indexing, and NULL handling. These topics matter because they show whether you can solve realistic analytics problems, reason about data structure, and write SQL that is not just correct but also robust and scalable.
Part 5: Excel & Spreadsheet Analysis — Questions 121–160
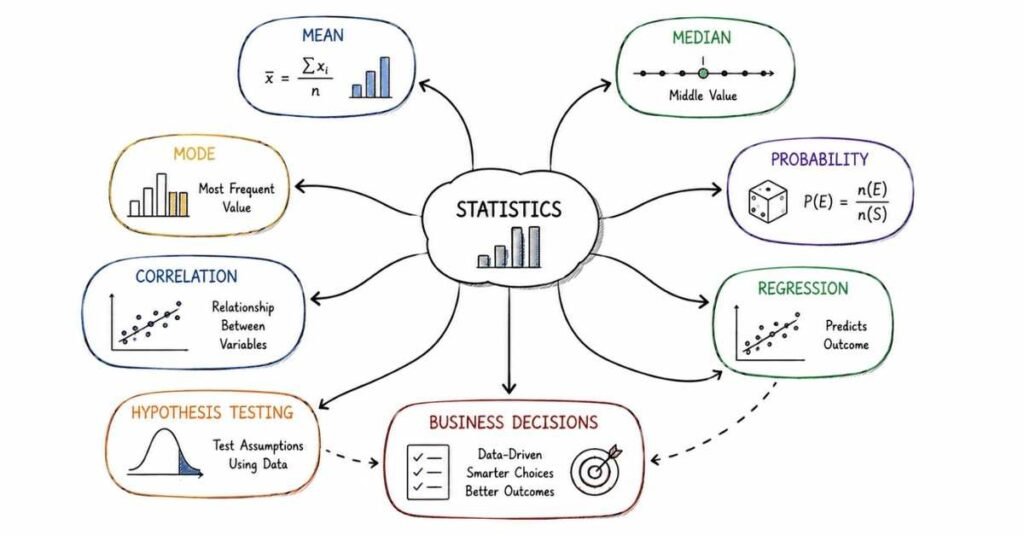
This part covers Excel topics that appear frequently in data analytics interviews, especially for analyst, reporting, operations, and business roles. Common Excel-focused prep material emphasizes pivot tables, lookup functions such as VLOOKUP, XLOOKUP, INDEX and MATCH, conditional formatting, and practical data-cleaning tools like Text to Columns, Remove Duplicates, and Data Validation.
Explore Data Analytics Career Guide→
Questions 121–160
121) Why is Excel still important in data analytics interviews?
Excel remains important because many companies still use it for ad hoc analysis, reporting, quick validation, reconciliations, and stakeholder-facing summaries. Even when SQL and Python are available, Excel is often the fastest tool for small to medium analysis tasks.
122) What kinds of Excel skills do interviewers usually test?
Interviewers commonly test formulas, lookups, pivot tables, data cleaning, filtering, sorting, dashboards, and error handling. They usually care less about memorizing every function and more about whether you can solve practical business problems efficiently.
123) What is a cell reference in Excel?
A cell reference points to a specific cell, such as A1 or C5, so formulas know where to pull values from. Understanding references is one of the most basic Excel foundations.
124) What is the difference between relative and absolute references?
A relative reference changes when copied to another cell, while an absolute reference stays fixed using dollar signs like $A$1. This is important when copying formulas across rows or columns without breaking the logic.
125) Why are absolute references useful in analysis?
They are useful when a formula should always refer to the same lookup range, tax rate, threshold, or parameter cell. Many Excel mistakes come from forgetting to lock references when copying formulas.
Core formulas
126) What does SUM() do?
SUM() adds numbers across selected cells or ranges. It is one of the most basic and most frequently used formulas in Excel.
127) What does AVERAGE() do?
AVERAGE() returns the arithmetic mean of a range of numbers. Analysts use it frequently for quick summaries such as average order value or average handling time.
128) What does COUNT() do?
COUNT() counts cells containing numeric values. It is different from COUNTA(), which counts non-empty cells of any type.
129) What does COUNTA() do?
COUNTA() counts all non-empty cells, including text, numbers, and dates. It is useful when checking completeness or how many entries exist in a dataset.
130) What does IF() do?
IF() applies conditional logic by returning one value if a condition is true and another if it is false. It is one of the most important functions for classification and rule-based reporting.
131) What does SUMIF() do?
SUMIF() adds values that meet one criterion, such as summing sales only for one region or one product. It is often used in interview tasks involving filtered totals.
132) What does SUMIFS() do?
SUMIFS() adds values based on multiple criteria, such as summing revenue for one city and one month together. This is one of the most practical business-analysis formulas in Excel.
133) What does COUNTIF() do?
COUNTIF() counts how many cells meet one condition. For example, it can count how many orders were delayed or how many customers belong to one segment.
134) What does COUNTIFS() do?
COUNTIFS() counts cells or rows meeting multiple conditions, such as users from one city and one device type together. It is commonly used in business reports and interview exercises.
135) What does IFERROR() do?
IFERROR() returns a fallback value when a formula produces an error, such as #N/A or #DIV/0!. It is useful for making reports cleaner and more user-friendly.
Lookup functions
136) What is VLOOKUP()?
VLOOKUP() searches for a value in the first column of a range and returns a value from another column in the same row. It is one of the most widely known Excel lookup functions.
137) What are the limitations of VLOOKUP()?
VLOOKUP() only searches from left to right, can break if columns are inserted, and is less flexible than newer lookup methods. That is why many analysts now prefer XLOOKUP or INDEX-MATCH when available.
138) What is XLOOKUP()?
XLOOKUP() is a more flexible and powerful lookup function than VLOOKUP(), and it can search both vertically and horizontally. It also supports built-in handling for missing matches and more flexible search behavior.
139) Why is XLOOKUP() often preferred over VLOOKUP()?
It is often preferred because it does not require the lookup column to be first, is easier to read, and is generally more robust when worksheet structure changes. In interviews, that is usually enough as a practical answer.
140) What are INDEX() and MATCH()?
INDEX() returns a value from a specified row and column in a range, while MATCH() returns the position of a value within a range. Together they create a flexible lookup combination.
141) Why do people use INDEX-MATCH instead of VLOOKUP()?
INDEX-MATCH is more flexible because it can look in any direction and is less fragile when columns are moved or inserted. It is also a good way to show deeper Excel understanding in interviews.
142) What is a good interview answer if asked which lookup function you prefer?
A strong answer is: “I prefer XLOOKUP where available because it is cleaner and more flexible; otherwise I use INDEX-MATCH for robustness, and I still understand VLOOKUP because many companies use older files.” That answer shows both practical awareness and adaptability.
Pivot tables and summary analysis
143) What is a pivot table?
A pivot table is an Excel feature used to summarize and reorganize large datasets quickly without writing formulas. It is one of the most important Excel features for data analysts and reporting roles.
144) Why are pivot tables useful?
Pivot tables let you summarize data by category, filter information, and quickly explore trends such as sales by month, revenue by region, or count of tickets by status. They are ideal for fast business analysis and reporting.
145) What is the difference between summarizing and analyzing in a pivot table?
A pivot table can summarize data using totals, averages, or counts, but analysis means interpreting those summaries to derive insights. For example, total sales by product is summarization, while explaining why one product underperformed is analysis.
146) What is a pivot chart?
A pivot chart is a chart linked to a pivot table that updates as the pivot table changes. It is useful for making summary analysis more visual and interactive.
147) What are slicers in Excel?
Slicers are visual filter controls that let users filter pivot tables and pivot charts more interactively. They are often used in dashboards because they make reports easier for non-technical users to explore.
148) When should you use a pivot table instead of formulas?
Use a pivot table when you need fast summarization across many dimensions and may want to explore data interactively. Use formulas when you need custom logic, tightly controlled layouts, or a more permanent reporting structure.
Data cleaning and preparation
149) Why is data cleaning important in Excel?
Data cleaning is important because raw spreadsheet data often contains duplicates, inconsistent formatting, extra spaces, split text issues, and invalid entries that can break analysis. Excel interview tasks often test this directly because clean data is required before reliable reporting.
150) What is Text to Columns?
Text to Columns is an Excel feature used to split one cell’s content into multiple columns based on delimiters like commas, spaces, or tabs. It is commonly used when names, dates, or codes are combined in one field.
151) What is Remove Duplicates?
Remove Duplicates is an Excel tool that eliminates repeated rows based on selected columns so the dataset becomes cleaner and more reliable. Interviewers may ask when to use it carefully, because removing duplicates incorrectly can also delete valid records.
152) What is Data Validation?
Data Validation lets you control what kind of input users can enter into cells, such as only numbers, dates, values from a list, or entries within a range. It helps enforce data integrity and reduce manual-entry errors.
153) Why is Data Validation useful in analytics work?
It prevents bad data from entering the spreadsheet in the first place, which reduces cleaning effort later. This is especially useful in shared templates, manual trackers, and recurring business reports.
154) What is Flash Fill?
Flash Fill automatically detects patterns and fills data accordingly, such as splitting names or combining fields into a new format. It is a quick productivity tool, though it should always be checked for correctness.
155) What do TRIM() and PROPER() help with?
TRIM() removes extra spaces from text, while PROPER() converts text to proper case. These are common cleaning functions for messy names, addresses, and imported text.
Formatting, dashboards, and interview tasks
156) What is conditional formatting?
Conditional formatting changes cell appearance automatically based on rules or thresholds, such as highlighting high values, duplicates, or overdue items. It is widely used for fast visual analysis and report clarity.
157) Why is conditional formatting useful in dashboards?
It draws attention to important signals such as poor performance, unusual spikes, duplicates, or target misses without requiring users to inspect every number manually. It improves decision-making speed when used thoughtfully.
158) What makes a good Excel dashboard?
A good Excel dashboard is clear, focused, easy to update, and built around the key business questions rather than too many unrelated charts. It should show the right KPIs, use readable formatting, and avoid clutter.
159) What are common Excel interview tasks for analysts?
Common tasks include cleaning messy data, building summary tables, writing lookup formulas, using SUMIFS() or COUNTIFS(), creating pivot tables, highlighting duplicates, and building a simple dashboard. Interviewers usually want to see practical problem-solving rather than fancy spreadsheet design.
160) When is Excel better than SQL or Python?
Excel is better when the dataset is relatively small, the task is ad hoc, the audience needs a spreadsheet output, or the analysis must be done quickly in a business-friendly format. A strong interview answer shows you know Excel is not a replacement for SQL or Python, but it remains highly useful for validation, presentation, and fast exploratory work.
Revision focus
For this part, revise references, IF, SUMIFS, COUNTIFS, IFERROR, VLOOKUP, XLOOKUP, INDEX-MATCH, pivot tables, conditional formatting, Text to Columns, Remove Duplicates, and Data Validation. These topics matter because Excel interviews usually test whether you can clean data, summarize it, and produce useful business output quickly rather than whether you know rare functions.
Part 6: Python for Data Analysis — Questions 161–200
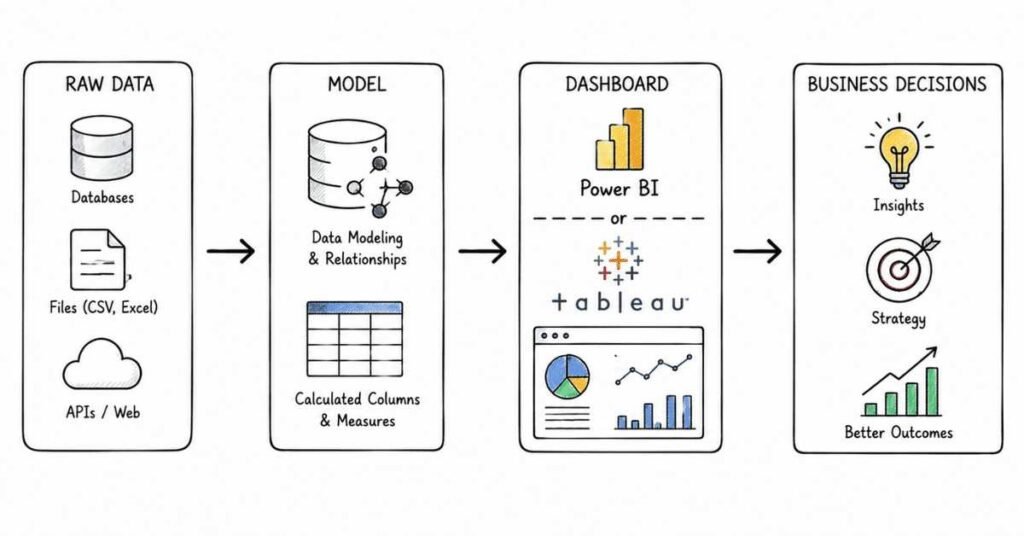
This part covers the Python topics most commonly expected in data analytics interviews. Beginner-focused data analysis resources consistently center on pandas for loading, filtering, grouping, merging, and handling missing values, NumPy for efficient array-based numerical operations, and Matplotlib or Seaborn for exploratory visualization and EDA workflows.
Questions 161–200
161) Why is Python useful in data analytics?
Python is useful because it helps analysts clean data, automate repetitive tasks, perform exploratory analysis, transform datasets, and create visualizations more flexibly than spreadsheets alone. It is especially valuable when data is too large or too messy for manual Excel work.
162) What Python libraries are most important for data analysts?
The most important starter libraries are pandas, NumPy, Matplotlib, and Seaborn. Pandas is mainly for tabular data analysis, NumPy for array-based numerical work, and Matplotlib or Seaborn for charts and EDA visuals.
163) What is pandas?
Pandas is a Python library designed for data manipulation and analysis, especially for structured tabular data such as CSV files and spreadsheets. It is one of the most important tools in Python-based analytics workflows.
164) What is a Series in pandas?
A Series is a one-dimensional labeled array in pandas. You can think of it as a single column of data with an index attached.
165) What is a DataFrame in pandas?
A DataFrame is a two-dimensional labeled tabular data structure made of rows and columns. It is the main object analysts use in pandas for cleaning, filtering, grouping, and merging data.
166) How do you load a CSV file in pandas?
The common method is pd.read_csv(). Loading CSV files is one of the first steps in most Python analytics workflows.
167) Why is read_csv() important in interviews?
It matters because many interview exercises begin with importing raw data from a CSV into a DataFrame, after which the candidate is expected to inspect, clean, and analyze it. It is a very basic but essential starting point in pandas-based work.
168) How do you inspect a DataFrame quickly?
Common first steps include checking .head(), .shape, .columns, .dtypes, and .info() to understand structure, size, and data types. A strong interview answer shows that you inspect data before transforming it.
169) What does .head() do?
.head() returns the first few rows of a DataFrame so you can preview the data. It is commonly used at the start of analysis and debugging.
170) What does .shape tell you?
.shape tells you the number of rows and columns in the DataFrame. It is useful for quickly checking data size before and after cleaning or filtering.
Selecting, filtering, and transforming data
171) How do you select columns in pandas?
You select one column with df[‘column_name’] and multiple columns with a list such as df[[‘col1’, ‘col2’]]. Column selection is one of the most common pandas operations.
172) How do you filter rows in pandas?
You filter rows using boolean conditions, such as df[df[‘sales’] > 1000]. This is similar in purpose to a WHERE clause in SQL.
173) Why is filtering important in Python analysis?
Filtering helps isolate relevant subsets such as one customer segment, one date range, or one product category. It is often the first step in answering business-specific questions.
174) What is boolean indexing in pandas?
Boolean indexing means selecting rows where a condition evaluates to True, such as high-value customers or delayed orders. It is one of the simplest and most powerful pandas operations.
175) What does .loc[] do?
.loc[] is used for label-based row and column selection in pandas. It is often preferred when you want readable, explicit slicing or conditional selection.
176) What does .iloc[] do?
.iloc[] is used for integer-position-based selection in pandas. It is helpful when you want rows or columns by position rather than label.
177) What does .sort_values() do?
.sort_values() sorts a DataFrame by one or more columns. It is useful for ranking, identifying top performers, or checking unusual values.
178) What does .drop() do?
.drop() removes columns or rows from a DataFrame. Analysts use it frequently to remove unnecessary fields during cleaning or transformation.
179) What does .rename() do?
.rename() changes column or index names to more useful labels. This is especially helpful when working with messy imported files or building cleaner outputs for reporting.
180) What is a strong beginner workflow after loading a dataset?
A strong workflow is: inspect the data, check types and missing values, clean obvious issues, filter or transform as needed, group or summarize for insights, and then visualize or report results. Interviewers usually like this structured approach because it mirrors real-world analysis.
Grouping, aggregating, and combining data
181) What does .groupby() do in pandas?
.groupby() groups data by one or more columns so you can apply aggregation functions like sum, mean, count, or max. It is one of the most important pandas methods for business analysis.
182) Why is .groupby() important in interviews?
It is important because grouped summaries like revenue by city, users by channel, or average spend by segment are common analytics tasks. Interviewers often use .groupby() questions to test whether you can summarize raw data into business metrics.
183) What does .agg() do?
.agg() lets you apply one or more aggregate functions to grouped data, such as mean, sum, count, min, or max. It is useful when you want a compact summary table with multiple metrics at once.
184) What is the difference between groupby() in pandas and GROUP BY in SQL?
They serve a similar purpose by summarizing data by groups, but pandas does it inside Python DataFrames while SQL does it in the database. A good interview answer shows you understand the conceptual similarity.
185) What is merge() in pandas?
merge() combines two DataFrames based on common keys, similar to a SQL join. It is used when information needed for analysis is split across multiple tables or files.
186) Why is merge() important?
Because real analysis often requires combining transaction data, customer data, product tables, or lookup mappings before insights can be generated. It is one of the most practical pandas skills for interview tasks.
187) What should you check after a merge?
You should check row counts, duplicate keys, missing matches, and whether the result still reflects the expected granularity. This is a strong interview answer because merge mistakes are very common.
188) What is concatenation in pandas?
Concatenation means stacking DataFrames together either vertically or horizontally, often using pd.concat(). It is useful when combining similar data from multiple files or periods.
Missing values and data cleaning
189) Why are missing values important in pandas?
Missing values can distort counts, averages, group summaries, and model inputs, so analysts need to identify and handle them carefully. Most real datasets contain some form of missing or incomplete data.
190) How do you detect missing values in pandas?
Common methods include .isna(), .isnull(), and checking counts by column. This is usually one of the first cleaning steps after loading data.
191) How can you handle missing values in pandas?
Common approaches include dropping rows or columns, filling missing values with defaults or statistics, and investigating whether the missingness itself is meaningful. A strong answer explains that the right choice depends on business context and data importance.
192) What does .fillna() do?
.fillna() replaces missing values with a specified value such as 0, ‘Unknown’, or a calculated statistic like a mean or median. It is one of the most frequently used cleaning methods in pandas.
193) What does .dropna() do?
.dropna() removes rows or columns that contain missing values. It is useful when missingness is limited or when incomplete rows are not usable for analysis.
194) Why should analysts be careful with .dropna()?
Because dropping too many rows can remove valuable information and bias the analysis. Interviewers often want to hear that you would first understand how much data is missing and whether it is safe to discard.
NumPy and numerical basics
195) What is NumPy?
NumPy is a Python library for numerical computing built around efficient multidimensional arrays and fast mathematical operations. It is foundational for many data analysis and scientific computing workflows.
196) What is a NumPy array?
A NumPy array is a fast, n-dimensional array object used to store and manipulate numerical data efficiently. It supports indexing, slicing, reshaping, and vectorized mathematical operations.
197) Why is NumPy important for analysts even if they mainly use pandas?
Because pandas is built on top of NumPy concepts and often relies on NumPy arrays internally. Understanding arrays, shapes, slicing, and vectorized operations helps analysts work more confidently with Python data structures.
198) What are vectorized operations in NumPy?
Vectorized operations apply calculations across entire arrays without writing explicit Python loops, making computations faster and cleaner. Examples include elementwise addition, multiplication, and comparisons.
Visualization and EDA
199) What is EDA in Python?
EDA, or exploratory data analysis, is the process of inspecting, summarizing, and visualizing data to understand structure, patterns, outliers, and relationships before deeper analysis or modeling. In Python, this often combines pandas summaries with Matplotlib or Seaborn charts.
200) Why are Matplotlib and Seaborn useful in analytics interviews?
They are useful because they help analysts quickly visualize distributions, trends, comparisons, and relationships, which is a core part of EDA and communication. Even if the role is not heavily coding-based, showing you can turn cleaned data into interpretable visuals is a strong practical signal.
Revision focus
For this part, revise pandas DataFrames, read_csv(), selection, filtering, .groupby(), merge(), missing-value handling, NumPy arrays, and EDA using Matplotlib or Seaborn. These topics matter because Python interview rounds usually test whether you can move from raw file to cleaned, summarized, and interpretable analysis in a structured way rather than just recall syntax.
Part 7: Statistics, Probability & A/B Testing — Questions 201–240
This part covers the statistics concepts that interviewers use to test whether you can reason about uncertainty rather than just calculate metrics. Standard statistics references explain that the Central Limit Theorem says sample means tend toward a normal distribution for sufficiently large random samples, and current A/B testing guides frame experiments as hypothesis tests built around null versus alternative hypotheses, p-values, significance level, power, and sample size.
Questions 201–240
201) Why do data analysts need statistics?
Data analysts need statistics because business data always contains noise, variation, and uncertainty. Statistics helps analysts summarize data, compare groups, estimate confidence, and avoid jumping to incorrect conclusions from random fluctuations.
202) What is the difference between descriptive and inferential statistics?
Descriptive statistics summarize observed data, while inferential statistics help you draw conclusions about a larger population from a sample. This distinction matters because many interview questions move from simple summaries into confidence, testing, and decision-making.
203) What is mean?
The mean is the arithmetic average of a set of values. It is widely used, but it can be heavily affected by very large or very small outliers.
204) What is median?
The median is the middle value when data is sorted. It is often preferred over the mean when the data is skewed or contains extreme values.
205) What is mode?
The mode is the most frequently occurring value in a dataset. It is especially useful for categorical data or repeated-value distributions.
206) When should you use mean versus median?
Use the mean when data is fairly symmetric and you want the average level, but use the median when the distribution is skewed or outliers may distort the average. This is a very common interview comparison question.
207) What is variance?
Variance measures how spread out values are from the mean. A higher variance means data points are more dispersed.
208) What is standard deviation?
Standard deviation is the square root of variance and measures typical spread around the mean in the same units as the data. It is easier to interpret than variance because it stays in the original scale.
209) Why is standard deviation important?
It helps analysts understand consistency, volatility, and risk in a dataset. For example, two products might have the same average sales but very different levels of variation.
210) What is range?
Range is the difference between the maximum and minimum values in a dataset. It is easy to compute but sensitive to outliers.
Probability basics
211) What is probability?
Probability is the likelihood that an event will occur, typically expressed between 0 and 1 or as a percentage. It forms the foundation for uncertainty, sampling, and hypothesis testing.
212) What is the difference between independent and dependent events?
Independent events do not affect each other’s probability, while dependent events do. This distinction matters in probability reasoning and experiment design.
213) What is conditional probability?
Conditional probability is the probability of one event occurring given that another event has already occurred. Analysts often use this idea when reasoning about funnels, retention, and user behavior.
214) What is a probability distribution?
A probability distribution describes how values or outcomes are spread and how likely each is to occur. In interviews, this usually leads to discussions about normal, binomial, or sampling distributions.
215) What is a normal distribution?
A normal distribution is a symmetric bell-shaped distribution where many values cluster around the mean and fewer occur far from it. It is important because many statistical methods rely on normality assumptions or large-sample approximations.
216) Why is the normal distribution so important?
It is important because many natural processes and sample statistics behave approximately normally, especially when sample sizes are large. This makes inference methods easier and more practical.
Sampling and the Central Limit Theorem
217) What is a population in statistics?
A population is the full group you want to understand, such as all users, all customers, or all transactions. In practice, analysts often work with samples rather than full populations.
218) What is a sample?
A sample is a subset of the population used to estimate population characteristics. Good sampling is essential because biased samples produce misleading conclusions.
219) What is sampling bias?
Sampling bias happens when the sample does not represent the population fairly. This leads to distorted estimates and weak decisions.
220) What is a sampling distribution?
A sampling distribution is the probability distribution of a sample statistic, such as the sample mean, over many repeated samples. This concept is central to inference, confidence intervals, and hypothesis testing.
221) What is the Central Limit Theorem?
The Central Limit Theorem says that for sufficiently large random samples, the distribution of sample means becomes approximately normal even if the underlying population is not normal. This is one of the most important ideas in practical statistics because it supports many inference methods.
222) Why is the Central Limit Theorem important in analytics?
It is important because it helps justify using normal-based methods for estimates and tests when sample sizes are large enough. In interview terms, it explains why averages from repeated samples behave predictably.
223) What is standard error?
Standard error measures how much a sample statistic, such as the sample mean, is expected to vary across repeated samples. References on sampling distributions describe it as the standard deviation of the sampling distribution.
224) How is standard error different from standard deviation?
Standard deviation measures variation among individual observations, while standard error measures variation in the sample statistic across samples. This is a common interview trap, so a clear distinction matters.
Confidence intervals and hypothesis testing
225) What is a confidence interval?
A confidence interval is a range of plausible values for a population parameter based on sample data. It reflects estimation uncertainty rather than giving one exact number.
226) How should you explain a 95% confidence interval in interviews?
A safe answer is that a 95% confidence interval is a procedure that, over many repeated samples, would produce intervals containing the true parameter about 95% of the time. This is more accurate than saying there is a 95% chance the already calculated interval contains the true value.
227) What is hypothesis testing?
Hypothesis testing is a framework for evaluating whether observed data is strong enough to reject a default assumption about a population or process. In A/B testing, it is usually used to assess whether a difference between groups is likely real or due to chance.
228) What is the null hypothesis?
The null hypothesis states that there is no real effect or difference, and that any observed difference is due to random chance. In experiments, it often means the control and variant perform the same.
229) What is the alternative hypothesis?
The alternative hypothesis states that there is a real effect or difference. In an A/B test, it means the variant and control are not performing the same.
230) What is a p-value?
An A/B testing guide defines the p-value as the probability of obtaining results at least as extreme as those observed, assuming the null hypothesis is true. It is not the probability that the variant is better, which is one of the most common misunderstandings.
231) What is significance level?
The significance level, often written as α\alphaα, is the threshold used to decide when a result is statistically significant, commonly 0.05 in many applications. It represents the tolerated risk of a false positive decision.
232) What is statistical significance?
Statistical significance means the observed result is unlikely enough under the null hypothesis to justify rejecting the null at the chosen significance level. It does not automatically mean the result is large, important, or valuable in business terms.
233) What is practical significance?
Practical significance asks whether the size of an effect actually matters for the business. A result can be statistically significant but still too small to justify implementation.
234) What is a Type I error?
A Type I error is rejecting the null hypothesis when it is actually true, which means a false positive. In experiment terms, it means believing a change worked when it really did not.
235) What is a Type II error?
A Type II error is failing to reject the null hypothesis when a real effect exists, which means a false negative. In experiment terms, it means missing a genuine improvement.
236) What is statistical power?
Statistical power is the probability of detecting a true effect when it actually exists, and A/B testing guides commonly describe 80% as a standard target. Higher power reduces the chance of Type II errors.
A/B testing basics
237) What is an A/B test?
An A/B test is an experiment that compares a control version and a variant version to see whether a change produces a meaningful difference in a chosen metric. Current interview-focused experimentation guidance describes it as fundamentally a two-sample hypothesis test.
238) What do you need before running an A/B test?
You need a clear hypothesis, a primary metric, a target population, a randomization method, and a sample size plan. Strong answers also mention baseline rate, minimum detectable effect, significance level, and power.
239) What is minimum detectable effect in A/B testing?
Minimum detectable effect, or MDE, is the smallest improvement worth detecting in the experiment. It directly affects required sample size, because smaller effects require larger samples to detect reliably.
240) Why is sample size important in experiments?
Sample size matters because too little data makes results noisy and underpowered, while A/B testing guidance recommends determining duration from required sample size rather than guessing a fixed number of days. Good experimentation practice also warns against “peeking” and stopping early just because the p-value temporarily drops below the threshold.
Revision focus
For this part, revise mean, median, variance, standard deviation, probability basics, sampling, the Central Limit Theorem, standard error, confidence intervals, p-values, Type I and Type II errors, power, and A/B testing fundamentals. These topics matter because interviewers use them to test whether you can reason carefully about uncertainty, experiment results, and business decisions instead of treating every metric change as automatically meaningful.
Part 8: Visualization, Dashboards, Case Studies & Projects — Questions 241–280
This part covers the presentation side of analytics interviews: how you choose visuals, design dashboards, explain insights, and present projects. Current dashboard and visualization guidance consistently emphasizes matching each chart to the business question, reducing clutter, maintaining scale and metric consistency, prioritizing KPIs, and designing layouts that help stakeholders reach correct conclusions faster.
Questions 241–280
241) Why is data visualization important in analytics?
Data visualization helps people understand trends, comparisons, outliers, and patterns faster than raw tables alone. In interviews, it shows whether you can communicate insights clearly rather than only calculate them.
242) What makes a good data visualization?
A good visualization is accurate, easy to read, relevant to the business question, and free from unnecessary clutter. Best-practice dashboard guidance also stresses that visuals should support quick and correct decision-making rather than just look attractive.
243) Why is chart selection important?
Chart selection matters because the wrong visual can confuse the audience or hide the main insight. Good visualization practice starts by matching the chart to the analytical question being answered.
244) What chart should you use for trends over time?
A line chart is usually the best choice for showing trends over time because it makes changes across dates or periods easy to follow. This is one of the most common chart-selection interview questions.
245) What chart should you use for comparing categories?
A bar chart is typically the best option for comparing values across categories because lengths are easy to compare visually. It is usually clearer than pie charts when many categories are involved.
246) What chart should you use for part-to-whole relationships?
A pie chart or stacked bar chart can be used for part-to-whole relationships, but pie charts work best only when there are a small number of categories. In interviews, a safe answer is that bar-based comparisons are often easier to read than pie slices when precision matters.
247) What chart should you use for distributions?
Histograms or box plots are commonly used to show distributions. They help analysts understand spread, skewness, clusters, and outliers.
248) What chart should you use for correlation?
A scatter plot is usually the best chart for showing the relationship between two numerical variables. It is especially useful when you want to see whether values move together or form clusters.
249) When is a table better than a chart?
A table is better when the audience needs exact values, detailed breakdowns, or operational lookup rather than pattern recognition. Good analysts know that visualization is not always the answer.
250) What are common chart mistakes in interviews?
Common mistakes include using the wrong chart type, adding too many colors, overcrowding visuals, hiding scales, and showing too many metrics in one view. Dashboard best-practice guidance consistently warns against clutter and unclear layouts.
Dashboards and KPI design
251) What is a dashboard?
A dashboard is a visual interface that combines key metrics and charts so stakeholders can monitor performance and explore data in one place. It is meant to support decision-making, not just display information.
252) What makes a good dashboard?
A good dashboard is focused, readable, visually consistent, and designed around the most important business questions. Current best-practice sources emphasize clean layout, metric prioritization, and context that helps users interpret results correctly.
253) Why should dashboards avoid clutter?
Clutter makes it harder for users to identify what matters and increases the chance of confusion or misinterpretation. Dashboard design guidance consistently recommends removing unnecessary visual elements and keeping layouts simple.
254) Where should KPIs usually go in a dashboard?
High-priority KPI summary cards usually belong near the top of the dashboard so users can see the headline numbers first. This is especially important in executive dashboards where speed and clarity matter.
255) What is a KPI card?
A KPI card is a simple visual element that displays a key metric such as revenue, growth rate, or conversion rate. It works well when paired with context such as trend arrows, targets, or previous-period comparisons.
256) Why is comparison context important in dashboards?
A metric without context can be misleading, because users need to know whether the number is improving, declining, on target, or unusual. Best-practice guidance recommends adding comparison context such as previous period, benchmark, or target so users can interpret KPIs correctly.
257) What is drill-down in dashboards?
Drill-down lets users move from a high-level summary into more detailed breakdowns, such as from region to state to city. It helps balance simplicity for executives with detail for analysts or managers.
258) What are filters in dashboards?
Filters let users narrow the data shown based on selections like date, region, product, or customer type. Interactive filters make dashboards more useful because different stakeholders often need different views of the same data.
259) Why is consistency important in dashboard design?
Consistency in colors, labels, metric definitions, and layout makes dashboards easier to understand and trust. Best-practice sources specifically highlight semantic and metric consistency as essential for reliable decision-making.
260) What is an executive dashboard?
An executive dashboard is a high-level dashboard focused on strategic KPIs and major trends rather than operational detail. Case-study guidance stresses that executive dashboards should stay simple, impact-focused, and uncluttered.
Tableau and Power BI awareness
261) What should you know about Tableau or Power BI for interviews?
At a minimum, you should understand how to connect data, clean or shape it, build charts, design dashboards, use filters, and explain insights clearly. Interview guidance also emphasizes that storytelling and business explanation matter more than just listing tool features.
262) What Tableau topics are commonly asked in interviews?
A recent Tableau and Power BI interview guide highlights topics such as dimensions versus measures, filters, aggregation versus disaggregation, parameters, dual-axis views, and data source choices. Even if the source is informal, these are realistic areas that frequently come up in BI-focused interviews.
263) What Power BI topics are commonly asked in interviews?
The same current interview guide highlights Power BI Desktop, Service, Gateway, DAX basics, Power Query, connectivity modes, and Q&A features as common interview areas. For data analyst roles, practical dashboard explanation usually matters as much as deep DAX knowledge.
264) What is a strong beginner answer if asked about Tableau versus Power BI?
A strong answer is that both are popular BI tools for building dashboards and visual analytics, and the better tool often depends on the company’s ecosystem, licensing, data environment, and user needs. In interviews, it is usually enough to explain which one you used and how you used it to solve a business problem.
265) What matters more in BI tool interviews: features or storytelling?
Current interview guidance strongly emphasizes storytelling, practical examples, and explaining how a dashboard solved a real business need rather than memorizing tool features. That means you should practice presenting insights, not just naming charts or menu options.
Case studies and analytics thinking
266) Why are case studies common in analytics interviews?
Case studies help interviewers evaluate structured thinking, business understanding, data cleaning logic, metric selection, and communication, not just tool syntax. They test how you approach ambiguous real-world problems.
267) What is a good framework for solving analytics case studies?
A strong framework is: understand the business objective, inspect and clean the data, define KPIs, choose the right analysis and visuals, validate the output, then explain insights and recommendations. This structure appears repeatedly in current BI case-study guidance.
268) What should you do first in a case-study question?
First clarify the business objective and what success means. Many case-study answers become weak because candidates jump into charts before understanding what decision the stakeholder actually needs.
269) What should you do if the data is messy in a case study?
You should identify missing values, duplicates, inconsistent categories, wrong formats, and calculation issues before analysis. Interview guidance specifically notes that explaining your data-cleaning logic clearly signals maturity and practical experience.
270) How do you choose KPIs in a case study?
Choose KPIs based on the business goal rather than on what is easiest to calculate. For example, a marketing case may focus on conversion rate, CAC, ROI, or revenue, while a retention case may focus on churn, repeat rate, or cohort behavior.
271) How do you explain insights to a non-technical audience?
A good structure is: state the business question, explain what the data shows, and then recommend an action. Current case-study guidance explicitly recommends storytelling over technical jargon when addressing non-technical stakeholders.
272) What should you do if stakeholders ask for too many visuals?
Explain that too many visuals reduce clarity and usability, then suggest multiple pages, drill-through, or prioritized KPI views instead. This is a strong interview answer because it shows user-focused dashboard thinking.
273) What is a good approach to a profitability case study?
Focus on revenue, cost, margin, and breakdowns by product, region, channel, or time. Case-study guidance recommends margin comparison and trend analysis so you can identify where profitability is being gained or lost.
274) What is a good approach to a sales underperformance case study?
Clarify whether the concern is revenue, profit, or volume, then compare performance by region, product, and time, and use trend plus breakdown views to isolate the weak areas. This exact structure appears in current BI case-study examples focused on underperforming regions.
Projects and portfolio presentation
275) Why are projects important in analytics interviews?
Projects give interviewers evidence of how you think, what tools you can use, and how well you can connect data work to business outcomes. For freshers and switchers, projects often matter more than job-title credibility.
276) What makes a strong analytics project?
A strong project has a clear business problem, clean data preparation, relevant metrics, sensible visuals, and a clear conclusion or recommendation. It should show reasoning, not just code or screenshots.
277) How should you explain a dashboard project in an interview?
A practical project explanation should cover the business problem, the data source, how you cleaned and shaped the data, how you selected KPIs and visuals, what insights you found, and what action the stakeholder could take. Current interview guidance repeatedly stresses explaining real use, not only the technical build steps.
278) What is a good project explanation structure?
Use this order:
- Problem statement.
- Data source.
- Cleaning and preparation.
- Analysis logic.
- Dashboard or model design.
- Insights.
- Business impact or recommendation.
That structure is consistent with current dashboard project and case-study guidance, which emphasizes business objective first, then data preparation, then design, then insights.
279) What are common mistakes when presenting analytics projects?
Common mistakes include overexplaining tool features, skipping the business objective, ignoring data cleaning, presenting too many visuals, and failing to mention insights or decisions. Interviewers usually care more about your reasoning and communication than about decorative complexity.
280) What is the best way to stand out in Part 8 topics?
The best way is to combine clean chart choice, stakeholder-focused dashboard design, structured case-study thinking, and confident project storytelling. These are exactly the areas current interview and dashboard guidance emphasizes for analyst and BI roles.
Revision focus
For this part, revise chart selection, dashboard layout, KPI prioritization, filters, executive dashboard principles, Tableau and Power BI basics, case-study frameworks, and project explanation structure. These topics matter because analytics interviews increasingly test whether you can turn data into decisions and communicate that clearly, not just whether you know formulas or queries.
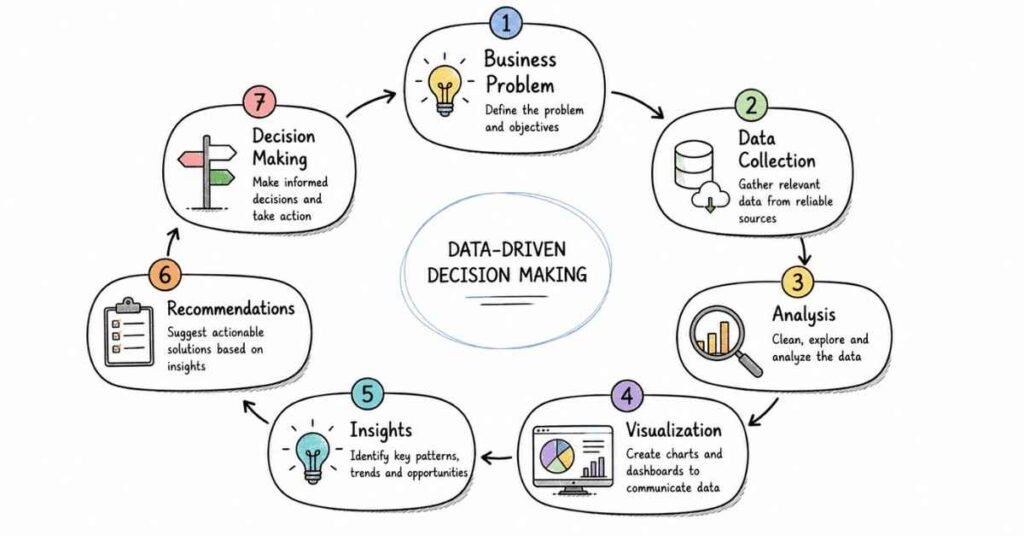
Part 9: Behavioral, Resume, LinkedIn & Career Strategy
This final part focuses on how to present yourself well in analytics interviews and in the job market. Current India salary sources put average data analyst pay around ₹6,50,741 per year on Indeed, while 2026 market-range guides place many fresher roles around ₹3–6 LPA and mid-level roles around ₹6–12 LPA depending on city, domain, and tool depth.
STAR method
The STAR method means answering behavioral questions using Situation, Task, Action, and Result so your answers are structured and credible. It works especially well in data analytics interviews because hiring managers often want to hear how you handled messy data, ambiguous requirements, stakeholder pressure, metric confusion, or conflicting business requests.
Use this analytics-friendly STAR structure:
- Situation: Brief business context, such as a dashboard issue, bad data, missed KPI target, or reporting confusion.
- Task: What you were responsible for.
- Action: What analysis, cleaning, SQL, Python, Excel, or dashboard work you performed.
- Result: What changed, improved, or was learned.
Example:
- Situation: A business team reported a sudden drop in conversion and wanted an urgent explanation.
- Task: I had to verify whether the issue was real and identify the likely cause.
- Action: I checked the metric definition, validated the underlying data, compared segments, and built a quick trend breakdown by source and device.
- Result: I found the drop was isolated to one acquisition channel after a tracking change, which prevented the team from making the wrong product decision.
20 behavioral questions
Below are 20 common behavioral questions with a framework you can use for each answer.
- Tell me about yourself.
Framework: Present role or background → analytics skills → target role. - Why do you want to work in data analytics?
Framework: Interest in problem-solving → data-driven decisions → long-term fit. - Tell me about a difficult data problem you solved.
Framework: Problem → analysis steps → outcome. - Describe a time you worked with unclear requirements.
Framework: Ambiguity → clarification → final result. - Tell me about a time data was messy or unreliable.
Framework: Data issue → cleaning/validation → impact. - Describe a time you found an important insight.
Framework: Context → approach → insight → decision supported. - Tell me about a mistake you made.
Framework: Mistake → ownership → correction → learning. - How do you handle deadlines?
Framework: Prioritization → communication → focused execution. - Describe a time you explained technical findings to a non-technical audience.
Framework: Complex analysis → simplified explanation → stakeholder outcome. - Tell me about a disagreement with a stakeholder or teammate.
Framework: Difference → evidence → alignment. - Describe a time you improved a report or dashboard.
Framework: Old issue → redesign → business benefit. - Tell me about a time you had to learn a new tool quickly.
Framework: Tool gap → learning → project use. - Describe a time you worked with multiple datasets.
Framework: Sources → join/clean/validate → result. - Tell me about a time you influenced a decision with data.
Framework: Question → analysis → recommendation → business action. - Describe a time your analysis was challenged.
Framework: Challenge → validation → resolution. - Tell me about a repetitive task you automated.
Framework: Manual process → automation approach → time saved. - Describe a time you missed something important in your analysis.
Framework: Missed issue → correction → improved process. - Tell me about a time you handled conflicting priorities.
Framework: Competing tasks → prioritization → communication → completion. - Describe a project you are proud of.
Framework: Business problem → tools used → insights → outcome. - Why should we hire you?
Framework: Core analytics skills + business thinking + communication + reliability.
Keep most behavioral answers around 60–90 seconds unless the interviewer asks you to go deeper.
50 AI self-preparation prompts
Use these prompts with an AI tool or as guided self-practice.
- Ask me data analyst behavioral questions one by one.
- Evaluate my “Tell me about yourself” answer for a data analyst role.
- Rewrite my self-introduction for an entry-level data analyst role.
- Rewrite my self-introduction for a BI analyst role.
- Conduct a mock HR round for a data analyst role.
- Conduct a mock hiring-manager round for a data analyst role.
- Ask me SQL interview questions one by one.
- Ask me Excel interview questions one by one.
- Ask me Python and pandas interview questions one by one.
- Ask me statistics and A/B testing interview questions.
- Turn my analytics project into a STAR answer.
- Improve my data analyst resume bullet points.
- Convert my non-analytics experience into analytics-friendly wording.
- Create a 30-second data analyst elevator pitch.
- Create a 60-second data analyst elevator pitch.
- Ask me difficult follow-up questions after each answer.
- Score my interview answers on clarity and confidence.
- Identify weak areas in my analytics preparation.
- Simulate a panel interview for a data analyst role.
- Simulate a salary negotiation for a data analyst role in India.
- Help me explain a dashboard project in interviews.
- Help me explain a SQL project without sounding overly technical.
- Create recruiter-friendly resume keywords for data analyst roles.
- Create recruiter-friendly LinkedIn headline options for data analytics.
- Improve my LinkedIn About section for analytics roles.
- Generate 10 strong data analyst resume headlines.
- Ask me why I am moving into analytics.
- Ask me why I am changing jobs.
- Ask me questions based on a sales dashboard project.
- Ask me questions based on a churn analysis project.
- Ask me questions based on a marketing campaign project.
- Ask me questions based on a SQL reporting project.
- Ask me questions based on an Excel dashboard project.
- Ask me questions based on a Tableau or Power BI project.
- Give me feedback on my speaking style.
- Make my answers sound more natural and professional.
- Convert long answers into crisp interview responses.
- Help me answer “What is your weakness?” honestly.
- Help me answer “Where do you see yourself in 3 years?”
- Create 20 likely HR questions for analytics consulting roles.
- Create 20 likely HR questions for product analytics roles.
- Ask me questions as if I exaggerated my resume.
- Cross-check whether my project claims sound believable.
- Turn my internship into interview-ready analytics achievements.
- Build a 7-day mock interview plan from my resume.
- Help me practice salary discussion lines.
- Create a thank-you email after an analytics interview.
- Create a recruiter outreach message for a data analyst role.
- Create a follow-up email after 5 days of no response.
- Create a final revision plan from my weak areas.
Resume optimization
Current 2026 resume guidance for data analyst roles consistently emphasizes ATS-friendly keywords, measurable bullet points, and alignment between the target analyst subtype and the skills presented, such as BI, product, growth, or operations analytics. These guides also stress that recruiters care about outcomes, KPI ownership, and evidence of decision support rather than only tool names.
Use this structure:
- Name and contact details.
- Resume headline.
- 3–4 line professional summary.
- Technical skills.
- Projects or experience.
- Education.
- Certifications.
- Portfolio or GitHub or dashboard links if relevant.
Useful keywords to include naturally:
- SQL, Excel, Python, pandas, NumPy, Tableau, Power BI, data visualization, dashboarding, KPI reporting, exploratory data analysis, statistics, A/B testing, data cleaning, reporting automation, business analysis, stakeholder communication, forecasting, cohort analysis, churn analysis, funnel analysis, ETL, Power Query, DAX.
Role-specific keywords matter too, and current keyword guides recommend tailoring them to the analyst subtype rather than using one generic list for every application. For example, BI roles should emphasize dashboards, data modeling, and reporting, while product analytics roles should emphasize experimentation, funnels, retention, and product metrics.
Better bullet style:
- Built SQL reports to track revenue, conversion, and customer activity across business segments.
- Cleaned and transformed raw data in Excel and Python to improve reporting accuracy.
- Created Tableau or Power BI dashboards for KPI monitoring and stakeholder reporting.
- Automated recurring analysis workflows to reduce manual effort and reporting time.
- Performed cohort, funnel, or churn analysis to identify performance gaps and opportunities.
- Partnered with business teams to define metrics and explain analytical findings clearly.
Avoid these common resume mistakes:
- Listing too many tools without proof of usage.
- Writing generic bullets like “worked on reports” or “analyzed data.”
- Using one resume for every analyst subtype.
- Claiming A/B testing or advanced Python depth without credible examples.
- Forgetting numbers, outcomes, or business impact in bullets.
Resume summary example
For fresher:
“Entry-level data analyst candidate with strong foundations in SQL, Excel, Python, statistics, and dashboarding. Hands-on practice in data cleaning, exploratory analysis, KPI reporting, and business storytelling through academic and self-built projects. Seeking an opportunity to contribute as a data analyst while continuing to build expertise in BI, experimentation, and stakeholder-driven problem-solving.”
For experienced candidate:
“Data analyst with experience in SQL, Excel, Python, and BI dashboards for business reporting and decision support. Comfortable with data cleaning, KPI design, exploratory analysis, and translating business questions into structured analytical outputs. Strong foundation in reporting, visualization, and stakeholder communication with growing depth in experimentation and advanced analytics.”
LinkedIn profile optimization
For analytics job search, LinkedIn should make your role target immediately visible. Recruiters usually scan headline, About section, experience, featured work, skills, and whether your profile clearly signals SQL, Excel, Python, dashboards, and the kind of analyst role you want.
Use these upgrades:
- Headline: Do not use only “Data Analyst” or your current title; include core tools or specialization.
- About: Write 3 short paragraphs covering background, skills, and role target.
- Experience: Use measurable, achievement-focused bullets similar to your resume.
- Skills: Add relevant analytics tools and methods.
- Featured: Add portfolio links, Tableau Public, Power BI screenshots, GitHub, or project writeups.
- Certifications: Add relevant certifications clearly.
- Open to Work: Turn it on for recruiters.
- URL: Use a clean LinkedIn custom URL.
Complete Data Analytics career paths
Headline examples
Fresher:
- Aspiring Data Analyst | SQL, Excel, Python, Tableau, Power BI | KPI Reporting & Dashboard Projects
BI-focused:
- Data Analyst | SQL, Excel, Power BI, Tableau | Dashboarding, KPI Reporting, Business Insights
Product-focused:
- Data Analyst | SQL, Python, A/B Testing, Funnel & Cohort Analysis | Product Analytics
About section template
“I work on data analysis, reporting, and dashboarding with a focus on turning raw data into business-friendly insights. My core toolkit includes SQL, Excel, Python, and BI visualization tools, and I enjoy solving practical business problems with structured analysis.
My experience and preparation include data cleaning, exploratory analysis, KPI tracking, dashboard building, and communicating findings to non-technical stakeholders. I am especially interested in roles where analytics supports clear decision-making across product, operations, marketing, or business performance.
I am currently targeting data analyst opportunities where I can contribute strongly in reporting, analysis, and business storytelling while continuing to grow in experimentation, advanced analytics, and strategic decision support.”
Project and portfolio strategy
A portfolio is especially valuable for freshers, switchers, and candidates with limited formal analytics experience because it gives interviewers something concrete to evaluate. The best projects are not necessarily the most complex ones; they are the ones that clearly show business thinking, clean execution, and clear communication.
Strong project categories:
- Sales performance dashboard.
- Churn or retention analysis.
- Customer segmentation project.
- Marketing campaign analysis.
- Product funnel analysis.
- Excel reporting automation project.
- SQL-based KPI reporting project.
- Tableau or Power BI business dashboard.
- A/B test or experiment analysis project.
For each project, prepare these six points:
- Business problem.
- Data source.
- Cleaning and preparation.
- Metrics chosen.
- Key insight.
- Business recommendation.
Good project explanation example:
“I built a sales performance dashboard using SQL and Power BI. I cleaned transaction and product data, created KPIs for revenue, quantity, and profit, and added trend and region views to identify weak-performing segments. The analysis showed that one region had strong volume but weak margin, which suggested a pricing or discount problem.”
Salary guidance in India
Indeed reports an average data analyst salary in India of ₹6,50,741 per year, with entry-level analysts around ₹5,15,010 and senior data analysts around ₹11,30,130. Additional 2026 salary-range posts place fresher data analyst roles around ₹3–6 LPA and mid-level roles around ₹6–12 LPA, which is directionally consistent with broader market expectations but should be treated as approximate rather than authoritative benchmarks.
A practical planning range is:
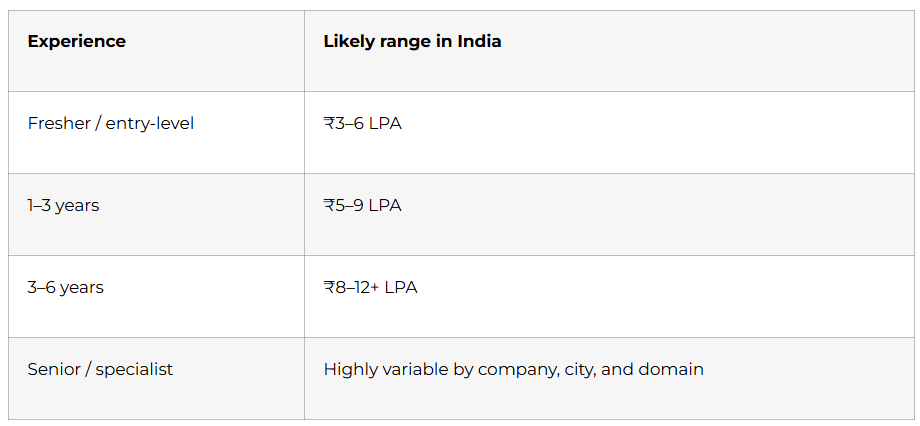
Indeed also reports higher-paying cities such as Gurgaon at about ₹8,43,911, Bengaluru at ₹7,87,663, and Noida at ₹7,52,998, showing that location meaningfully affects compensation. In interviews, frame salary expectations around skills, tool depth, domain fit, and role scope rather than only market averages.
Sample line:
“Based on my current analytics skills, project exposure, and the market range for similar roles in India, I am looking for a fair opportunity in the range of X to Y LPA, while staying open to the overall role scope and growth path.”
Thank-you and follow-up emails
Thank-you email template
Subject: Thank you — Data Analyst interview
Hello [Interviewer Name],
Thank you for taking the time to speak with me today regarding the Data Analyst role. I enjoyed our conversation, especially the discussion around [SQL / dashboards / analytics workflows / experimentation / business reporting].
The role aligns well with my experience in [SQL / Excel / Python / Tableau / Power BI / business analysis], and I would be excited to contribute to your team.
Thank you again for your time and consideration.
Best regards,
[Your Name]
[Phone Number]
[Email]
Follow-up email after 4–7 days
Subject: Follow-up on Data Analyst interview
Hello [Interviewer Name],
I hope you are doing well. I am writing to follow up on the interview process for the Data Analyst position. I remain very interested in the opportunity and wanted to check whether there are any updates regarding the next steps.
Thank you for your time and consideration.
Best regards,
[Your Name]
Recruiter follow-up after application
Subject: Application for Data Analyst role
Hello [Recruiter Name],
I recently applied for the Data Analyst position and wanted to express my interest directly. My background includes [SQL / Excel / Python / dashboards / reporting / business analysis], and I believe my profile aligns well with the role requirements.
I would be glad to share any additional details if needed.
Best regards,
[Your Name]
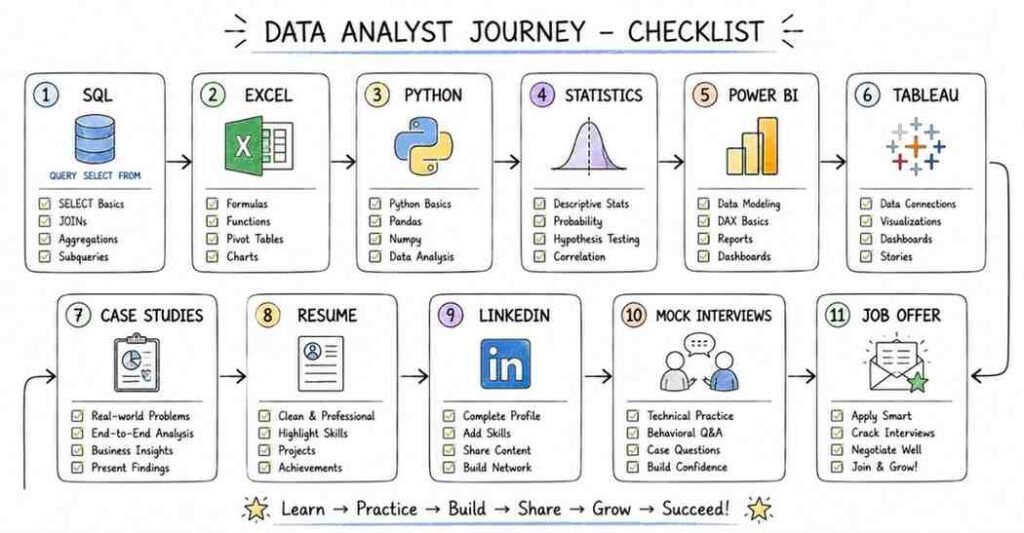
Final 30-day checklist
Week 1
- Review analytics basics, business thinking, KPI concepts, and data quality.
- Practice 40 foundational interview questions aloud.
- Finalize 2–3 project stories.
- Update resume summary and core skills.
Week 2
- Revise SQL fundamentals, joins, grouping, subqueries, and window functions.
- Solve SQL practice questions daily.
- Prepare clean explanations for common SQL patterns.
- Update LinkedIn headline and About section.
Week 3
- Revise Excel, Python, pandas, statistics, probability, and A/B testing.
- Practice explaining when to use SQL, Excel, or Python.
- Strengthen one dashboard or portfolio project.
- Prepare salary and job-change answers.
Week 4
- Revise visualization, dashboard design, case-study frameworks, and project storytelling.
- Practice behavioral answers using STAR.
- Do full mock interviews: HR, technical, case-study, and project round.
- Apply consistently and track applications.
Final 3 days
- Read only your notes, not new topics.
- Practice concise answers and project explanations.
- Keep resume, portfolio links, and documents ready.
- Sleep properly and stay sharp for communication.