Contents
How to Become an Advanced Excel & Business Analytics Expert: Complete Career Guide [₹5L Average Salary]
Master business intelligence through Excel mastery and analytics expertise
Advanced Excel and business analytics professionals are experiencing growing demand as organizations seek data-driven decision making, with average salaries ranging from ₹2.5-8 LPA in India and senior business analysts earning ₹12+ LPA. As businesses generate more data and require sophisticated analysis for competitive advantage, the ability to transform complex datasets into actionable insights using Excel and complementary tools has become one of the most valuable and practical skills across industries.
Whether you’re an Excel beginner looking to advance to power user status, an accountant seeking analytical skills, or a business professional wanting to leverage data for strategic decisions, this comprehensive guide provides the proven roadmap to mastering advanced Excel and business analytics. Having trained over 380 Excel professionals at Frontlines EduTech with an 88% job placement rate, I’ll share the strategies that consistently deliver results in data-driven careers.
What you’ll master in this guide:
- Complete Excel learning progression from basics to advanced business modeling
- Essential analytics tools and techniques for business intelligence
- Portfolio projects demonstrating real analytical value and decision support
- Career paths in financial analysis, business intelligence, and data analysis
- Integration with modern BI tools and analytics platforms
🚀 Start your analytics journey with structured, step-by-step learning paths for Excel & BI.
1. What is Advanced Excel & Business Analytics?
Advanced Excel and business analytics combines sophisticated Excel functionality with analytical thinking to solve complex business problems, forecast trends, and support strategic decision-making. This discipline goes far beyond basic spreadsheet usage, incorporating statistical analysis, financial modeling, data visualization, and business intelligence principles to create comprehensive analytical solutions.
Core Components of Advanced Excel Analytics:
Advanced Excel Functions and Formulas:
- Lookup and Reference Functions – VLOOKUP, HLOOKUP, INDEX/MATCH, XLOOKUP for data retrieval
- Statistical and Mathematical Functions – SUMIFS, COUNTIFS, AVERAGEIFS, array formulas
- Date and Time Analysis – NETWORKDAYS, DATEDIF, YEARFRAC for time-based calculations
- Text and Data Manipulation – CONCATENATE, TEXTJOIN, data parsing and cleaning functions
Data Analysis and Modeling:
- PivotTables and PivotCharts – Multi-dimensional data analysis, dynamic reporting, dashboard creation
- What-If Analysis – Scenario planning, Goal Seek, Data Tables, Monte Carlo simulation
- Financial Modeling – DCF models, budgeting, forecasting, sensitivity analysis
- Statistical Analysis – Regression analysis, correlation, trend analysis, hypothesis testing
Business Intelligence and Visualization:
- Dashboard Development – Interactive dashboards with slicers, timelines, and conditional formatting
- Chart and Graph Mastery – Advanced charting techniques, combination charts, dynamic visualizations
- KPI and Metrics Tracking – Performance measurement, variance analysis, trending indicators
- Automated Reporting – Template development, data refresh automation, stakeholder reporting
Process Automation and Efficiency:
- VBA Programming – Macro development, user forms, automated workflows, custom functions
- Power Query – Data extraction, transformation, and loading from multiple sources
- Power Pivot – Data modeling, relationships, calculated fields for large datasets
- Integration – Connecting Excel with databases, web services, and other business applications
Excel Analytics vs Traditional Business Analysis
Traditional Analysis Limitations:
- Manual data collection and manipulation processes
- Limited ability to handle large datasets efficiently
- Static reporting with infrequent updates
- Difficulty in scenario modeling and forecasting
Advanced Excel Analytics Advantages:
- Automated data processing and real-time analysis capabilities
- Sophisticated modeling and simulation tools
- Interactive dashboards and dynamic reporting
- Integration with external data sources and business systems
📊 Want real practice? Access 20+ business analytics case studies & project templates.
2. Why Choose Excel Analytics in 2025?

Universal Business Tool with Growing Sophistication
According to Microsoft’s Work Trend Index 2025, Excel remains the most widely used business application globally, with over 750 million users. In India specifically, Excel expertise is fundamental across industries:
Cross-Industry Demand:
- Financial Services – Investment banking, accounting firms, insurance companies for financial modeling
- Manufacturing – Supply chain optimization, production planning, quality control analysis
- Retail and E-commerce – Inventory management, sales forecasting, customer analytics
- Healthcare – Patient data analysis, operational efficiency, regulatory reporting
- Government and Public Sector – Budget analysis, program evaluation, policy impact assessment
Digital Transformation Integration:
- Business Intelligence Evolution – Excel as gateway to advanced BI tools like Power BI and Tableau
- Data Science Pipeline – Excel for data preparation and exploratory analysis before advanced modeling
- Cloud Integration – Excel 365 with cloud collaboration and real-time data connectivity
- Automation and AI – Integration with Power Automate and AI-powered insights
Competitive Salary Packages with Broad Applicability
Excel and analytics professionals enjoy stable career growth across multiple functions:
💡 Kickstart your learning with beginner-friendly interview guides for Excel, SQL & Business Analytics.
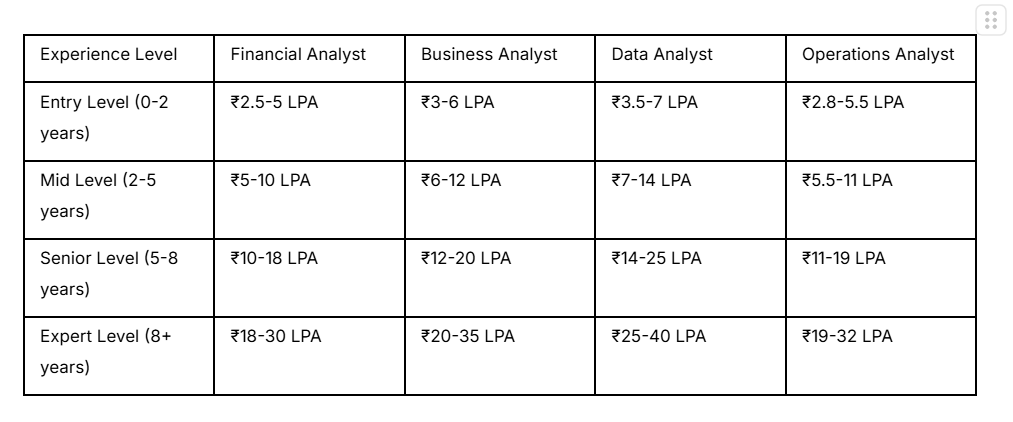
Source: PayScale India 2025, Glassdoor Business Analyst Salaries
Low Barrier to Entry with High Skill Ceiling
Excel analytics offers accessible progression with significant growth potential:
- Familiar Starting Point – Most professionals have basic Excel exposure
- Incremental Learning – Skills build progressively from basic to advanced
- Immediate Application – Can apply new skills immediately in current role
- Versatile Foundation – Transferable skills across industries and functions
Gateway to Advanced Analytics and Data Science
Excel expertise provides foundation for advanced analytical careers:
- Statistical Understanding – Concepts transfer to R, Python, and other analytical tools
- Business Context – Understanding how analysis supports business decisions
- Data Visualization – Principles apply to Tableau, Power BI, and other BI tools
- Model Development – Financial and analytical modeling concepts scale to advanced platforms
🔥 Master PivotTables & dashboards with our Resources
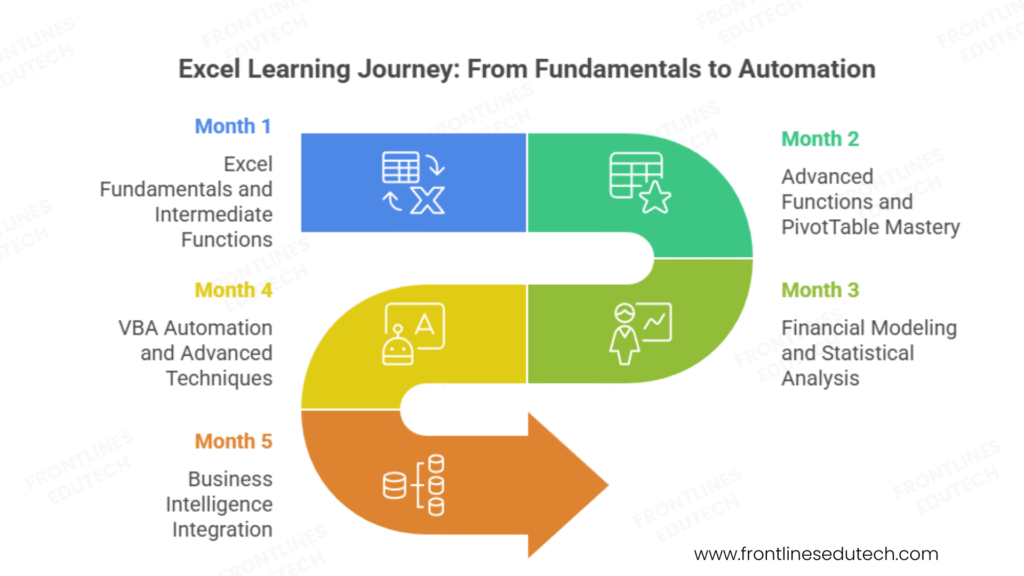
3. Complete Learning Roadmap (3-5 Months)
📘 Practice Core Excel functions with downloadable notes, exercises & datasets.
Phase 1: Excel Fundamentals and Intermediate Functions (Month 1)
Excel Foundation Reinforcement (1-2 weeks)
Even experienced users benefit from solidifying fundamentals:
- Navigation and Interface – Ribbon mastery, keyboard shortcuts, customization options
- Data Entry and Formatting – Efficient data input, conditional formatting, data validation
- Basic Formulas – Arithmetic operations, relative vs absolute references, error handling
- Cell and Range Management – Named ranges, structured references, data organization principles
Intermediate Functions and Analysis (2-3 weeks)
- Lookup Functions – VLOOKUP, HLOOKUP, INDEX/MATCH combinations, approximate match techniques
- Logical Functions – IF, AND, OR, nested IF statements, error handling with IFERROR
- Text Functions – CONCATENATE, LEFT, RIGHT, MID, FIND, SUBSTITUTE for data cleaning
- Date and Time Functions – DATE, TIME, NETWORKDAYS, age calculations, period analysis
Data Management and Organization (1 week)
- Data Validation – Drop-down lists, custom validation rules, error alerts
- Sorting and Filtering – Advanced filter criteria, custom sorting, dynamic filtering
- Data Import and Cleaning – Text to columns, remove duplicates, data standardization
- Table Functionality – Excel tables, structured references, automatic expansion
Foundation Projects:
- Personal Finance Tracker – Comprehensive budget analysis with categorization and forecasting
- Sales Performance Dashboard – Monthly sales tracking with trending and variance analysis
- Employee Database Management – HR data organization with lookup functions and reporting
Phase 2: Advanced Functions and PivotTable Mastery (Month 2)
Advanced Formula Techniques (2-3 weeks)
- Array Formulas – Legacy arrays and dynamic arrays, SUMPRODUCT applications
- Statistical Functions – SUMIFS, COUNTIFS, AVERAGEIFS with multiple criteria
- Advanced Lookup – Multiple criteria lookups, two-way lookups, dynamic range references
- Financial Functions – PMT, FV, PV, IRR, NPV for financial analysis and modelling
PivotTable and PivotChart Excellence (2-3 weeks)
- PivotTable Construction – Data source preparation, field organization, calculated fields
- Advanced PivotTable Features – Grouping, custom calculations, show values as percentages
- PivotChart Integration – Dynamic charting, multiple chart types, formatting techniques
- Slicer and Timeline Implementation – Interactive filtering, dashboard connectivity
Business Intelligence with Excel (1-2 weeks)
- Power Query Introduction – Data extraction from multiple sources, transformation techniques
- Data Modelling Basics – Relationships, calculated columns, measures
- Dashboard Design Principles – Layout, colour theory, user experience, interactive elements
- Automated Reporting – Template development, data refresh procedures, distribution methods
Advanced Analysis Projects:
- Multi-Source Sales Analysis – Combining data from CRM, accounting, and marketing systems
- Financial Performance Dashboard – P&L analysis with variance reporting and trend identification
- Customer Analytics Model – RFM analysis, customer segmentation, lifetime value calculation
Phase 3: Financial Modelling and Statistical Analysis (Month 3)
Financial Modelling Fundamentals (3-4 weeks)
- Three-Statement Models – Income statement, balance sheet, cash flow integration
- DCF Modelling – Discounted cash flow analysis, terminal value, sensitivity analysis
- Scenario and Sensitivity Analysis – What-if modelling, data tables, Monte Carlo simulation
- Budgeting and Forecasting – Rolling forecasts, variance analysis, performance tracking
Statistical Analysis in Excel (2-3 weeks)
- Descriptive Statistics – Mean, median, mode, standard deviation, variance analysis
- Correlation and Regression – Relationship analysis, trend lines, R-squared interpretation
- Hypothesis Testing – T-tests, chi-square tests, p-values, confidence intervals
- Time Series Analysis – Trend analysis, seasonality, moving averages, exponential smoothing
Advanced Charting and Visualization (1-2 weeks)
- Advanced Chart Types – Waterfall charts, Gantt charts, heat maps, sparklines
- Combination Charts – Multiple axis charts, data series combination, formatting
- Interactive Elements – Form controls, spin buttons, scroll bars for dynamic models
- Professional Presentation – Chart formatting, colour schemes, annotation techniques
Financial Modelling Projects:
- Complete Business Valuation Model – DCF analysis with multiple scenarios and sensitivities
- Budget vs Actual Dashboard – Comprehensive variance analysis with drill-down capabilities
- Investment Portfolio Tracker – Performance analysis, risk metrics, rebalancing recommendations
Phase 4: VBA Automation and Advanced Techniques (Month 4)
VBA Programming Fundamentals (3-4 weeks)
- VBA Environment – Visual Basic Editor, project structure, debugging tools
- Basic Programming Concepts – Variables, data types, loops, conditional statements
- Excel Object Model – Workbooks, worksheets, ranges, application object manipulation
- User Forms – Dialog box creation, input validation, user interface design
Process Automation and Efficiency (2-3 weeks)
- Macro Recording and Editing – Recording techniques, code optimization, error handling
- Custom Functions – User-defined functions, function libraries, distribution methods
- Event-Driven Programming – Workbook events, worksheet change events, automatic execution
- File Operations – Opening, saving, importing data from external sources
Advanced Integration and Connectivity (1-2 weeks)
- Database Connectivity – ADO connections, SQL queries, data import/export
- Web Data Integration – API connections, web scraping, real-time data feeds
- Email Automation – Outlook integration, automated reporting, alert systems
- Error Handling and Debugging – Comprehensive error management, user-friendly interfaces
Automation Projects:
- Automated Monthly Reporting System – Multi-workbook consolidation with formatting and distribution
- Dynamic Dashboard with VBA – Interactive dashboard with real-time data updates and user controls
- Data Processing and Analysis Tool – Custom application for repetitive analysis tasks
Phase 5: Business Intelligence Integration (Month 5)
Power Platform Integration:
- Power Query Advanced – Complex data transformations, API connections, scheduled refresh
- Power Pivot Modeling – Relational data models, DAX calculations, advanced measures
- Power BI Integration – Excel to Power BI migration, shared datasets, collaborative analytics
- Power Automate – Workflow automation, approval processes, data synchronization
Modern Analytics Tools:
- Tableau Public – Data visualization principles, dashboard design, storytelling with data
- Google Analytics Integration – Marketing data analysis, customer behavior insights
- SQL Basics – Database querying, joins, data extraction for Excel analysis
Python Integration – Excel-Python connectivity, advanced statistical analysis
⚙️ Automate your tasks with VBA—Access macros, code snippets & automation examples.
4. Essential Tools and Software
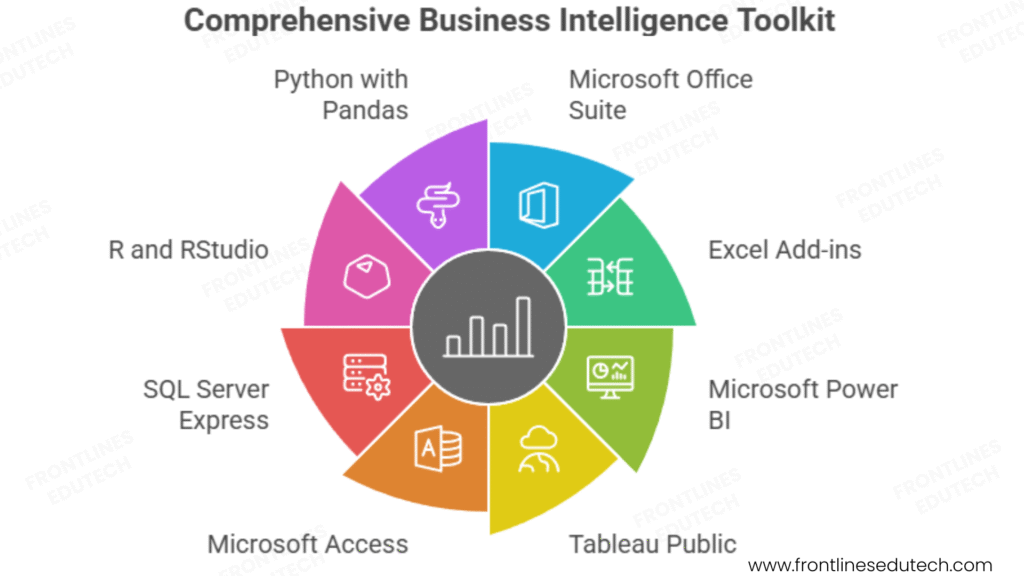
Microsoft Office Suite and Extensions
Excel 365 (Recommended):
- Latest Features – Dynamic arrays, XLOOKUP, Power Query integration, collaboration tools
- Cloud Connectivity – OneDrive integration, real-time collaboration, mobile access
- Power Platform Access – Power Query, Power Pivot, Power BI integration
- Continuous Updates – Monthly feature releases, security updates, performance improvements
Excel Add-ins and Extensions:
- Analysis ToolPak – Statistical analysis functions, regression analysis, histogram creation
- Solver Add-in – Optimization problems, constraint-based modelling, scenario analysis
- Power Query – Data connection and transformation, ETL processes, automated refresh
- Power Pivot – Data modelling, relationships, DAX calculations for large datasets
Complementary Business Intelligence Tools
Microsoft Power BI:
- Excel Integration – Seamless data import, shared calculations, consistent formatting
- Advanced Visualizations – Interactive dashboards, custom visuals, mobile optimization
- Cloud Collaboration – Shared datasets, workspace collaboration, automated refresh
- Enterprise Features – Row-level security, usage analytics, premium connectors
Tableau Public:
- Data Visualization – Advanced charting capabilities, interactive dashboards, storytelling
- Web Publishing – Public dashboard sharing, portfolio development, community engagement
- Learning Resources – Extensive documentation, community support, training materials
- Career Development – Industry recognition, skill demonstration, networking opportunities
Database and Data Sources
Microsoft Access:
- Relational Databases – Multi-table relationships, queries, forms, and reports
- Excel Integration – Import/export capabilities, linked tables, data synchronization
- Small Business Solutions – Customer databases, inventory management, project tracking
- Learning Foundation – Database concepts preparation for SQL Server and other platforms
SQL Server Express:
- Enterprise Database – Free version of Microsoft SQL Server for learning and development
- Advanced Queries – Complex joins, stored procedures, triggers, performance optimization
- Excel Connectivity – Direct connections, real-time data access, automated reporting
- Career Preparation – Enterprise database experience for business analyst roles
Statistical and Analytical Software
R and RStudio:
- Statistical Computing – Advanced statistical analysis, machine learning, data mining
- Excel Integration – R scripts in Excel, data import/export, collaborative analysis
- Visualization – ggplot2, advanced graphing capabilities, publication-quality charts
- Community Support – Extensive package library, active community, learning resources
Python with Pandas:
- Data Analysis – Large dataset processing, data cleaning, statistical analysis
- Excel Automation – openpyxl and xlsb libraries for Excel file manipulation
- Machine Learning – scikit-learn integration, predictive modelling, data science workflows
- Career Bridge – Transition path to data science and advanced analytics roles
5. Building Your Analytics Portfolio
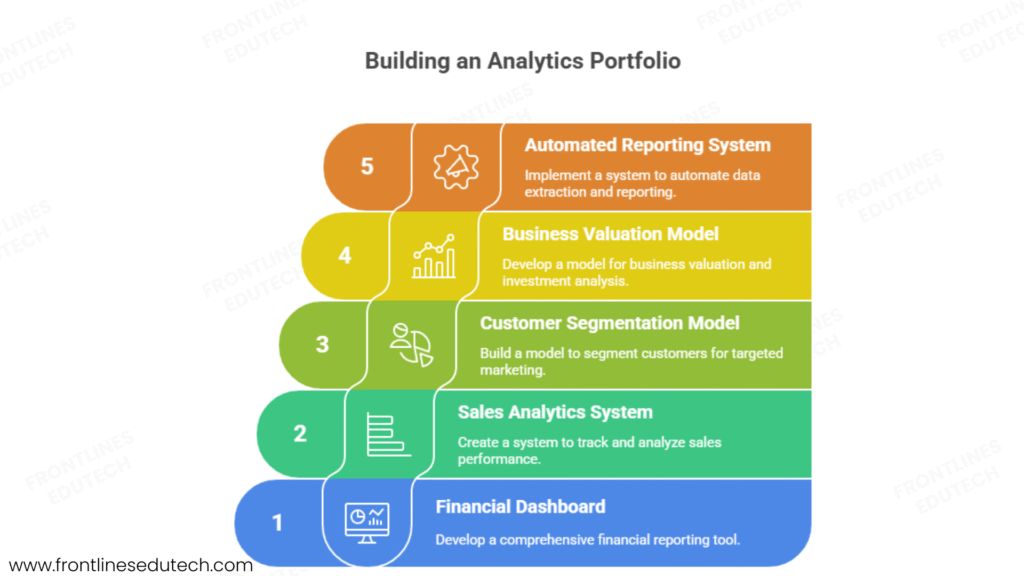
Portfolio Strategy and Structure
Business Analytics Portfolio Objectives:
- Demonstrate Technical Proficiency – Show mastery of advanced Excel functions and techniques
- Highlight Business Impact – Quantify improvements and decision support provided
- Showcase Problem-Solving – Display analytical thinking and methodology
- Present Communication Skills – Professional documentation and stakeholder presentation
Foundation Level Projects (Months 1-2)
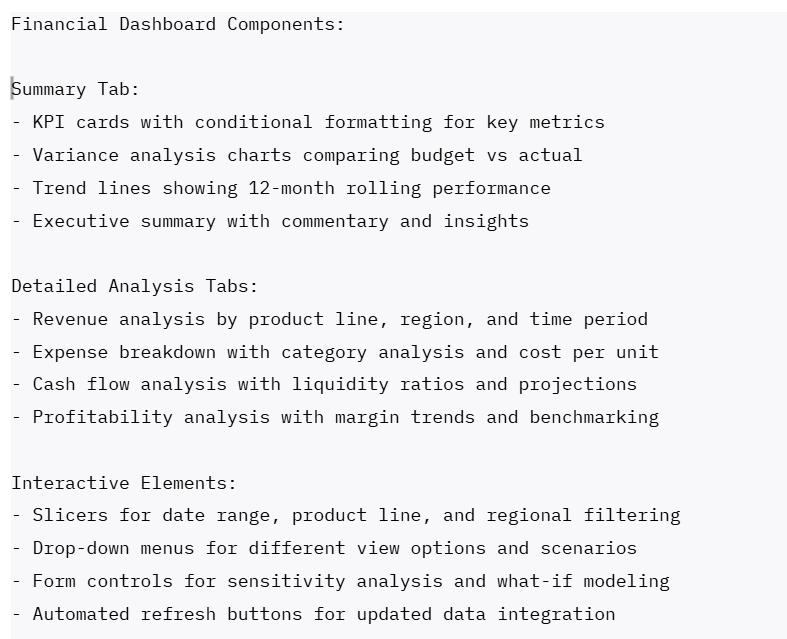
- Comprehensive Financial Dashboard
- Project Scope: Multi-year financial analysis with budget vs actual tracking and forecasting
- Technical Skills: Advanced formulas, PivotTables, conditional formatting, charting
- Business Value: Executive-level financial reporting with variance analysis and trend identification
- Deliverables: Interactive dashboard, documentation, executive summary presentation
- Data Sources: Multi-year P&L statements, budget data, industry benchmarks
Excel Implementation Example:
- Sales Performance Analytics System
- Challenge: Sales team lacks visibility into performance drivers and trends
- Solution: Comprehensive sales analytics with individual and team performance tracking
- Analysis: Conversion funnel analysis, territory performance, seasonal trends, forecasting
- Tools Used: SUMIFS, COUNTIFS, PivotTables, advanced charting, VBA automation
- Business Impact: 25% improvement in sales forecasting accuracy, identification of underperforming territories
Intermediate Level Projects (Months 3-4)
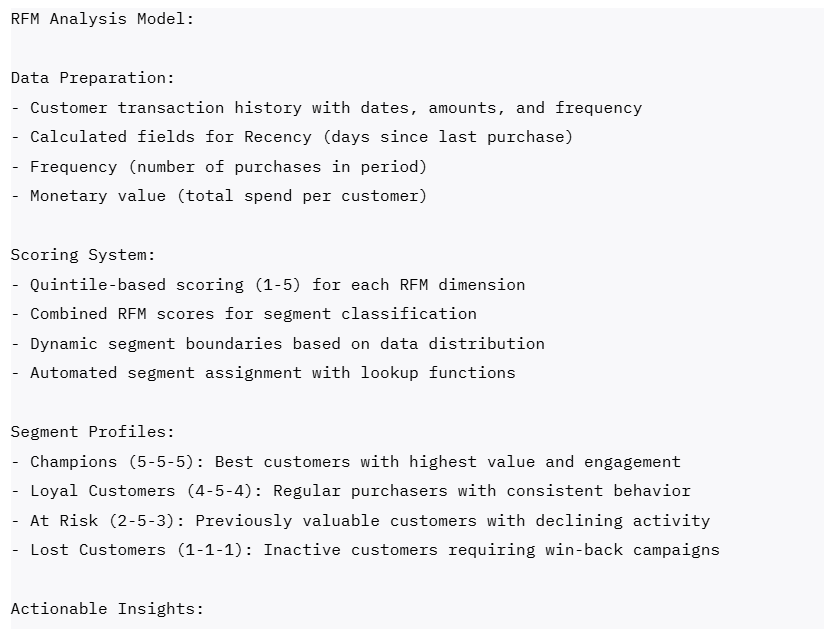
- Customer Analytics and Segmentation Model
- Business Problem: Marketing team needs customer insights for targeted campaigns and retention strategies
- Analytical Approach: RFM analysis, customer lifetime value calculation, churn prediction modeling
- Advanced Techniques: Statistical analysis, correlation studies, predictive modeling with regression
- Dashboard Features: Customer segment profiling, campaign ROI analysis, retention recommendations
- Measurable Outcomes: 30% improvement in marketing campaign effectiveness, 15% increase in customer retention
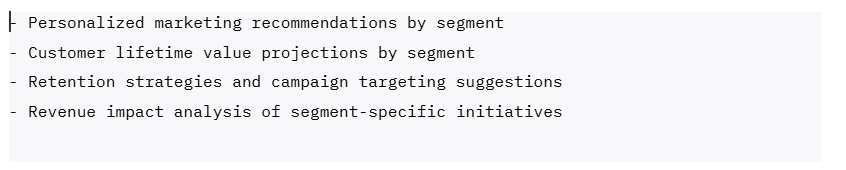
Customer Segmentation Analysis Example:
Advanced Level Projects (Months 4-5)
- Business Valuation and Investment Analysis Model
- Complexity: Multi-scenario DCF model with sensitivity analysis and Monte Carlo simulation
- Financial Modeling: Three-statement integration, working capital analysis, terminal value calculation
- Risk Analysis: Beta calculation, cost of capital determination, probability distributions
- Scenario Planning: Base case, optimistic, and pessimistic scenarios with weighted probability outcomes
- Professional Presentation: Investment committee presentation with executive summary and recommendations
- Automated Reporting and Analytics System
- Technical Challenge: Manual reporting process taking 20+ hours monthly across multiple data sources
- VBA Solution: Automated data extraction, transformation, and report generation system
- Integration: Multiple Excel files, database connections, email automation for distribution
- User Interface: Custom forms for report parameters, error handling, progress indicators
- Business Impact: 90% reduction in reporting time, improved accuracy, real-time availability
Portfolio Presentation and Documentation
Professional Documentation Standards:
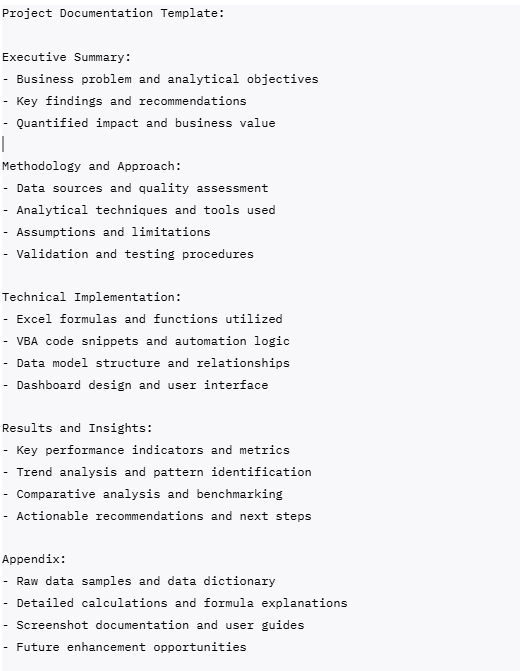
Live Demonstration Portfolio:
- Interactive Dashboards – Real-time demonstrations with scenario testing
- Data Manipulation – Live problem-solving with complex datasets
- VBA Applications – Custom tools and automation demonstrations
- Presentation Skills – Executive-level communication and storytelling with data
📁 Build a job-ready portfolio with our project documentation interview Guide templates & sample dashboards.
6. Job Search Strategy
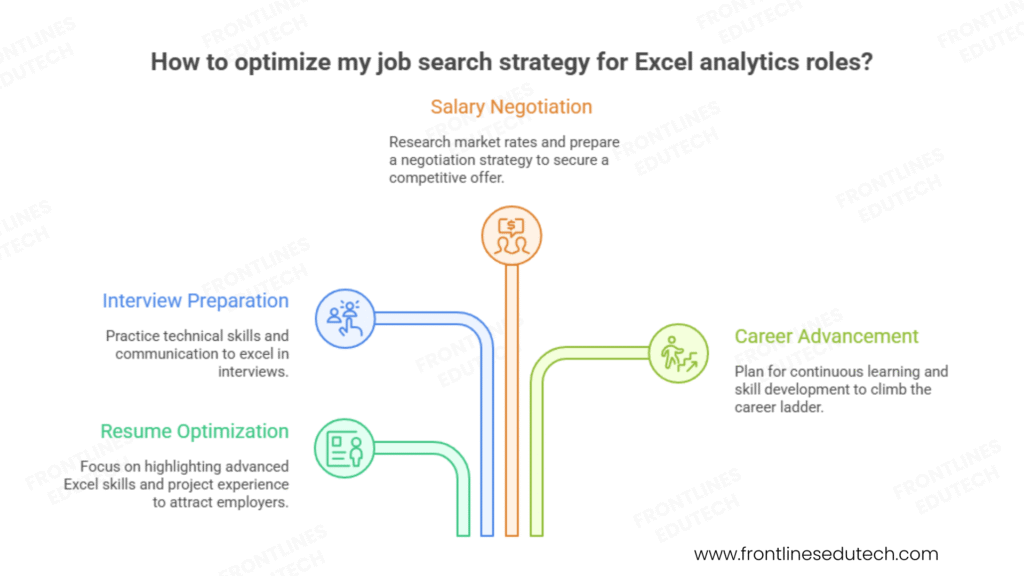
Resume Optimization for Excel Analytics Roles
Technical Skills Section:
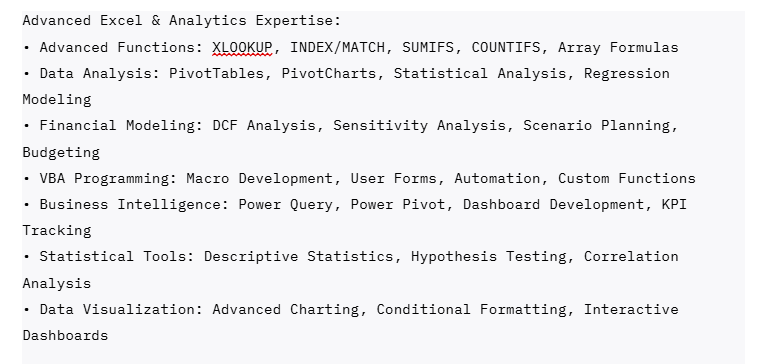
Project Experience Examples:
Financial Planning and Analysis Automation
- Challenge: Monthly financial reporting process requiring 40+ hours of manual work across 15 departments
- Solution: Developed automated Excel-VBA system with Power Query integration for real-time data consolidation
- Technical Implementation: Complex formula arrays, pivot table automation, dashboard with interactive slicers
- Business Impact: Reduced reporting time by 85%, improved accuracy by eliminating manual errors, enabled real-time variance analysis
Customer Profitability Analysis and Segmentation
- Challenge: Sales team lacked visibility into customer profitability and cross-sell opportunities
- Solution: Built comprehensive customer analytics model with RFM analysis, lifetime value calculation, and churn prediction
- Advanced Techniques: Statistical modeling, correlation analysis, Monte Carlo simulation for forecasting
- Results: Identified 15% of customers generating 60% of profit, increased targeted campaign ROI by 240%
Excel Analytics Job Market Analysis
High-Demand Role Categories:
- Financial Analyst (All Levels)
- Salary Range: ₹2.5-18 LPA
- Open Positions: 6,800+ across India
- Key Skills: Financial modeling, budgeting, variance analysis, DCF modeling
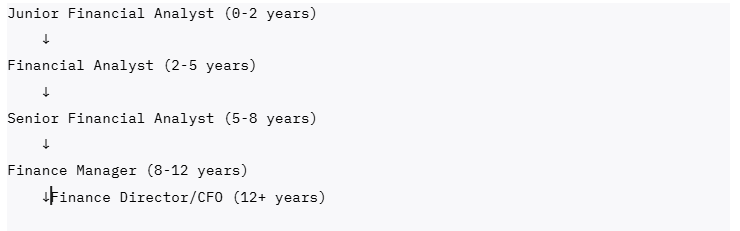
- Growth Path: Analyst → Senior Analyst → Finance Manager → Finance Director
- Business Analyst (Process Focus)
- Salary Range: ₹3-20 LPA
- Open Positions: 8,200+ across India
- Key Skills: Process analysis, requirements gathering, data modeling, dashboard development
- Growth Path: BA → Senior BA → BA Manager → Director of Business Intelligence
- Operations Analyst (Efficiency Focus)
- Salary Range: ₹2.8-15 LPA
- Open Positions: 4,500+ across India
- Key Skills: Process optimization, performance metrics, statistical analysis, automation
- Growth Path: Operations Analyst → Senior Analyst → Operations Manager → VP Operations
- Data Analyst (Analytics Focus)
- Salary Range: ₹3.5-25 LPA
- Open Positions: 7,100+ across India
- Key Skills: Statistical analysis, data visualization, predictive modeling, database management
- Growth Path: Data Analyst → Senior Data Analyst → Data Scientist → Analytics Manager
Top Hiring Companies and Opportunities
Financial Services and Banking:
- HDFC Bank – Financial planning, risk analysis, regulatory reporting, customer analytics
- ICICI Bank – Credit analysis, portfolio management, operational efficiency, performance reporting
- Kotak Mahindra Bank – Investment analysis, wealth management, business intelligence, compliance reporting
- Bajaj Finance – Loan processing analytics, customer segmentation, fraud detection, profitability analysis
Consulting and Professional Services:
- Deloitte – Financial advisory, business transformation, process improvement, data analytics
- EY (Ernst & Young) – Audit analytics, tax optimization, risk management, regulatory compliance
- KPMG – Management consulting, financial analysis, performance improvement, technology implementation
- PwC – Business advisory, data analytics, process optimization, digital transformation
Manufacturing and Operations:
- Tata Motors – Production planning, supply chain optimization, quality analysis, cost management
- Mahindra Group – Business planning, performance analysis, operational efficiency, market research
- L&T – Project management, financial analysis, resource optimization, performance tracking
- Asian Paints – Market analysis, demand forecasting, inventory optimization, pricing analysis
Technology and E-commerce:
- Flipkart – Business intelligence, customer analytics, performance measurement, financial planning
- Amazon India – Operations analysis, vendor management, logistics optimization, market research
- Paytm – Financial analysis, user behaviuor analytics, business performance, regulatory reporting
- Razorpay – Payment analytics, customer insights, business intelligence, compliance reporting
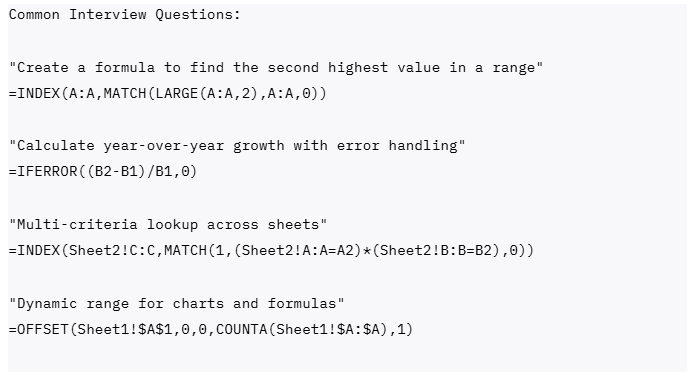
Interview Preparation Framework
Technical Competency Demonstration:
Excel Skills Assessment:
- Live Excel Challenge – Solve complex data analysis problem during interview
- Data cleaning and preparation from messy dataset
- Multi-criteria analysis with advanced formulas
- PivotTable creation with calculated fields and formatting
- Dashboard development with interactive elements
- Formula and Function Mastery
Business Problem-Solving Scenarios:
3. Case Study Analysis – Present solution approach for business challenge
- Revenue decline analysis with multiple potential causes
- Cost optimization opportunities identification
- Customer retention strategy development
- Market expansion feasibility assessment
4.Financial Modelling Questions
- Build simple DCF model during interview
- Explain sensitivity analysis methodology
- Discuss scenario planning approaches
- Validate model assumptions and outputs
Communication and Presentation:
5. Dashboard Presentation – Present portfolio project to interview panel
- Executive summary with key insights
- Technical methodology explanation
- Business impact quantification
- Recommendations and next steps
Salary Negotiation and Career Advancement
Excel Analytics Value Proposition:
- Efficiency Improvements – Demonstrate time savings and process optimization achievements
- Decision Support – Show examples of analysis influencing major business decisions
- Cost Savings – Quantify financial impact of recommendations and optimizations
- Revenue Generation – Highlight analysis that identified growth opportunities or prevented losses
Negotiation Strategy:
Career Advancement Factors:
- Technical Depth – Advanced Excel mastery with VBA programming and BI tool integration
- Business Acumen – Industry knowledge, financial understanding, strategic thinking
- Communication Skills – Executive presentation, stakeholder management, training delivery
- Process Improvement – Efficiency gains, automation development, best practice establishment
- Continuous Learning – Stay current with Excel updates, new analytical techniques, industry trends
🧠 Boost your job chances—Practice Excel Analyst & Business Analyst interview questions.
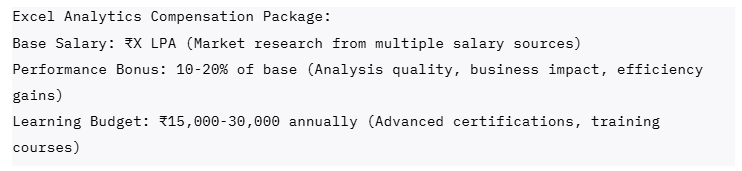
7. Salary Expectations and Career Growth
2025 Compensation Benchmarks by Role and Industry
Financial Analyst Track:
- Junior Financial Analyst (0-2 years): ₹2.5-5 LPA
- Financial Analyst (2-5 years): ₹5-10 LPA
- Senior Financial Analyst (5-8 years): ₹10-16 LPA
- Finance Manager (8+ years): ₹16-25 LPA
Business Analyst Track:
- Business Analyst (0-3 years): ₹3-7 LPA
- Senior Business Analyst (3-6 years): ₹7-14 LPA
- Lead Business Analyst (6-9 years): ₹14-22 LPA
- BA Manager/Director (9+ years): ₹22-35 LPA
Data Analyst Track:
- Data Analyst (0-2 years): ₹3.5-8 LPA
- Senior Data Analyst (2-5 years): ₹8-16 LPA
- Lead Data Analyst (5-8 years): ₹16-28 LPA
- Analytics Manager (8+ years): ₹25-40 LPA
Industry and Geographic Salary Variations
High-Paying Industries:
- Investment Banking and Financial Services – 25-35% premium for complex financial modeling
- Management Consulting – 20-30% premium for strategic analysis and client-facing work
- Technology Companies – 15-25% premium for data-driven product and business analysis
- Pharmaceuticals and Healthcare – 15-20% premium for regulatory compliance and clinical data analysis
Geographic Salary Distribution:
- Mumbai – Financial services hub, 15-25% above national average for finance roles
- Bangalore – Technology center, 12-18% above average for business and data analyst roles
- Delhi/NCR – Corporate headquarters location, 10-15% above average across all roles
- Pune – Growing business services center, 5-12% above national average
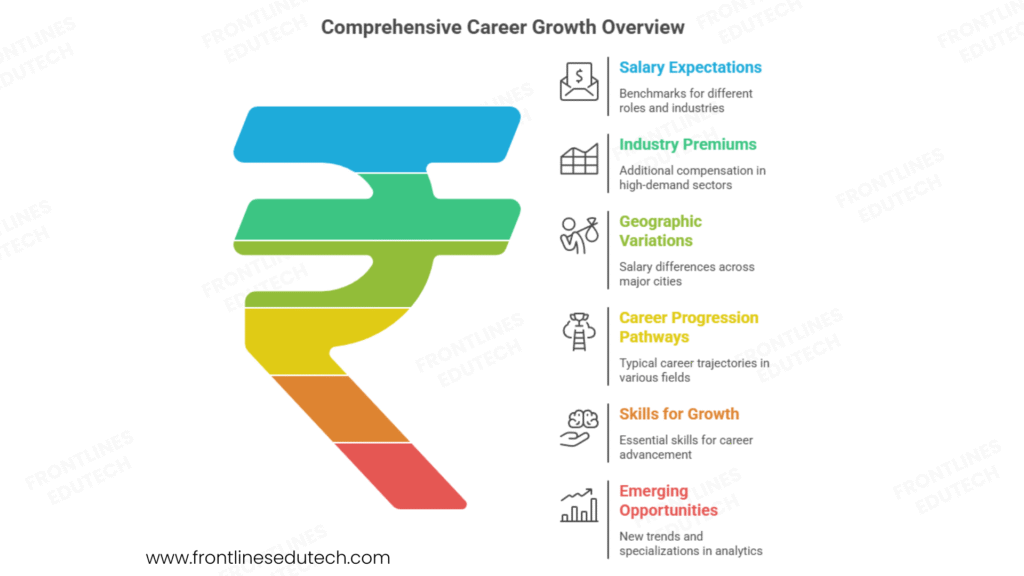
Career Progression Pathways
Financial Analysis Track:
Business Intelligence Track:

Consulting and Freelance Track:
Skills for Accelerated Career Growth
Technical Mastery (Years 1-3):
- Advanced Excel Functions – Master complex formulas, array functions, statistical analysis
- VBA Programming – Automation development, custom functions, user interface design
- Data Visualization – Dashboard design, chart mastery, storytelling with data
- Financial Modelling – DCF analysis, scenario planning, sensitivity analysis
Business and Analytical Skills (Years 3-6):
- Industry Knowledge – Deep understanding of specific business verticals and processes
- Statistical Analysis – Hypothesis testing, regression analysis, predictive modelling
- Database Skills – SQL querying, data extraction, database design concepts
- Project Management – Analysis project planning, stakeholder management, delivery excellence
Leadership and Strategy (Years 6+):
- Team Leadership – Analyst mentoring, project coordination, resource management
- Strategic Thinking – Business strategy support, competitive analysis, market research
- Stakeholder Management – Executive communication, requirement gathering, change management
- Technology Integration – BI tool implementation, process automation, digital transformation
Emerging Opportunities and Future Trends
High-Growth Excel Analytics Specializations:
- Financial Planning and Analysis (FP&A) – Strategic financial modelling and business partnering
- Business Intelligence and Dashboards – Self-service analytics and executive reporting
- Process Automation and RPA – Workflow optimization and robotic process automation
- Customer Analytics and CRM – Customer behavior analysis and relationship management
- Supply Chain Analytics – Operations optimization and demand forecasting
Market Trends Creating New Opportunities:
- Citizen Data Science – Empowering business users with self-service analytics capabilities
- Cloud-Based Analytics – Excel 365 integration with cloud platforms and real-time data
- AI-Powered Insights – Machine learning integration with traditional Excel analysis
- Regulatory Compliance Analytics – Data governance, audit trails, and compliance reporting
8. Success Stories from Our Students
Rajesh Patel – From Accounts Executive to Financial Planning Manager
Background: 5 years as accounts executive with basic Excel skills and manual reporting processes
Challenge: Limited growth in traditional accounting role, wanted to transition to strategic financial analysis
Transformation Strategy: Advanced Excel mastery with focus on financial modeling and automation
Timeline: 8 months from course completion to financial planning role
Current Position: Manager – Financial Planning & Analysis at Mahindra Finance
Salary Progression: ₹4.2 LPA → ₹6.8 LPA → ₹11.5 LPA → ₹17.2 LPA (over 22 months)
Rajesh’s Excel Specialization Strategy:
- Financial Modeling Focus – Built expertise in DCF analysis, budgeting, and variance analysis
- Automation Excellence – Developed VBA solutions reducing monthly reporting time by 75%
- Dashboard Development – Created executive dashboards providing real-time business insights
- Business Partnership – Transitioned from data provider to strategic business partner
Key Success Factors:
- Practical Application – “I automated every manual process I encountered, building a reputation as the ‘Excel expert’ who could solve any analytical challenge.”
- Business Impact Focus – “I learned to frame my analysis in terms of business outcomes, not just technical accuracy. Every model I built had to drive a specific business decision.”
- Continuous Learning – “I spent 1 hour daily learning new techniques and stayed current with Excel updates and new features.”
Current Impact: Leading financial planning for ₹15,000+ crore loan portfolio, providing analysis supporting ₹500+ crore annual lending decisions, mentoring team of 6 financial analysts.
Priya Sharma – From Manual Data Entry to Business Intelligence Lead
Background: 3 years in data entry and basic administrative work with limited analytical exposure
Challenge: Repetitive work with no growth opportunities, wanted to transition to analytical career
Strategic Focus: Business intelligence specialization with advanced Excel and Power BI integration
Timeline: 12 months from basic Excel to BI leadership position
Career Trajectory: Data Entry → Excel Analyst → Business Analyst → BI Lead
Current Role: Business Intelligence Lead at Flipkart
Compensation and Skill Growth:
- Pre-transition: ₹2.8 LPA (Data entry clerk)
- 6 months: ₹5.2 LPA (Excel analyst at mid-size company)
- 12 months: ₹8.9 LPA (Business analyst with dashboard specialization)
- Current: ₹16.8 LPA + bonuses (BI Lead at Flipkart)
Priya’s BI Transformation:
- Technical Excellence – Mastered advanced Excel, VBA, Power Query, and Power BI
- Domain Expertise – Developed deep understanding of e-commerce metrics and customer analytics
- Process Innovation – Designed self-service analytics platform reducing report requests by 60%
- Team Leadership – Built and led team of 4 analysts supporting multiple business units
Business Intelligence Achievements:
- Executive Reporting – Created automated executive dashboard providing real-time business KPIs
- Customer Analytics – Developed customer segmentation models improving marketing campaign ROI by 35%
- Operational Efficiency – Built supply chain analytics reducing inventory costs by ₹8 crores annually
- Self-Service Analytics – Implemented user-friendly dashboards enabling business teams to access insights independently
Success Philosophy: “Excel was my gateway to understanding how businesses use data. By combining technical skills with business curiosity, I transformed from a cost center to a strategic asset that drives business decisions.”
Amit Kumar – From Engineering to Financial Consulting Entrepreneur
Background: 4 years as mechanical engineer with strong analytical mindset but limited business exposure
Challenge: Wanted to leverage analytical skills in business context and eventually start own practice
Entrepreneurial Vision: Building financial modeling and business analytics consultancy
Timeline: 14 months from Excel basics to established consulting practice
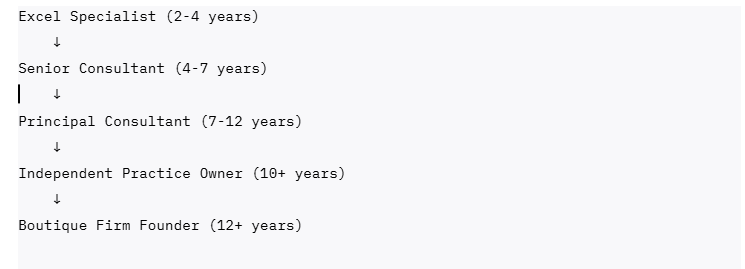
Business Evolution: Engineer → Excel Specialist → Financial Analyst → Independent Consultant
Revenue and Business Growth:
- Months 1-6: ₹6.5 LPA (Financial analyst at manufacturing company)
- Months 7-12: ₹85,000/month (Part-time consulting while employed)
- Months 13-18: ₹1,45,000/month (Full-time independent consultant)
- Current: ₹2,25,000/month (Established practice with recurring clients)
Amit’s Consulting Business Model:
- Manufacturing Focus – Specialized in cost analysis, production optimization, and financial planning for manufacturing companies
- Complete Solutions – Offer analysis, modeling, dashboard development, and training services
- Value-Based Pricing – Price based on business impact rather than hourly rates
- Long-Term Relationships – Focus on ongoing advisory relationships rather than one-time projects
Client Success Stories:
- Cost Reduction Analysis – Helped automotive parts manufacturer identify ₹2.4 crore annual cost savings
- Production Optimization – Developed capacity planning model increasing utilization by 18%
- Investment Analysis – Built DCF models for equipment purchases, preventing ₹5 crore poor investment
- Dashboard Implementation – Created real-time production dashboards improving decision-making speed by 40%
Entrepreneurial Insights: “My engineering background gave me credibility with manufacturing clients, but Excel and financial modeling skills allowed me to provide strategic value beyond technical analysis. The combination of domain knowledge and analytical expertise created a unique market position.”
👉Frontlines Edutech offers an AI-powered Advanced Excel course in Telugu and English with low fees, live classes, and real projects. Learn VLOOKUP/XLOOKUP, PivotTables, Charts, and Macros/VBA using AI tools (like ChatGPT) with interview prep, flexible schedules, recordings, and placement guidance for job-ready skills. The course provides a complete path from beginner to a professional Excel Data Analyst.
9. Common Challenges and Solutions
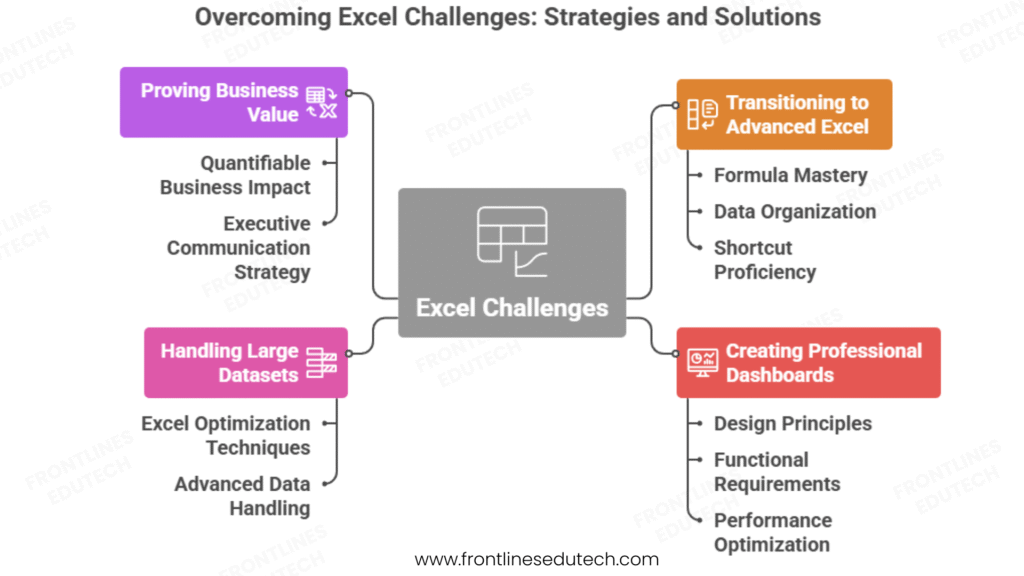
Challenge 1: Transitioning from Basic to Advanced Excel Usage
Problem: Many professionals know basic Excel but struggle with advanced functions and analytical techniques
Impact: Limited career growth, manual processes, difficulty with complex analysis requirements
Symptoms: Over-reliance on basic formulas, manual data manipulation, inability to handle large datasets
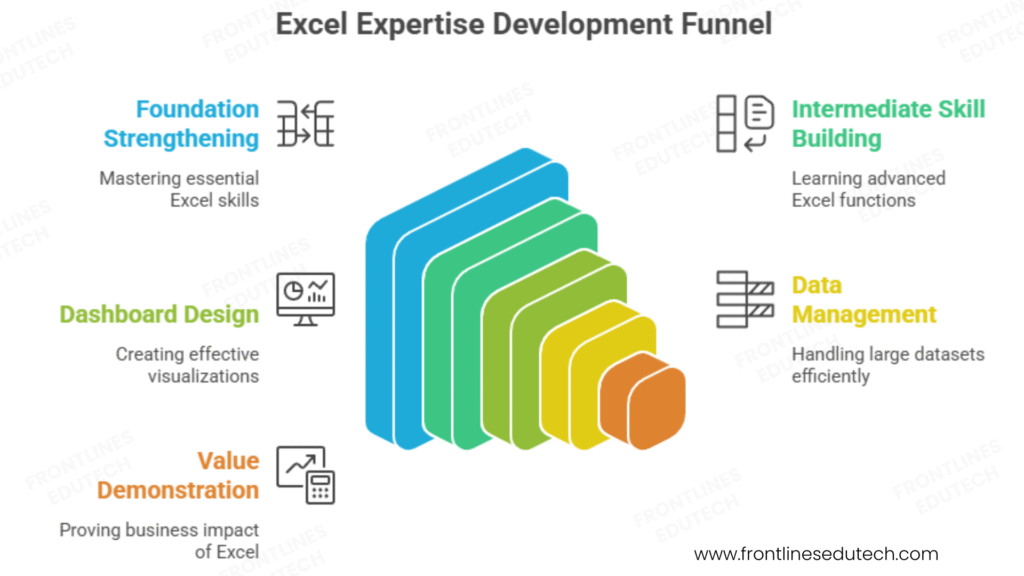
Systematic Progression Strategy:
Phase 1: Foundation Strengthening (2-3 weeks)
- Formula Mastery – Master relative vs absolute references, nested functions, error handling
- Data Organization – Learn proper data structure, table formatting, named ranges
- Shortcut Proficiency – Keyboard shortcuts for efficiency, navigation techniques
- Function Categories – Understand lookup, statistical, financial, date/time function groups
Phase 2: Intermediate Skill Building (4-6 weeks)
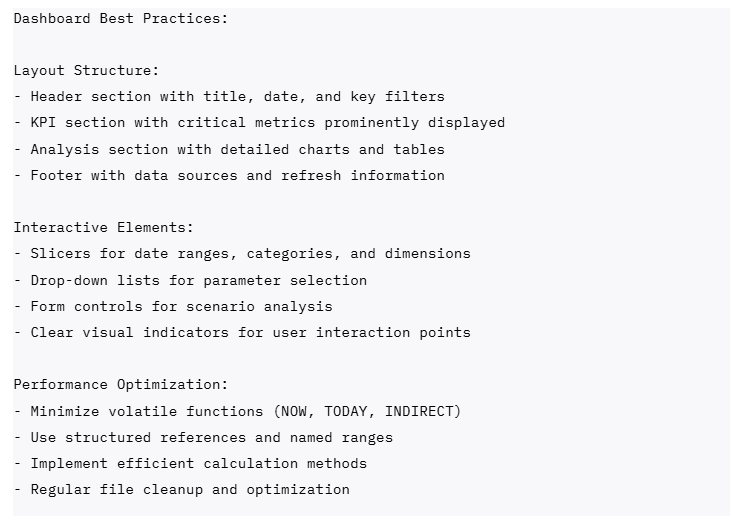
Challenge 2: Creating Professional Dashboards and Visualizations
Problem: Difficulty designing visually appealing and functionally effective dashboards
Challenge: Poor color choices, cluttered layouts, non-intuitive navigation, lack of interactivity
Solution: Systematic approach to dashboard design and visualization principles
Dashboard Design Framework:
Design Principles:
- Visual Hierarchy – Use size, color, and position to guide attention to most important information
- Color Theory – Consistent color scheme with meaningful color coding for different data types
- White Space – Adequate spacing between elements for readability and professional appearance
- Consistency – Standardized fonts, colors, and formatting throughout the dashboard
Functional Requirements:
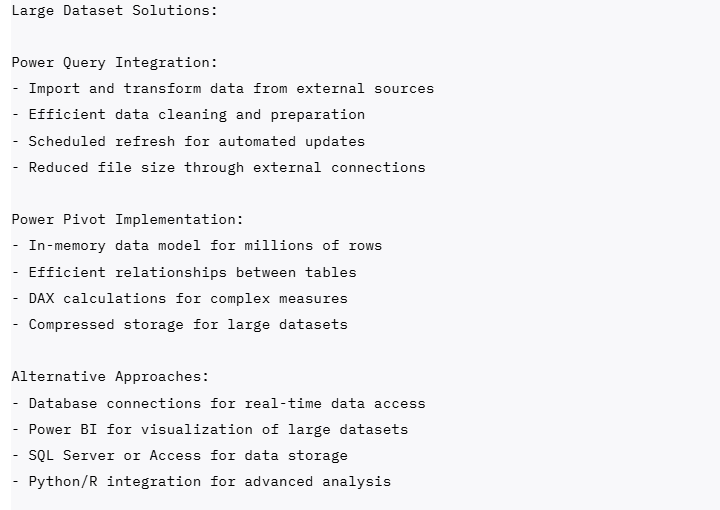
Challenge 3: Handling Large Datasets and Performance Issues
Problem: Excel performance degradation with large datasets, memory issues, slow calculations
Impact: Frustration with slow response times, file corruption risks, inability to handle business-scale data
Solution: Data management techniques and alternative approaches for large datasets
Large Data Management Strategies:
Excel Optimization Techniques:
- Calculation Settings – Manual calculation mode during data manipulation
- Formula Optimization – Replace VLOOKUP with INDEX/MATCH, avoid volatile functions
- Data Structure – Proper table formatting, remove unnecessary formatting and objects
- File Management – Regular file cleanup, remove unused ranges and sheets
Advanced Data Handling
Challenge 4: Proving Business Value and ROI of Excel Expertise
Problem: Difficulty quantifying the business impact of Excel analysis and automation
Challenge: Management perception of Excel as “just spreadsheets” rather than strategic tool
Solution: Business impact measurement and communication strategies
Value Demonstration Framework:
Quantifiable Business Impact:
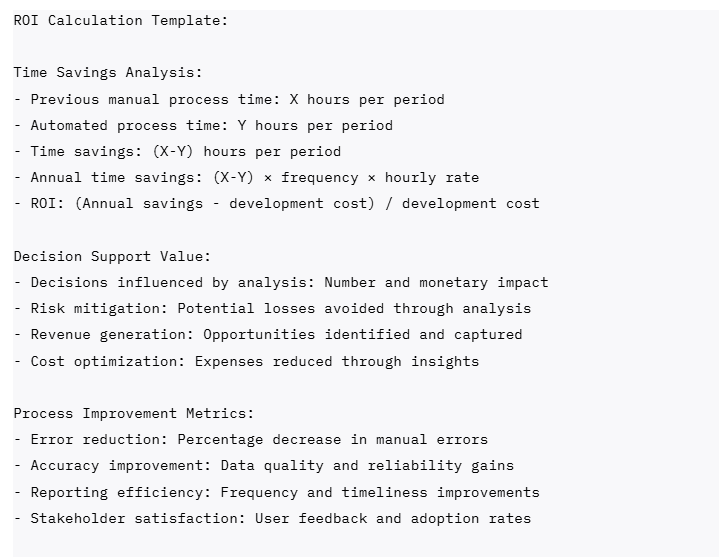
Executive Communication Strategy:
- Business Language – Frame technical achievements in business terms and outcomes
- Visual Presentation – Use charts and dashboards to communicate impact clearly
- Success Stories – Document specific examples of analysis driving business decisions
Continuous Value – Regular reporting on ongoing benefits and improvements
10. Your Next Steps
Week 1: Assessment and Foundation Setup
Day 1-2: Skill Assessment and Goal Setting
- Current Skill Evaluation – Take online Excel assessment to identify knowledge gaps
- Career Goal Definition – Choose focus area (financial analysis, business analysis, data analysis)
- Learning Environment Setup – Excel 365 installation, sample data downloads, practice files
- Resource Gathering – Bookmark learning websites, download templates, join Excel communities
Day 3-4: Basic Skills Reinforcement
- Formula Review – Practice basic formulas, absolute/relative references, error handling
- Data Organization – Learn table formatting, data validation, sorting and filtering
- Function Exploration – Explore function categories, understand syntax and arguments
- Keyboard Shortcuts – Master essential shortcuts for navigation and efficiency
Day 5-7: Learning Path Planning
- Study Schedule Creation – Allocate daily practice time and weekend project work
- Project Planning – Identify practice datasets and analysis scenarios
- Community Engagement – Join Excel forums, LinkedIn groups, local meetups
- Mentor Identification – Find experienced Excel professionals for guidance
Month 1: Intermediate Functions and Analysis Techniques
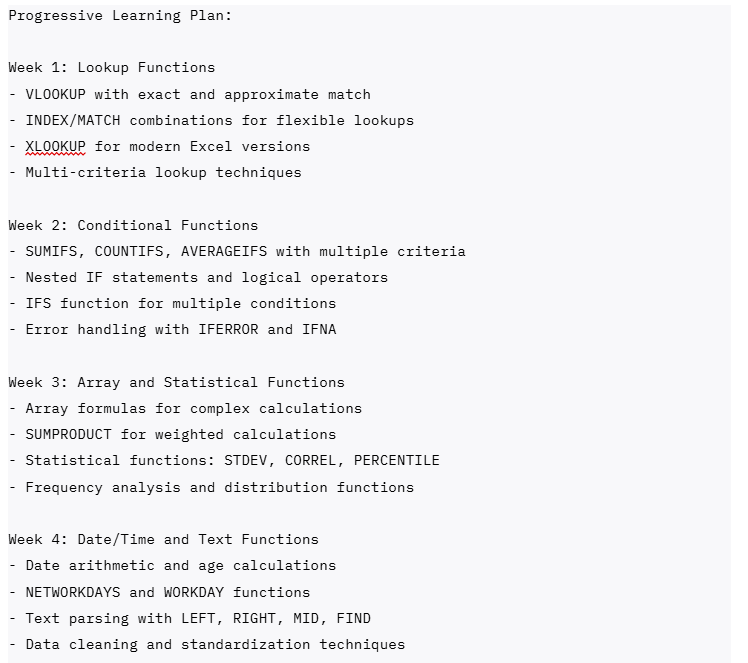
Week 1-2: Advanced Functions Mastery
- Lookup Functions – VLOOKUP, INDEX/MATCH, XLOOKUP with multiple criteria
- Conditional Functions – SUMIFS, COUNTIFS, nested IF statements with complex logic
- Array Formulas – Traditional arrays and dynamic arrays for complex calculations
- Error Handling – IFERROR, IFNA, and validation techniques for robust formulas
Week 3-4: Data Analysis and PivotTables
- PivotTable Mastery – Multi-dimensional analysis, calculated fields, custom calculations
- Data Visualization – Advanced charting techniques, formatting, and presentation
- Statistical Analysis – Descriptive statistics, correlation, basic regression analysis
- What-If Analysis – Goal Seek, Scenario Manager, Data Tables for sensitivity analysis
Month-End Project: “Personal Finance Analysis Dashboard”
- Comprehensive budget tracking with multiple income sources and expense categories
- Trend analysis with forecasting and goal tracking
- Interactive dashboard with slicers and conditional formatting
- Automated monthly reporting with variance analysis
Month 2: Financial Modelling and Business Analysis
Week 1-2: Financial Modelling Fundamentals
- Time Value of Money – PV, FV, PMT, RATE, NPER functions for financial calculations
- Investment Analysis – NPV, IRR, payback period calculations
- Loan Analysis – Amortization schedules, payment calculations, refinancing analysis
- Basic Business Modelling – Revenue forecasting, expense budgeting, profitability analysis
Week 3-4: Advanced Analysis Techniques
- Scenario and Sensitivity Analysis – Multiple scenario modelling with data tables
- Monte Carlo Simulation – Risk analysis and probability distributions
- Regression Analysis – Trend analysis, forecasting, relationship identification
- Break-Even Analysis – Fixed vs variable costs, margin analysis, operational leverage
Professional Development Focus:
- Business Case Development – Learn to frame analysis in business terms
- Presentation Skills – Create executive-ready charts and summaries
- Industry Knowledge – Study business metrics and KPIs in chosen field
- Stakeholder Communication – Practice explaining technical analysis to non-technical audiences
Month 3: Automation and Advanced Applications
Week 1-2: VBA Programming Introduction
- VBA Environment – Visual Basic Editor, recording macros, editing recorded code
- Programming Basics – Variables, loops, conditional statements, functions
- Excel Object Model – Workbook, worksheet, range manipulation
- User Interface – Input boxes, message boxes, simple user forms
Week 3-4: Advanced Excel Integration
- Power Query – Data extraction, transformation, and loading from multiple sources
- External Data Connections – Database connectivity, web queries, API integration
- Collaboration Features – Shared workbooks, protection, version control
- Professional Templates – Reusable models, documentation, user guides
Advanced Learning Goals:
- Portfolio Development – Create 3-4 comprehensive analysis projects
- Certification Preparation – Microsoft Excel Expert certification study
- Professional Network – Connect with Excel professionals and potential mentors
- Job Market Research – Identify target companies and role requirements
Long-Term Milestones (6-12 Months)
Professional Expertise and Recognition:
- Microsoft Excel Expert Certification – Validate advanced skills with industry-recognized credential
- Specialized Knowledge – Deep expertise in chosen domain (finance, operations, marketing)
- Teaching and Mentoring – Help others learn Excel skills through formal or informal training
- Thought Leadership – Write articles, create tutorials, speak at professional events
Career Development and Transition:
- Portfolio Completion – 5-7 comprehensive projects demonstrating various skills and applications
- Professional Network – Active relationships with hiring managers, recruiters, and industry professionals
- Job Search Preparation – Optimized resume, interview preparation, salary research
- Career Advancement – Promotion in current role or successful transition to target position
Continuous Learning and Growth:
- Advanced Tools Integration – Power BI, Tableau, SQL, Python for expanded analytical capabilities
- Industry Specialization – Deep knowledge of specific business vertical or functional area
- Leadership Development – Team management, project leadership, strategic planning skills
- Entrepreneurial Opportunities – Consulting, training, or starting analytics-focused business

Conclusion
Advanced Excel and business analytics represents one of the most practical and immediately applicable skill sets in today’s data-driven business environment. Unlike many specialized technical fields that require extensive background knowledge, Excel expertise builds upon familiar tools while providing increasingly sophisticated analytical capabilities that directly impact business outcomes.
The journey from basic Excel user to advanced business analyst typically requires 3-5 months of dedicated learning and practice, but the investment delivers immediate value through improved job performance and long-term career advancement opportunities. Excel skills are universally transferable across industries and functions, making them among the most secure and versatile capabilities in business.
Critical Success Factors for Excel Analytics Excellence:
- Practical Application Focus – Apply new skills immediately to real business problems and datasets
- Business Context Understanding – Frame technical analysis in terms of business decisions and outcomes
- Continuous Skill Building – Progress systematically from basic functions to advanced modeling and automation
- Professional Presentation – Develop ability to communicate insights clearly to both technical and non-technical audiences
- Industry Knowledge Integration – Combine Excel expertise with deep understanding of specific business domains
The most successful Excel professionals combine technical proficiency with analytical thinking and business communication skills. As organizations continue to generate increasing amounts of data while seeking faster, more accurate decision-making support, Excel experts who can bridge technical analysis with strategic business insight will be most valued.
Whether you choose financial analysis specialization, business intelligence focus, operations optimization, or general business analysis, Excel expertise provides a solid foundation for diverse career opportunities including management consulting, financial planning, business intelligence, and analytical leadership roles.
Ready to transform your career through advanced Excel mastery and business analytics expertise?
Explore our comprehensive Advanced Excel & Business Analytics Program designed for professionals seeking analytical career advancement:
 3-month intensive curriculum covering advanced functions, financial modelling, VBA programming, and business intelligence
- Hands-on project portfolio with real business scenarios, financial models, and automated dashboards
- Microsoft Excel Expert certification preparation with practice exams and expert guidance
- Industry-specific applications including financial analysis, operations optimization, and marketing analytics
- Job placement assistance with resume optimization, interview coaching, and employer connections
- Professional mentorship from experienced business analysts and financial modelling experts
- Lifetime learning support including Excel updates, advanced techniques, and career development guidance
Unsure which Excel specialization aligns with your career goals and industry background? Schedule a free Excel career consultation with our business analytics experts to receive personalized guidance and a customized learning plan.
Connect with our Excel analytics community: Join our Excel & Business Analytics WhatsApp Group with 290+ students, alumni, and working analysts for daily learning support, formula sharing, and career guidance.