How to Become a Power BI Developer: Complete Career Guide [₹9L Average Salary]

Master BI and transform data into actionable insights using power bi
Power BI developers are experiencing unprecedented demand as organizations prioritize data-driven decision making, with average salaries ranging from ₹4-15 LPA in India and senior professionals earning ₹20+ LPA. As companies generate more data than ever before, the ability to transform raw information into compelling visualizations and actionable insights has become one of the most valuable skills in the modern workplace.
Whether you’re an Excel power user looking to upgrade your skills, a business analyst seeking technical depth, or a fresh graduate entering the analytics field, this comprehensive guide provides the exact roadmap to building a successful Power BI career. Having trained over 400 Power BI professionals at Frontlines EduTech with an 89% job placement rate, I’ll share the proven strategies that consistently deliver results in 2025.
What you’ll master in this guide:
- Complete Power BI learning roadmap from beginner to expert
- Essential SQL skills and data modeling techniques
- Portfolio projects that showcase real business impact
- Job search strategies and interview preparation frameworks
- Salary benchmarks and career advancement opportunities
🚀Want to Become a Job-Ready Power BI Developer? Explore All Resources Here →
1. What is Power BI Development?
Power BI development involves creating business intelligence solutions that transform raw data into meaningful insights through interactive dashboards, reports, and data models. Power BI developers combine technical skills in data extraction, transformation, and loading (ETL) with business acumen to create solutions that drive strategic decision-making across organizations.
Core Components of Power BI Development:
Data Integration and Modeling:
- Data Source Connectivity – Connect to databases, files, cloud services, APIs
- Data Transformation – Clean, shape, and prepare data using Power Query
- Data Modeling – Create relationships, hierarchies, and calculated columns
- Performance Optimization – Efficient data models for fast query response
Advanced Analytics and Calculations:
- DAX (Data Analysis Expressions) – Create complex calculations and measures
- Time Intelligence – Year-over-year, month-over-month comparisons
- Statistical Analysis – Trends, forecasting, and predictive analytics
- Custom Functions – Reusable business logic and calculations
Visualization and User Experience:
- Interactive Dashboards – Dynamic visualizations with drill-down capabilities
- Custom Visuals – Specialized charts and graphics for specific needs
- Mobile Optimization – Responsive design for mobile and tablet devices
- User Access Control – Row-level security and content management
Power BI Ecosystem:
Power BI Desktop – Development environment for creating reports and data models
Power BI Service – Cloud platform for sharing, collaboration, and administration
Power BI Mobile – Mobile apps for iOS, Android, and Windows devices
Power BI Embedded – Integration capabilities for custom applications
Power BI Premium – Enterprise features including AI capabilities and large datasets
📈 Power BI is booming! Start Your Learning Journey with Our Beginner-Friendly Course →
2. Why Choose Power BI ?
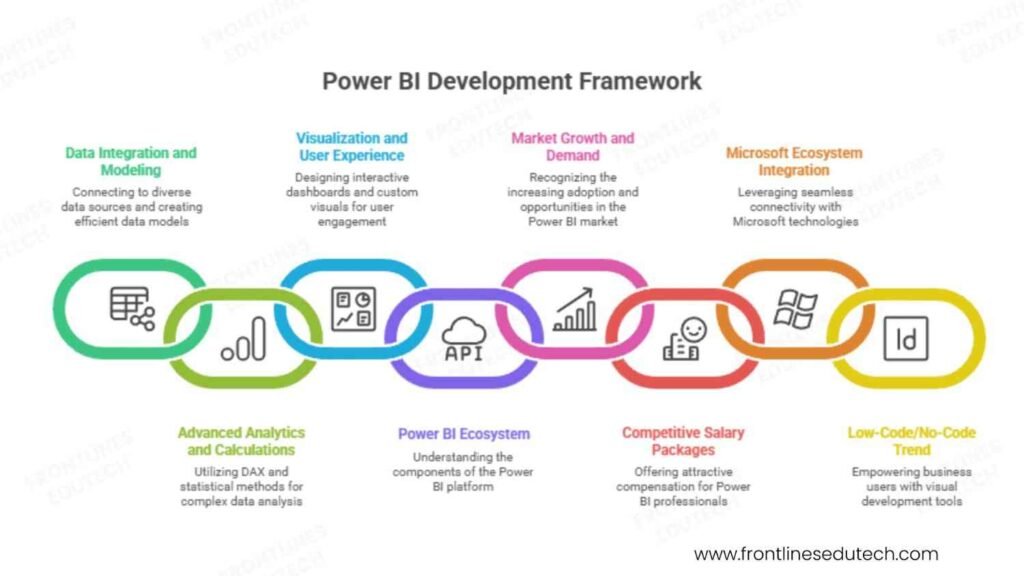
Explosive Market Growth and Demand
According to Gartner’s Magic Quadrant for Analytics and BI Platforms 2025, Microsoft Power BI continues to lead the market with the highest growth rate in user adoption. In India specifically, Power BI adoption has grown by 156% year-over-year, driven by:
Digital Transformation Initiatives:
- Banking: HDFC Bank, ICICI Bank, State Bank of India implementing enterprise BI
- Retail: Reliance, Future Group, Big Basket leveraging customer analytics
- Manufacturing: Tata Motors, Mahindra, L&T using operational intelligence
- Healthcare: Apollo Hospitals, Fortis, Max Healthcare adopting patient analytics
Government and Public Sector:
- Digital India initiatives requiring data transparency and reporting
- Smart city projects needing real-time monitoring dashboards
- Educational institutions implementing student performance analytics
Competitive Salary Packages and Job Security
Power BI professionals command premium salaries due to the specialized skill set:
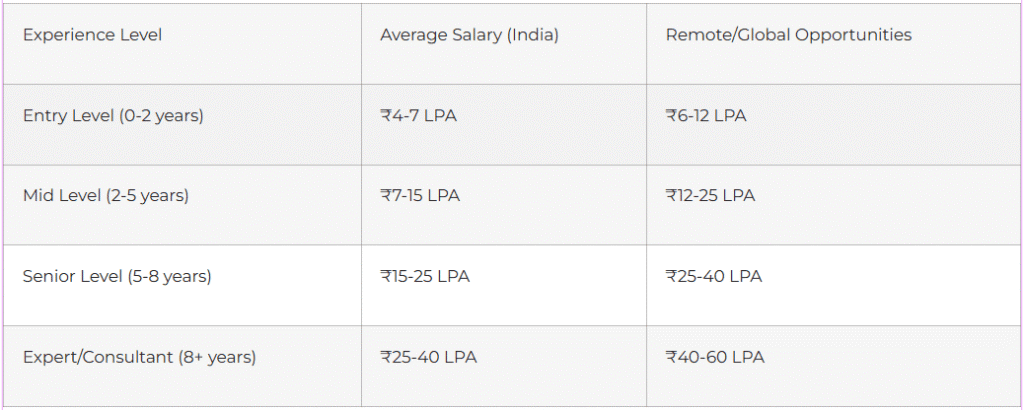
Source: PayScale India 2025 and Indeed Salary Insights
Microsoft Ecosystem Integration Advantage
Power BI’s deep integration with Microsoft technologies creates additional career opportunities:
- Office 365 Integration – Excel, SharePoint, Teams connectivity
- Azure Cloud Services – Scalable data storage and processing
- Microsoft 365 Adoption – Organizations already using Microsoft stack
- AI and Machine Learning – Built-in cognitive services and Azure ML integration
Low-Code/No-Code Trend Alignment
Power BI’s visual development approach aligns with the growing demand for citizen developers:
- Business User Empowerment – Non-technical users can create basic reports
- IT Department Efficiency – Reduced backlog for simple reporting requests
- Faster Time-to-Insight – Rapid prototype and deployment capabilities
- Cost-Effective Solutions – Lower development costs compared to custom BI solutions
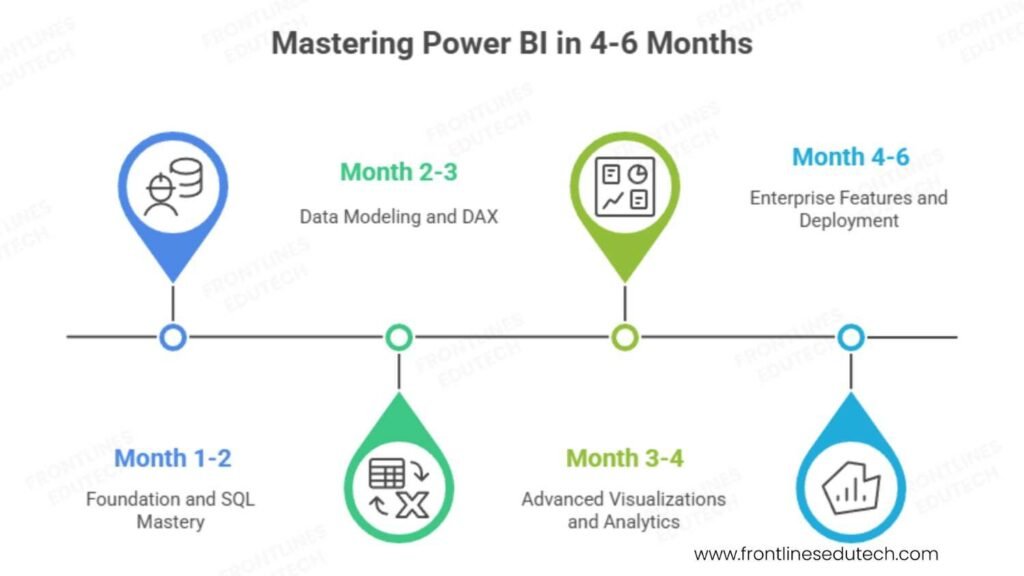
3. Complete Learning Roadmap (4-6 Months)
🤔Confused About Where to Start? See Our Step-by-Step Power BI Roadmap →
Phase 1: Foundation and SQL Mastery (Month 1-2)
SQL Fundamentals (3-4 weeks)
Understanding SQL is crucial for Power BI success as it forms the foundation of data manipulation:
- Basic Queries – SELECT, WHERE, ORDER BY, GROUP BY operations
- Joins and Relationships – INNER, LEFT, RIGHT, FULL OUTER joins
- Aggregate Functions – SUM, COUNT, AVG, MAX, MIN with GROUP BY
- Advanced SQL – Subqueries, CTEs, window functions, CASE statements
- Database Concepts – Normalization, indexes, performance optimization
Practical SQL Projects:
- Sales Analysis Database – Create tables for products, customers, orders
- Employee Performance Queries – Complex joins across HR tables
- Financial Reporting Scripts – Year-over-year and period comparisons
Power BI Basics (2-3 weeks)
- Interface Navigation – Ribbon, fields pane, visualizations, filters
- Data Import Methods – Excel, CSV, databases, web sources
- Basic Visualizations – Charts, tables, cards, maps
- Filtering and Slicing – Report-level, page-level, visual-level filters
Phase 2: Data Modeling and DAX (Month 2-3)
Advanced Data Modeling (3-4 weeks)
- Star Schema Design – Fact tables, dimension tables, relationships
- Data Types and Categories – Proper data categorization for optimal performance
- Calculated Columns vs Measures – When and how to use each approach
- Relationship Management – Active/inactive relationships, cross-filter direction
- Performance Optimization – Reducing model size, query optimization
DAX Programming Mastery (4-5 weeks)
DAX (Data Analysis Expressions) is the heart of Power BI calculations:
- Basic DAX Functions – SUM, AVERAGE, COUNT, DISTINCT operations
- Filter Context – Understanding row context vs filter context
- Time Intelligence – TOTALYTD, SAMEPERIODLASTYEAR, DATESYTD
- Advanced Functions – CALCULATE, FILTER, ALL, VALUES, RELATED
- Complex Measures – KPIs, ratios, percentages, running totals
Real-World DAX Examples:
// Year-over-Year Growth Calculation
YoY Growth % =
VAR CurrentYear = SUM(Sales[Amount])
VAR PreviousYear = CALCULATE(
SUM(Sales[Amount]),
SAMEPERIODLASTYEAR(Calendar[Date])
)
RETURN
DIVIDE(CurrentYear – PreviousYear, PreviousYear, 0)
Phase 3: Advanced Visualizations and Analytics (Month 3-4)
Advanced Visualization Techniques (3-4 weeks)
- Custom Visuals – Third-party and community visualizations
- Conditional Formatting – Dynamic colors, data bars, icons
- Drill-Through and Drill-Down – Interactive navigation between reports
- Bookmarks and Selection – Creating guided analytical experiences
- Mobile Layout Design – Optimizing reports for mobile devices
Power Query and ETL (2-3 weeks)
- Data Transformation – Cleaning, shaping, and merging data sources
- Custom Functions – Reusable data processing logic
- Parameters and Dynamic Sources – Flexible data source configurations
- Performance Optimization – Query folding, data refresh strategies
Advanced Analytics Integration:
- R and Python Scripts – Statistical analysis and machine learning
- Azure Machine Learning – Predictive analytics integration
- Quick Insights – AI-powered automatic insight generation
- Q&A Feature – Natural language query capabilities
Phase 4: Enterprise Features and Deployment (Month 4-6)
Power BI Service and Administration (2-3 weeks)
- Workspace Management – App workspaces, content sharing, collaboration
- Security Implementation – Row-level security, app permissions
- Gateway Configuration – On-premises data connectivity
- Monitoring and Usage – Usage metrics, performance monitoring
Advanced Enterprise Features (2-3 weeks)
- Dataflows – Self-service data preparation at enterprise scale
- Composite Models – Combining DirectQuery and import data
- Aggregations – Performance optimization for large datasets
- Deployment Pipelines – Development, test, production workflows
Integration and Automation (1-2 weeks)
- Power Automate Integration – Automated data refresh and alerts
- SharePoint and Teams – Embedded analytics in collaboration platforms
- REST APIs – Programmatic access to Power BI content
- PowerShell Administration – Bulk operations and automation
💡Master SQL + DAX Faster! Check Our Practical ‘Interview Guides’ for Power BI Learners→
4. Essential Tools and Technologies
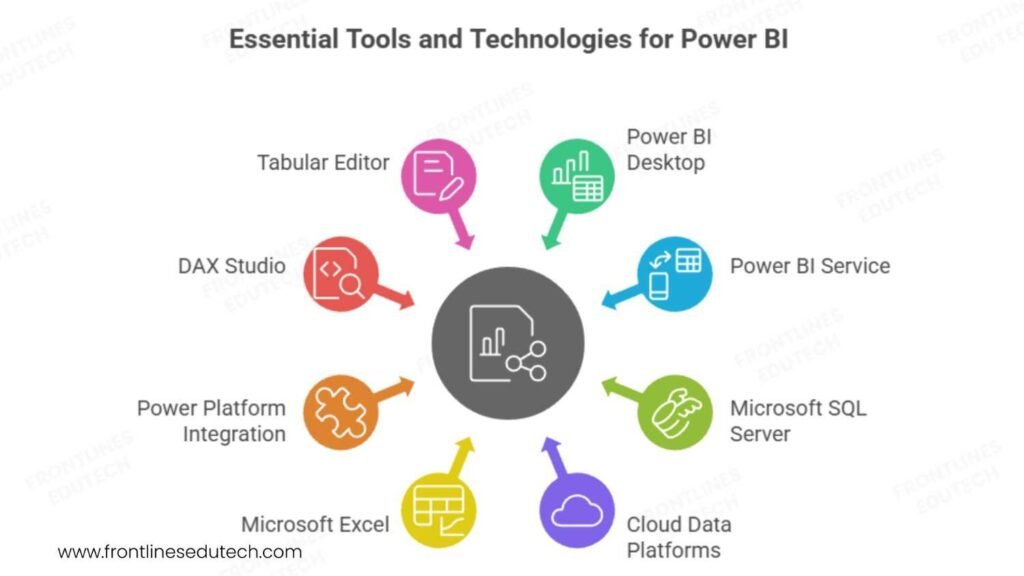
Core Power BI Stack
Power BI Desktop
- Free Development Tool – Complete development environment
- Monthly Updates – New features and improvements released regularly
- Offline Development – Work without internet connectivity
- Version Control – Integration with Git and Azure DevOps
Power BI Service (Cloud)
- Collaboration Platform – Share reports and dashboards with stakeholders
- Scheduled Refresh – Automatic data updates
- Mobile Access – iOS and Android applications
- Enterprise Security – Row-level security, Azure AD integration
Database and Data Sources
Microsoft SQL Server
- Primary Database Platform – Tight integration with Power BI
- SQL Server Analysis Services – Multidimensional and tabular models
- SQL Server Reporting Services – Traditional reporting integration
Cloud Data Platforms:
- Azure SQL Database – Cloud-based relational database
- Azure Synapse Analytics – Data warehouse and big data analytics
- Azure Data Lake – Scalable data storage for analytics workloads
- Cosmos DB – NoSQL database for modern applications
Complementary Technologies
Microsoft Excel
- Data Source – Excel workbooks as data input
- Report Enhancement – Excel integration for detailed analysis
- Prototype Development – Quick proof-of-concept creation
Power Platform Integration:
- Power Apps – Custom applications with embedded Power BI
- Power Automate – Workflow automation and data refresh
- Power Virtual Agents – Chatbots with data-driven responses
Development and Productivity Tools
DAX Studio
- Query Performance Analysis – Optimize DAX calculations
- Model Documentation – Generate data model documentation
- Advanced Debugging – Detailed query execution analysis
Tabular Editor
- Advanced Model Management – Bulk operations on tabular models
- Metadata Manipulation – Direct editing of model properties
- Deployment Automation – Scripted model deployments
🚀Level Up Your BI Skills! Explore More Power BI Roadmaps & Skill Paths →
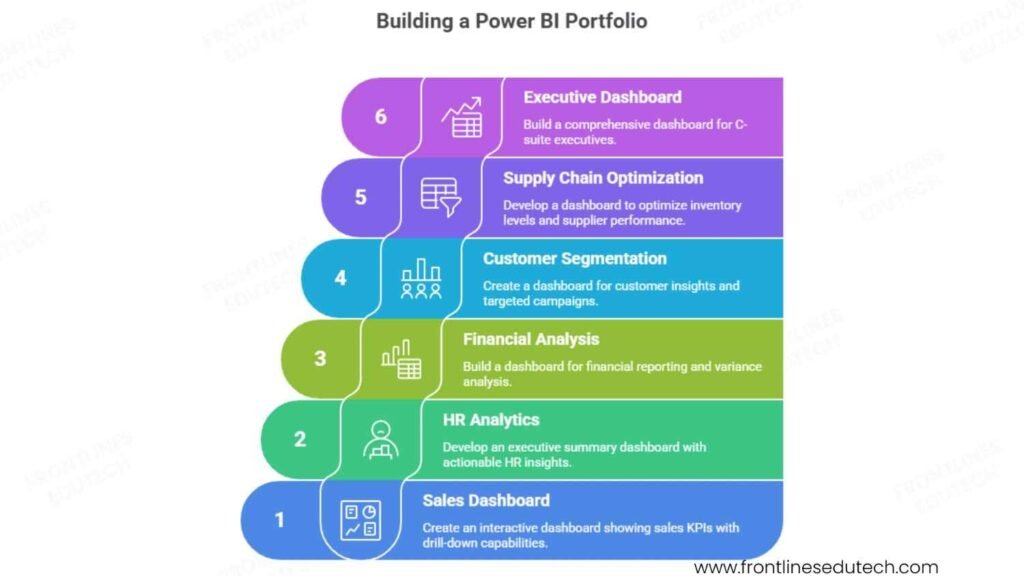
5. Building Your Power BI Portfolio
Portfolio Strategy and Structure
Multi-Industry Approach:
Demonstrate versatility by creating projects across different business domains:
- Retail/E-commerce Analytics – Customer behavior, sales performance, inventory optimization
- Financial Services Reporting – Risk analysis, portfolio performance, regulatory compliance
- Healthcare Analytics – Patient outcomes, operational efficiency, cost analysis
- Manufacturing Intelligence – Production metrics, quality control, supply chain analytics
Foundation Level Projects (Months 1-2)
- Sales Performance Dashboard
- Business Scenario: Regional sales team needs visibility into performance metrics
- Data Sources: Excel files with sales transactions, customer data, product catalog
- Key Metrics: Revenue trends, top products, sales rep performance, regional comparisons
- Technical Skills: Basic visualizations, slicers, simple DAX measures
- Expected Outcome: Interactive dashboard showing sales KPIs with drill-down capabilities
- HR Analytics Dashboard
- Business Scenario: HR department tracking employee satisfaction and retention
- Data Sources: Employee survey data, performance reviews, attendance records
- Key Metrics: Employee satisfaction scores, turnover rates, performance distributions
- Technical Skills: Survey data analysis, conditional formatting, trend analysis
- Expected Outcome: Executive summary dashboard with actionable HR insights
Intermediate Level Projects (Months 3-4)
- Financial Performance Analysis
- Business Scenario: CFO needs comprehensive financial reporting and variance analysis
- Data Sources: ERP system data, budget vs actual spreadsheets, market data
- Key Metrics: P&L analysis, budget variance, cash flow projections, KPI scorecards
- Technical Skills: Complex DAX calculations, time intelligence, parameter tables
- Advanced Features: What-if parameters, scenario analysis, automated commentary
Implementation Example:
// Budget Variance Analysis
Budget Variance =
VAR ActualAmount = SUM(Financials[Actual])
VAR BudgetAmount = SUM(Financials[Budget])
VAR Variance = ActualAmount – BudgetAmount
VAR VariancePercent = DIVIDE(Variance, BudgetAmount, 0)
RETURN
IF(
VariancePercent > 0.1, “Significantly Over Budget”,
IF(VariancePercent < -0.1, “Significantly Under Budget”, “Within Budget”)
)
- Customer Analytics and Segmentation
- Business Scenario: Marketing team needs customer insights for targeted campaigns
- Data Sources: CRM data, transaction history, web analytics, demographic data
- Key Metrics: Customer lifetime value, churn prediction, segment analysis, campaign ROI
- Technical Skills: RFM analysis, clustering, cohort analysis, predictive modeling
- Advanced Features: R/Python integration, machine learning insights, automated alerts
Advanced Level Projects (Months 5-6)
- Supply Chain Optimization Dashboard
- Business Scenario: Operations team optimizing inventory levels and supplier performance
- Data Sources: ERP systems, supplier databases, logistics data, market indicators
- Key Metrics: Inventory turnover, supplier scorecards, delivery performance, cost analysis
- Technical Skills: Complex data modeling, multiple data source integration, real-time updates
- Enterprise Features: Row-level security, automated refresh, mobile optimization
- Executive Leadership Dashboard
- Business Scenario: C-suite executives need comprehensive business performance overview
- Data Sources: Multiple business systems, external market data, competitive intelligence
- Key Metrics: Business scorecards, market performance, strategic initiative tracking
- Technical Skills: Advanced data modeling, composite models, performance optimization
- Premium Features: Natural language Q&A, automated insights, subscription-based delivery
Portfolio Presentation Best Practices
Documentation Standards:
- Business Case Description – Clear problem statement and solution approach
- Data Architecture Diagram – Visual representation of data sources and relationships
- Key Insights Summary – Top 3-5 actionable insights from the analysis
- Technical Implementation Notes – DAX formulas, modeling decisions, performance considerations
- User Guide – How to navigate and interpret the dashboard
GitHub Repository Structure:
power-bi-portfolio/
├── README.md (Portfolio overview and navigation)
├── project-1-sales-dashboard/
│ ├── data/ (Sample datasets)
│ ├── reports/ (Power BI files)
│ ├── documentation/ (Business case, technical notes)
│ └── screenshots/ (Dashboard images)
├── project-2-hr-analytics/
│ └── [same structure]
└── resources/
├── dax-functions-library.md
└── data-modeling-best-practices.md
Live Demo Environment:
- Power BI Service Workspace – Published reports accessible via web links
- Sample Data – Realistic but anonymized datasets for demonstration
- Interactive Features – Demonstrate filtering, drill-through, mobile experience
- Performance Metrics – Load times, query performance, user experience
Build an Impressive Portfolio 💼 → Explore Best Interview Guides & Project Tips
6. Job Search Strategy
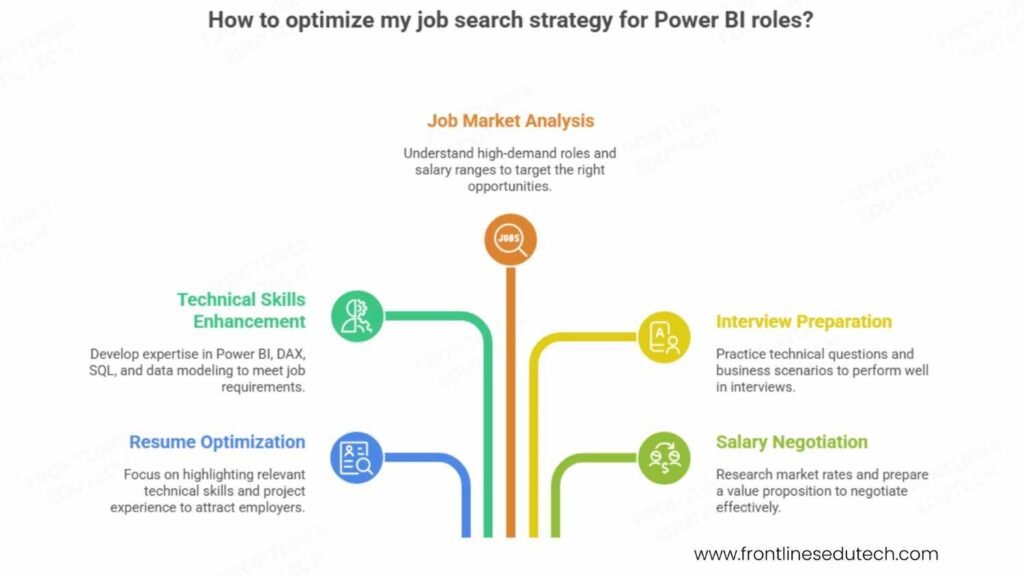
Resume Optimization for Power BI Roles
Technical Skills Section:
Business Intelligence & Analytics:
• Microsoft Power BI: Desktop, Service, Mobile, Embedded, Premium features
• Data Modeling: Star schema, snowflake schema, calculated columns, measures
• DAX Programming: Time intelligence, advanced functions, performance optimization
• SQL: Advanced queries, stored procedures, database design, performance tuning
• Data Sources: SQL Server, Azure, Excel, SharePoint, web APIs, cloud platforms
• Visualization: Custom visuals, interactive dashboards, mobile optimization
• Integration: Power Platform (Apps, Automate), Office 365, Azure services
Project Experience Examples:
Executive Sales Dashboard for Manufacturing Company
- Challenge: Sales leadership lacked real-time visibility into regional performance and pipeline health
- Solution: Developed comprehensive Power BI solution integrating CRM, ERP, and external market data
- Technical Implementation: Complex DAX calculations for sales forecasting, automated data refresh from 5 sources, mobile-optimized executive summary
- Business Impact: Reduced reporting time by 85%, improved forecast accuracy by 23%, enabled data-driven territory planning
Customer Analytics Platform for E-commerce Business
- Challenge: Marketing team needed customer segmentation and lifetime value analysis for targeted campaigns
- Solution: Built advanced analytics dashboard with RFM analysis, churn prediction, and campaign ROI tracking
- Technical Implementation: Python integration for clustering algorithms, real-time data connections, automated alert system
- Business Impact: Increased marketing campaign effectiveness by 34%, reduced customer acquisition cost by 18%
Power BI Job Market Analysis
High-Demand Role Categories:
- Business Intelligence Developer (Entry to Mid-Level)
- Salary Range: ₹4-12 LPA
- Open Positions: 3,200+ across India
- Key Responsibilities: Report development, data modeling, dashboard creation
- Growth Path: Senior BI Developer → BI Architect → Data Analytics Manager
- Data Analyst with Power BI (All Levels)
- Salary Range: ₹3.5-15 LPA
- Open Positions: 2,800+ across India
- Key Responsibilities: Data analysis, insight generation, stakeholder communication
- Growth Path: Senior Data Analyst → Analytics Manager → Chief Data Officer
- Power BI Consultant (Mid to Senior Level)
- Salary Range: ₹8-25 LPA + project bonuses
- Open Positions: 1,500+ across India
- Key Responsibilities: Client engagement, solution architecture, implementation leadership
- Growth Path: Senior Consultant → Practice Lead → Partner/Director
Top Hiring Companies and Opportunities
Technology Consulting Firms:
- Accenture – Large-scale digital transformation projects with Power BI at the center
- Deloitte – Financial services and healthcare analytics specialization
- EY (Ernst & Young) – Risk and compliance reporting solutions
- KPMG – Audit and advisory services with data analytics focus
Product Companies and End Users:
- Microsoft India – Direct employment opportunities with the Power BI product team
- Infosys – Internal business intelligence and client delivery projects
- TCS – Enterprise analytics solutions for global clients
- Wipro – Industry-specific analytics and intelligence services
Emerging Opportunities:
- Fintech Startups – Paytm, PhonePe, Razorpay needing customer and transaction analytics
- E-commerce Platforms – Flipkart, Amazon India, Myntra requiring business intelligence
- Healthcare Technology – Practo, 1mg, Apollo 24/7 implementing patient analytics
- Education Technology – BYJU’S, Unacademy, Vedantu using learning analytics
Interview Preparation Framework
Technical Competency Questions:
Power BI Fundamentals:
- “Explain the difference between calculated columns and measures in Power BI”
- Calculated columns: Computed row-by-row, stored in memory, slow performance for large datasets
- Measures: Computed dynamically based on filter context, better performance, respond to slicers
- Use cases: Calculated columns for categorization, measures for aggregations
- “How do you optimize Power BI report performance?”
- Data model optimization: Star schema, remove unnecessary columns, appropriate data types
- DAX optimization: Avoid iterating functions, use CALCULATE efficiently, minimize context transitions
- Visual optimization: Limit visuals per page, use appropriate visual types, implement bookmarks
DAX and Data Modeling:
3. “Write a DAX formula to calculate year-over-year growth percentage”
YoY Growth % =
VAR CurrentPeriod = SUM(Sales[Amount])
VAR PreviousPeriod = CALCULATE(
SUM(Sales[Amount]),
SAMEPERIODLASTYEAR(Calendar[Date])
)
RETURN
DIVIDE(CurrentPeriod – PreviousPeriod, PreviousPeriod, BLANK())
- “How would you implement row-level security in Power BI?”
- Create security roles with DAX filter expressions
- Map users to roles in Power BI Service
- Test security using “View as” feature
- Consider dynamic security using USERNAME() or USERPRINCIPALNAME()
Business Intelligence Scenarios:
5. “Design a dashboard for a retail company’s inventory management”
- Key metrics: Inventory turnover, stockout frequency, supplier performance, seasonal trends
- Data sources: ERP systems, supplier databases, sales transactions
- User personas: Store managers, procurement team, executives
- Interactive features: Drill-down by product category, time period filtering, exception reporting
Integration and Architecture:
6. “How would you integrate Power BI with existing business systems?”
- Data gateway configuration for on-premises sources
- API connections for cloud-based systems
- Scheduled refresh strategies for different data sources
- Security considerations for cross-system integration
Salary Negotiation Strategies
Market Research and Benchmarking:
- Industry-Specific Rates – Financial services typically pay 15-20% premium
- Company Size Impact – Large enterprises often offer better base salary, startups may offer equity
- Location Variations – Bangalore and Mumbai command highest rates, 10-15% above national average
- Certification Premium – Microsoft certified professionals earn 12-18% more than non-certified
Total Compensation Evaluation:
Base Salary: ₹X LPA (Fixed annual amount)
Variable Pay: X% of base (Performance-based quarterly/annual bonuses)
Stock Options: X shares (For publicly traded or pre-IPO companies)
Learning Budget: ₹25,000-75,000 annually (Certification and training reimbursement)
Flexible Benefits: Health insurance, work from home allowance, conference attendance
Negotiation Best Practices:
- Research Phase – Gather salary data from multiple sources (Glassdoor, PayScale, network contacts)
- Value Proposition – Prepare specific examples of business impact from previous projects
- Holistic Approach – Consider career growth opportunities, not just immediate compensation
- Professional Communication – Express enthusiasm while presenting market-based reasoning
- Timeline Management – Request 24-48 hours to review offer, avoid immediate decisions
Applying for Jobs? 🔍 Boost Your Preparation with Our Interview Guides →
7. Salary Expectations and Career Growth
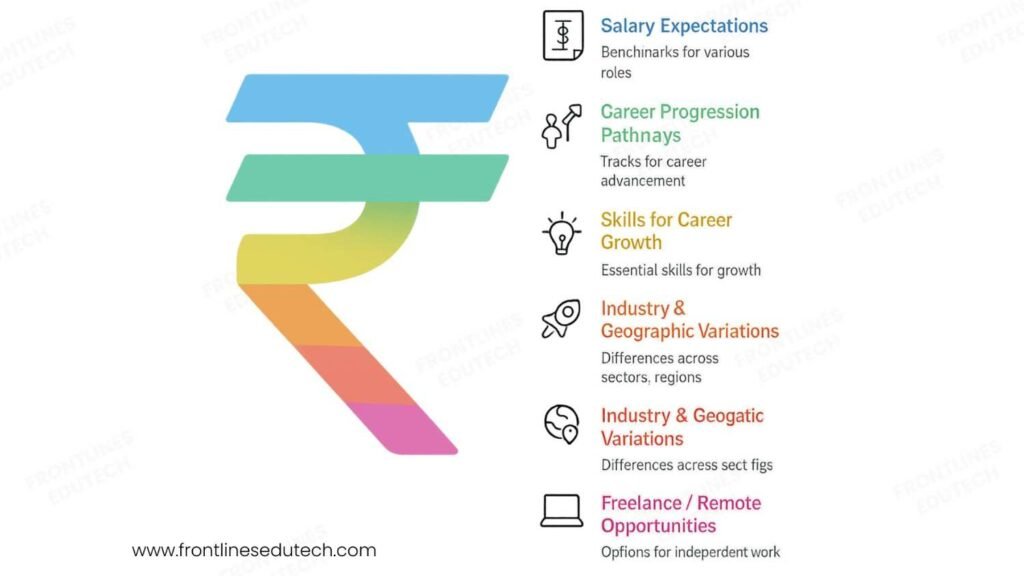
2025 Compensation Benchmarks
Geographic Variations:
Tier-1 Cities (Bangalore, Mumbai, Pune, Gurgaon):
- Entry Level (0-2 years): ₹4.5-8 LPA
- Mid Level (2-5 years): ₹8-16 LPA
- Senior Level (5-8 years): ₹16-28 LPA
- Expert/Architect (8+ years): ₹28-45 LPA
Tier-2 Cities (Chennai, Hyderabad, Kolkata, Ahmedabad):
- 10-12% lower than Tier-1 for comparable roles
- Growing opportunity market with increasing demand
- Better cost of living ratio for overall financial benefit
Remote and International Opportunities:
- US Remote Contracts: $45,000-95,000 annually (₹37-78 LPA equivalent)
- European Projects: €35,000-75,000 annually (₹30-65 LPA equivalent)
- Freelance/Consulting: ₹1,500-5,000 per hour based on expertise and project complexity
Industry-Specific Salary Premiums
Financial Services and Banking:
- 15-25% premium over general IT roles
- Regulatory compliance expertise adds additional value
- Risk analytics specialization commands highest premiums
Healthcare and Life Sciences:
- 12-20% premium for HIPAA compliance and clinical analytics knowledge
- Population health analytics emerging as high-value specialization
- Pharmaceutical analytics requiring domain expertise
Retail and E-commerce:
- 8-15% premium for customer analytics and marketing attribution
- Real-time analytics capabilities in high demand
- Supply chain optimization expertise valuable
Career Progression Pathways
Technical Excellence Track:
Junior BI Developer (0-2 years)
↓
Power BI Developer (2-4 years)
↓
Senior BI Developer (4-7 years)
↓
BI Architect (6-10 years)
↓
Principal Data Architect (10+ years)
Business Leadership Track:
Data Analyst (1-3 years)
↓
Senior Data Analyst (3-6 years)
↓
Analytics Manager (5-9 years)
↓
Director of Analytics (8-15 years)
↓
Chief Data Officer (12+ years)
Consulting and Entrepreneurship Track:
BI Consultant (2-5 years)
↓
Senior Consultant (4-8 years)
↓
Principal Consultant (6-12 years)
↓
Practice Lead (8-15 years)
↓
Independent Consultancy Owner (10+ years)
Skills for Accelerated Career Growth
Technical Depth (Years 1-3):
- Advanced DAX Mastery – Complex calculations, performance optimization, debugging
- Data Modeling Excellence – Star schema design, performance tuning, scalability planning
- Integration Expertise – Multiple data sources, real-time connections, cloud platforms
- Visualization Innovation – Custom visuals, user experience design, mobile optimization
Business Acumen (Years 3-6):
- Industry Knowledge – Deep understanding of 2-3 business verticals
- Stakeholder Management – Executive communication, requirement gathering, change management
- Project Leadership – Team coordination, timeline management, deliverable ownership
- Solution Architecture – End-to-end analytics solution design and implementation
Strategic Impact (Years 6+):
- Data Strategy – Enterprise data governance, analytics roadmap, technology selection
- Team Building – Hiring, mentoring, performance management, culture development
- Innovation Leadership – Emerging technology adoption, competitive advantage creation
- Business Partnership – C-level engagement, strategic planning, ROI demonstration
Emerging Opportunities and Future Trends
High-Growth Specializations:
- AI-Enhanced Analytics – Integration with Azure Cognitive Services and OpenAI
- Real-Time Analytics – Streaming data, event processing, operational intelligence
- Embedded Analytics – Power BI Embedded in custom applications and products
- Governance and Compliance – Data privacy, regulatory reporting, audit trail management
Market Trends Creating Opportunities:
- Self-Service Analytics – Empowering business users with governed self-service capabilities
- Mobile-First Reporting – Responsive design and mobile-optimized user experiences
- Cloud Migration – On-premises to cloud analytics transformation projects
- Data Democratization – Making analytics accessible across organizational hierarchies
Aim High in Your Career! 📊 Check Our Power BI Course for Guaranteed Skill Growth →
8. Success Stories from Our Students
Rajesh Kumar – From Excel Analyst to Power BI Architect
Background: 7 years as financial analyst using primarily Excel for reporting and analysis
Challenge: Manual reporting processes taking 3-4 days monthly, limited scalability and insight generation
Transformation Journey: Systematic transition from Excel power user to enterprise Power BI architect
Timeline: 9 months from course enrollment to architect role at multinational consulting firm
Current Position: Senior Power BI Architect at PwC India
Salary Progression: ₹8.2 LPA → ₹12.5 LPA → ₹18.7 LPA → ₹26.8 LPA (over 30 months)
Rajesh’s Strategic Approach:
- Excel to Power BI Migration – Converted existing Excel reports to Power BI, demonstrating immediate ROI
- Certification Sprint – Earned Microsoft Power BI Data Analyst certification within 4 months
- Industry Specialization – Focused on financial services and regulatory reporting expertise
- Thought Leadership – Published 15 technical articles on LinkedIn about Power BI best practices
Key Success Factors:
- Business Impact Focus – “I learned that Power BI success isn’t about complex DAX formulas—it’s about solving real business problems. My first project reduced month-end reporting time from 72 hours to 4 hours, which got executive attention immediately.”
- Continuous Learning – “I dedicated 1 hour daily to learning new Power BI features. Microsoft releases updates monthly, so staying current is essential for career growth.”
- Network Building – “Joining the Power BI User Group in Bangalore connected me with other professionals and led to multiple job opportunities through referrals.”
Current Impact: Leading Power BI implementation for Fortune 500 financial services clients, managing teams of 8+ developers across multiple countries, responsible for $2M+ annual project revenue.
Priya Patel – From Business Analyst to Data Analytics Manager
Background: 5 years as business analyst in healthcare industry with limited technical skills
Challenge: Dependent on IT team for basic reports, unable to provide real-time insights to stakeholders
Strategic Focus: Building technical skills while leveraging strong business domain knowledge
Timeline: 18 months from course completion to management role
Career Trajectory: Business Analyst → Senior BA → Data Analyst → Analytics Manager
Current Role: Manager, Data Analytics at Apollo Hospitals Enterprise
Salary and Responsibility Growth:
- Year 1: ₹6.8 LPA (Business Analyst with Power BI skills)
- Year 2: ₹11.5 LPA (Senior Data Analyst)
- Year 3: ₹17.2 LPA (Analytics Manager) + team bonus structure
- Current Benefits: Stock options, healthcare coverage, conference sponsorship
Priya’s Healthcare Analytics Specialization:
- Patient Outcome Analytics – Developed predictive models for readmission risk and treatment effectiveness
- Operational Efficiency – Created dashboards reducing patient wait times by 28% across 15 hospitals
- Financial Performance – Implemented revenue cycle analytics improving collections by ₹12 crores annually
- Regulatory Compliance – Built automated reporting for NABH accreditation and government requirements
Management and Leadership Development:
- Team Building – Grew analytics team from 2 to 12 professionals across multiple specializations
- Stakeholder Management – Regular presentations to hospital CEO and board of directors
- Technology Strategy – Led selection and implementation of enterprise analytics platform
- Knowledge Sharing – Established internal Power BI Center of Excellence with training programs
Key Insights: “The combination of healthcare domain knowledge and Power BI technical skills created unique career opportunities. Healthcare generates massive amounts of data, but very few professionals understand both the clinical context and the technology to extract insights.”
Amit Sharma – From Fresher to Independent Power BI Consultant
Background: Recent MBA graduate with finance specialization but no technical experience
Challenge: Competitive job market with limited practical experience beyond academic projects
Entrepreneurial Strategy: Building consulting practice while developing technical expertise
Timeline: 24 months from course completion to established consultancy
Business Growth: Scaled from individual contributor to 6-person specialized Power BI firm
Revenue Growth Trajectory:
- Months 1-6: ₹35,000/month (part-time projects while job searching)
- Months 7-12: ₹95,000/month (full-time independent consulting)
- Year 2: ₹2,45,000/month (team-based project delivery)
- Year 3: ₹4,25,000/month (established firm with recurring enterprise clients)
Amit’s Consultancy Success Model:
- Niche Specialization – Focus on manufacturing and supply chain analytics
- Value-Based Pricing – Price based on business impact rather than hourly rates
- Long-Term Relationships – 95% client retention rate through exceptional service delivery
- Scalable Processes – Developed reusable accelerators and frameworks for faster implementation
Business Development Strategy:
- Content Marketing – YouTube channel with 25,000+ subscribers teaching Power BI techniques
- Partnership Network – Strategic alliances with ERP vendors and system integrators
- Thought Leadership – Speaking engagements at 12 industry conferences and user groups
- Referral Program – 60% of new business comes from existing client referrals
Entrepreneurial Insights:
- Market Positioning – “I positioned myself as the ‘Manufacturing Analytics Expert’ rather than a generic Power BI consultant. This specialization allowed me to charge premium rates and become the go-to person for complex supply chain projects.”
- Continuous Innovation – “I invest 15-20% of revenue back into learning new technologies and certifications. Staying ahead of the curve is essential for maintaining competitive advantage.”
- Team Development – “Building a team of specialists allowed me to take on larger projects and provide comprehensive solutions. Each team member has deep expertise in specific industries or technologies.”
Current Status: Recognized as leading Power BI consultant in manufacturing analytics space, clients across 8 countries, annual revenue exceeding ₹5 crores with 35% year-over-year growth.
👉Frontlines Edutech’s affordable Power BI course, blending Telugu and English, offers live classes and essential real projects. You’ll learn to model data and develop interactive reports effectively, gaining practical, start-to-finish data analysis skills.
🌟Want Results Like Our Students? Explore All Career-Boosting Learning Paths →
9. Common Challenges and Solutions
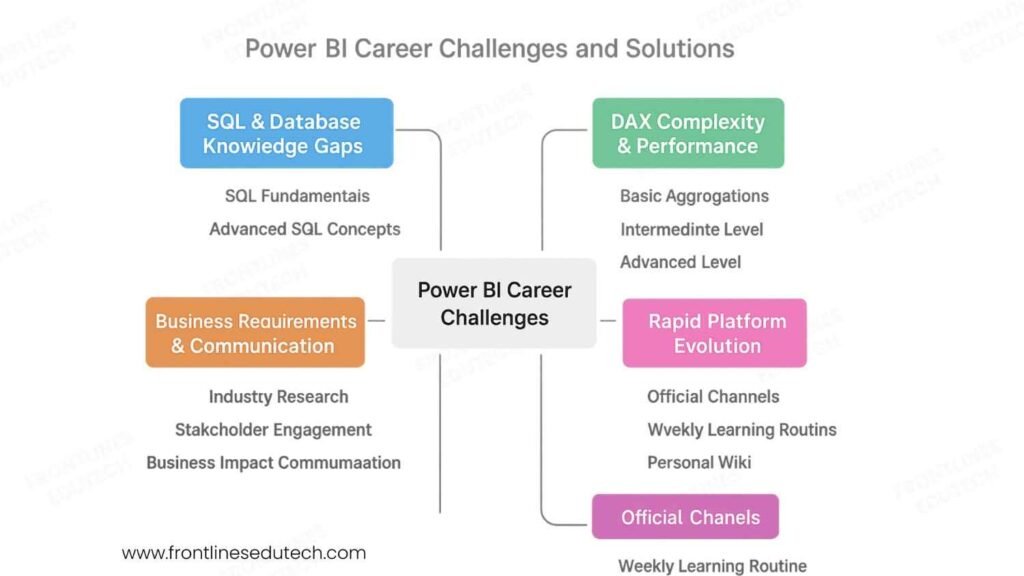
Challenge 1: SQL and Database Knowledge Gaps
Problem: Many Power BI aspirants come from business backgrounds with limited SQL experience
Impact: Difficulty optimizing data sources, poor query performance, inability to create efficient data models
Symptoms: Slow-loading reports, incorrect calculations, inability to join data sources effectively
Comprehensive Solution Strategy:
Phase 1: SQL Fundamentals (2-3 weeks)
- Start with Interactive Platforms – Use SQLiteOnline or W3Schools SQL Tryit Editor for hands-on practice
- Master Basic Operations – SELECT, WHERE, ORDER BY, GROUP BY with real datasets
- Practice Daily – Solve 2-3 SQL problems daily on platforms like HackerRank or LeetCode
- Focus on Business Scenarios – Sales analysis, customer segmentation, inventory management queries
Phase 2: Advanced SQL Concepts (3-4 weeks)
- Join Mastery – Practice INNER, LEFT, RIGHT, FULL OUTER joins with multiple tables
- Aggregate Functions – SUM, COUNT, AVG with complex GROUP BY conditions
- Subqueries and CTEs – Nested queries for complex business logic
- Window Functions – ROW_NUMBER(), RANK(), running totals, moving averages
Practical Implementation Plan:
— Example: Customer Purchase Analysis
WITH CustomerMetrics AS (
SELECT
CustomerID,
COUNT(OrderID) as TotalOrders,
SUM(OrderAmount) as TotalSpent,
AVG(OrderAmount) as AvgOrderValue,
MAX(OrderDate) as LastPurchase
FROM Orders
WHERE OrderDate >= DATEADD(year, -1, GETDATE())
GROUP BY CustomerID
)
SELECT
c.CustomerName,
cm.TotalOrders,
cm.TotalSpent,
cm.AvgOrderValue,
DATEDIFF(day, cm.LastPurchase, GETDATE()) as DaysSinceLastPurchase
FROM Customers c
INNER JOIN CustomerMetrics cm ON c.CustomerID = cm.CustomerID
WHERE cm.TotalSpent > 10000
ORDER BY cm.TotalSpent DESC;
Challenge 2: DAX Complexity and Performance Issues
Problem: DAX learning curve is steep, with many functions behaving differently than expected
Common Issues: Incorrect filter context understanding, poor performance with large datasets, debugging difficulties
Student Struggles: Confusion between calculated columns and measures, CALCULATE function complexity
Structured DAX Learning Approach:
Foundation Level (Week 1-2):
- Basic Aggregations – SUM, AVERAGE, COUNT, MIN, MAX
- Filter Context Concepts – Row context vs filter context fundamentals
- Simple Measures – Revenue, profit margins, basic ratios
Intermediate Level (Week 3-4):
- CALCULATE Function – Modifying filter context, multiple filter conditions
- Time Intelligence – YTD, QTD, MTD calculations, period comparisons
- Relationship Functions – RELATED, RELATEDTABLE, LOOKUPVALUE
Advanced Level (Week 5-6):
- Complex Scenarios – Nested CALCULATE statements, variable usage
- Performance Optimization – Avoiding iterator functions, proper measure design
- Error Handling – DIVIDE, ISBLANK, IF statements for robust calculations
DAX Learning Resources and Practice:
- DAX Guide (dax.guide) – Comprehensive function reference with examples
- SQLBI.com – Advanced DAX patterns and best practices
- Practice Datasets – Contoso sample database for realistic scenarios
- DAX Studio – Query analysis and performance optimization tool
Challenge 3: Business Requirements Gathering and Translation
Problem: Technical skills without business context limit career growth and project success
Symptoms: Building reports that don’t address real business needs, poor stakeholder communication
Root Cause: Focus on technical implementation without understanding business problems
Business Acumen Development Framework:
Industry Research (Ongoing):
- Study Business Processes – Understand how different industries operate and measure success
- Learn Key Metrics – Industry-specific KPIs, benchmarks, and success criteria
- Regulatory Knowledge – Compliance requirements affecting reporting and analytics
- Competitive Analysis – How industry leaders use analytics for competitive advantage
Stakeholder Engagement Skills:
Requirements Gathering Process:
1. Pre-meeting Research – Understand stakeholder role and business context
2. Open-ended Questions – “What decisions do you need to make with this data?”
3. Current State Analysis – “How do you currently get this information?”
4. Success Criteria – “How will you know if this solution is successful?”
5. Data Source Validation – “Where does this data come from and how reliable is it?”
6. Usage Patterns – “How often will you use this report and in what situations?”
Business Impact Communication:
- Executive Summaries – Lead with business outcomes, support with technical details
- ROI Calculations – Quantify time savings, cost reductions, revenue improvements
- Visual Storytelling – Guide stakeholders through insights with logical narrative flow
- Action-Oriented Insights – Every insight should lead to a specific business action
Challenge 4: Keeping Up with Rapid Platform Evolution
Problem: Microsoft releases Power BI updates monthly with new features and changes
Challenge: Feeling overwhelmed by constant learning requirements, fear of skill obsolescence
Impact: Falling behind industry standards, missing opportunities to leverage new capabilities
Strategic Learning and Adaptation Framework:
Information Management Strategy:
- Official Channels – Subscribe to Power BI Blog, Microsoft 365 Roadmap, YouTube channel
- Community Resources – Follow Power BI User Groups, MVP blogs, conference recordings
- Practical Focus – Concentrate on features relevant to your industry and role
- Implementation Timeline – Allow 3-6 months before adopting new features in production
Continuous Learning Schedule:
Weekly Learning Routine (3-4 hours total):
Monday: 30 minutes – Review Power BI Blog for latest updates
Tuesday: 45 minutes – Hands-on practice with new feature or function
Wednesday: 30 minutes – Community forum participation (questions/answers)
Thursday: 60 minutes – Advanced tutorial or case study
Friday: 30 minutes – Update personal knowledge base and practice projects
Weekend: 45 minutes – Industry reading and competitive analysis
Knowledge Management System:
- Personal Wiki – Document learning, code snippets, best practices
- Practice Environment – Dedicated Power BI workspace for experimentation
- Project Templates – Reusable components and patterns for faster development
- Network Engagement – Regular participation in user groups and online communities
10. Your Next Steps
Week 1: Foundation and Environment Setup
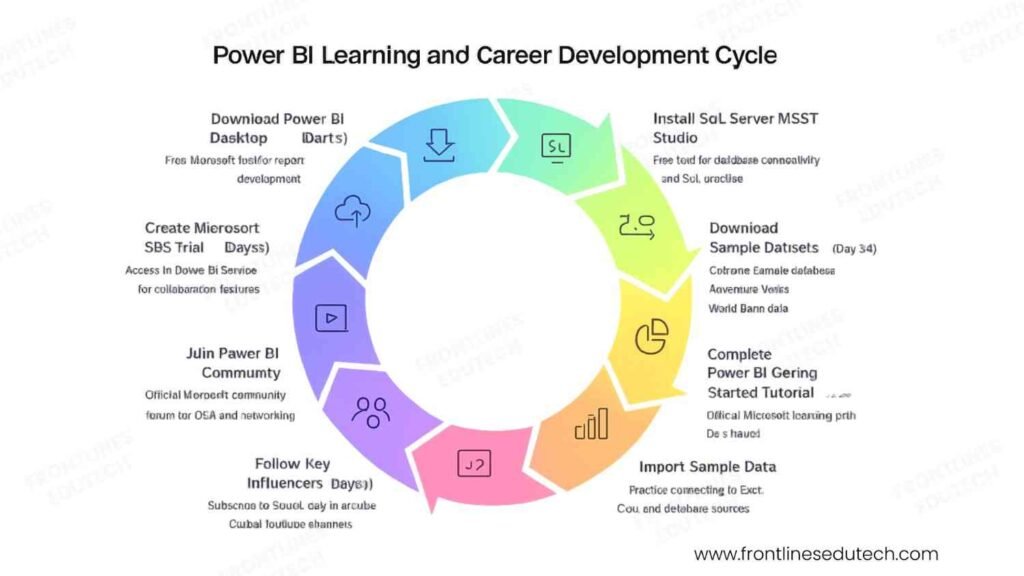
Day 1-2: Platform Access and Initial Setup
- Download Power BI Desktop – Free Microsoft tool for report development
- Create Microsoft 365 Trial – Access to Power BI Service for collaboration features
- Install SQL Server Management Studio – Free tool for database connectivity and SQL practice
- Download Sample Datasets – Contoso sample database, AdventureWorks, World Bank data
Day 3-4: Platform Exploration and Basic Navigation
- Complete Power BI Getting Started Tutorial – Official Microsoft learning path (2-3 hours)
- Import Sample Data – Practice connecting to Excel, CSV, and database sources
- Create First Visualizations – Bar charts, line graphs, tables with sample data
- Explore Interface – Ribbon menus, field panes, formatting options, filter hierarchy
Day 5-7: Learning Path Planning and Community Engagement
- Join Power BI Community – Official Microsoft community forum for Q&A and networking
- Follow Key Influencers – Subscribe to SQLBI, Guy in a Cube, Curbal YouTube channels
- Set Learning Goals – Define 30, 60, 90-day milestones for skill development
- Create Study Schedule – Allocate daily study time and weekend project work
Month 1: SQL and Data Fundamentals
Week 1-2: SQL Mastery Foundation
- SQL Basics – Practice SELECT, WHERE, ORDER BY, GROUP BY operations daily
- Database Design – Understand normalization, relationships, primary/foreign keys
- Sample Project – Analyze e-commerce sales data with complex queries
- Performance Concepts – Learn about indexes, query optimization, execution plans
Week 3-4: Advanced SQL and Power BI Integration
- Complex Joins – Master multi-table queries and relationship types
- Subqueries and CTEs – Handle nested business logic and temporary result sets
- Power BI Data Import – Connect to various data sources, understand refresh limitations
- Data Transformation – Basic Power Query operations for data cleaning and shaping
Month-End Project: “Retail Sales Analysis Dashboard”
- Connect to SQL database with sales, customer, and product tables
- Create comprehensive data model with proper relationships
- Build executive dashboard showing key sales metrics and trends
- Document data sources, business logic, and user guide
Month 2: Data Modeling and Basic DAX
Week 1-2: Data Modeling Excellence
- Star Schema Design – Create fact and dimension tables for optimal performance
- Relationship Management – Active/inactive relationships, cross-filter direction
- Calculated Columns – Add business logic and categorization to data model
- Data Types and Categories – Optimize storage and improve user experience
Week 3-4: DAX Fundamentals
- Basic Functions – SUM, AVERAGE, COUNT, DISTINCTCOUNT operations
- Filter Context – Understand how DAX evaluates expressions based on visual filters
- Simple Measures – Revenue, profit margins, growth percentages
- Time Intelligence – YTD, MTD, same period last year comparisons
Advanced Learning Goals:
- Complete Microsoft Learn Path – “Analyze data with Power BI” certification preparation
- Practice Projects – Build 2-3 small dashboards with different industry contexts
- Community Participation – Answer questions in Power BI forums, share learning experiences
Month 3: Advanced Visualizations and Analytics
Week 1-2: Visualization Mastery
- Chart Selection – Choose appropriate visualizations for different data types and insights
- Conditional Formatting – Dynamic colors, data bars, KPI indicators
- Custom Visuals – Import and configure third-party visualizations from marketplace
- Interactivity – Cross-filtering, drill-through, bookmarks for guided analysis
Week 3-4: Advanced Analytics Integration
- Statistical Analysis – Correlation, regression, forecasting with built-in analytics
- R/Python Integration – Custom scripts for advanced statistical analysis
- AI Features – Quick Insights, Key Influencers, Decomposition Tree analysis
- Performance Optimization – Query reduction, aggregation strategies, composite models
Portfolio Development Focus:
- Industry-Specific Projects – Choose 2-3 industries for specialized dashboard development
- Technical Documentation – Create detailed documentation for each project
- GitHub Repository – Establish professional online portfolio with code samples
- Demo Environment – Publish reports to Power BI Service for easy sharing
Long-Term Milestones (6-12 Months)
Professional Certification Track:
- Microsoft PL-300 – Power BI Data Analyst certification (target: Month 4-5)
- Advanced Certifications – Consider Azure Data Engineer or Data Scientist paths
- Continuous Learning – Stay updated with monthly Power BI feature releases
- Specialization Focus – Develop expertise in 1-2 industry verticals
Career Development Activities:
- Network Building – Attend local Power BI user group meetings and virtual events
- Thought Leadership – Write technical blog posts, create tutorial videos
- Project Portfolio – Maintain 5-7 comprehensive projects demonstrating various skills
- Mentoring Others – Help newcomers in community forums and study groups
Job Search and Career Transition:
- Resume Optimization – Highlight business impact and technical skills balance
- Interview Preparation – Practice technical questions and business scenario discussions
- Salary Research – Understand market rates and negotiation strategies
- Career Path Planning – Define 3-5 year goals and required skill development
Conclusion
Power BI development represents one of the most accessible yet high-impact career paths in today’s data-driven economy. Unlike many specialized technical fields that require years of foundational study, motivated individuals can become proficient Power BI developers within 4-6 months and secure meaningful employment with competitive salaries.
The convergence of several market trends makes 2025 an ideal time to enter the Power BI field: organizations are accelerating digital transformation initiatives, the demand for self-service analytics is exploding, and Microsoft’s continued investment in the platform ensures long-term career stability and growth opportunities.
Critical Success Factors for Power BI Career Success:
- Business-First Mindset – Focus on solving real business problems rather than just technical implementation
- Continuous Learning – Stay current with monthly platform updates and emerging analytics trends
- Industry Specialization – Develop deep domain knowledge in 1-2 business verticals for premium positioning
- Communication Excellence – Translate technical insights into actionable business recommendations
- Community Engagement – Build professional network through user groups, forums, and industry events
The most successful Power BI professionals combine technical proficiency with business acumen and stakeholder management skills. As organizations become increasingly data-literate, the role of Power BI developers is evolving from report creators to strategic advisors who influence business decisions through data-driven insights.
Whether you choose to join an established consulting firm, work as an internal business intelligence specialist, or build an independent consulting practice, Power BI skills provide a solid foundation for long-term career growth and financial security.
Ready to transform your career with Power BI and join the data revolution?
Explore our comprehensive Power BI Developer Program designed for career changers and aspiring analytics professionals:
 4-month intensive curriculum covering SQL, DAX, advanced analytics, and business intelligence
- Hands-on portfolio projects with real business scenarios and datasets
- Microsoft PL-300 certification preparation with practice exams and study materials
- Industry mentorship from certified Power BI experts and solution architects
- Job placement assistance with resume optimization, interview coaching, and employer connections
- Lifetime learning support with access to updated content and alumni network
- Project-based learning with live client engagements for real-world experience
Not sure if Power BI is the right career path for your background? Schedule a free career assessment with our analytics career counselors to receive personalized guidance based on your experience and goals.
Connect with our Power BI community: Join our Power BI Developers WhatsApp Group with 350+ students, alumni, and working professionals for daily learning support, project collaboration, and job referrals.