
Data Science with AI Interview Preparation Guide : 240 Q&As
Table of Contents
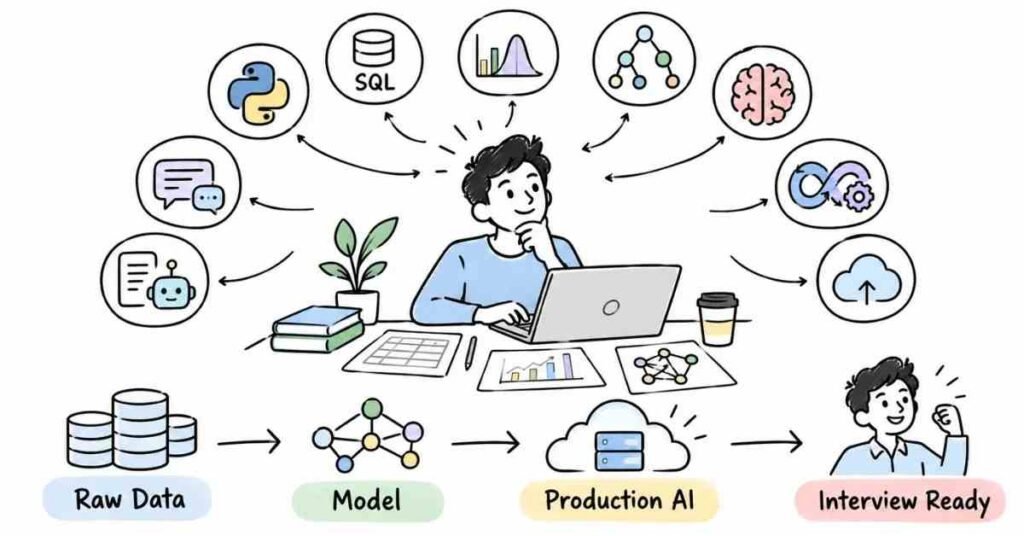
Part 1: Introduction & 30-Day Study Plan
What This Guide Covers
This guide helps you prepare for Data Science with AI interviews in a structured and practical way.
It covers:
- Python
- NumPy and Pandas
- Statistics
- SQL
- EDA
- Machine Learning
- Deep Learning
- NLP
- Generative AI
- LLMs
- Model Deployment
- MLOps
- Behavioral interviews
The guide starts with fundamentals and moves toward practical AI and interview scenarios.
Who This Guide Is For
This guide is useful if you are:
- A fresher entering Data Science
- A Data Analyst moving into Data Science
- A Python learner
- An AI or Machine Learning learner
- A career switcher
- An early-career Data Scientist
The reference PDF also starts from beginner concepts and gradually moves toward advanced interview preparation.
What Data Science with AI Means
Data Science uses data to find patterns, answer business questions, and build predictive models.
AI adds techniques that help systems:
- Predict outcomes
- Classify data
- Understand language
- Recognize patterns
- Generate new content
A simple workflow is:
Data → Cleaning → Analysis → Features → Model → Evaluation → Deployment
Why Data Science with AI Matters in 2026
Companies use data and AI for:
- Customer prediction
- Fraud detection
- Recommendation systems
- Demand forecasting
- Automation
- Chatbots
- Decision support
Interviewers now expect candidates to understand both traditional Data Science and modern AI concepts.
Career Path in Data Science with AI
A common career path is:
Data Analyst
Works mainly with:
SQL → Excel → Visualization → Reporting
Junior Data Scientist
Works with:
Python → Statistics → EDA → Machine Learning
Data Scientist
Handles:
Feature Engineering → Model Building → Evaluation → Business Insights
AI / ML Engineer
Focuses more on:
Machine Learning → Deep Learning → Deployment → Production AI
Senior Data Scientist / AI Lead
Works on:
Architecture → Model Strategy → Experimentation → Team Guidance
How To Use The Guide
Use this preparation method:
- Learn the concept.
- Practise interview questions.
- Explain answers in your own words.
- Try a small coding example.
- Connect the concept to a project.
- Review weak topics.
The reference guide follows the same learn → practise → own words → examples → revision method instead of memorization.
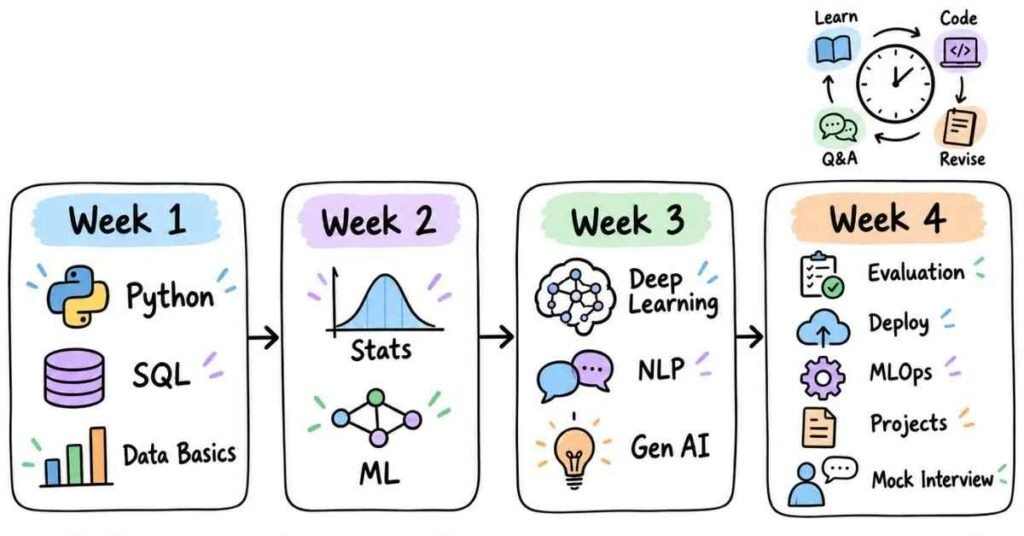
30-Day Study Plan
Week 1: Python, SQL & Data Basics
Focus on:
Python → NumPy → Pandas → Data Cleaning → SQL → Joins → EDA
Practise working with one small dataset.
Week 2: Statistics & Machine Learning
Focus on:
Probability → Mean/Median → Variance → Hypothesis Testing → Regression → Classification → Clustering
Understand why each algorithm is used.
Week 3: Deep Learning & AI
Focus on:
Neural Networks → CNN → RNN → NLP → Transformers → Generative AI → LLM Basics
Practise explaining concepts in simple language.
Week 4: Projects, Deployment & Mock Interviews
Focus on:
Model Evaluation → Deployment → MLOps → AI Projects → Scenario Questions → Behavioral Questions → Mock Interviews
The reference PDF also divides the 30-day preparation into four focused weeks.
Daily Study Routine
A simple routine:
- 30 minutes: Learn a concept
- 30 minutes: Coding practice
- 20 minutes: Interview questions
- 10 minutes: Revision
Consistency is more useful than studying for many hours only once in a while.
Tools You Should Know
You do not need to master every tool.
Know the purpose of:
- Python
- Jupyter Notebook
- NumPy
- Pandas
- Matplotlib
- Scikit-learn
- SQL
- TensorFlow / PyTorch basics
- Hugging Face basics
- Git
- Docker
- MLflow basics
The reference PDF similarly includes a dedicated tools section before technical interview preparation begins.
Common Interview Focus Areas
Most interviews check:
- Python
- Pandas
- SQL
- Statistics
- Data Cleaning
- EDA
- Machine Learning
- Feature Engineering
- Model Evaluation
- Deep Learning
- NLP
- Generative AI
- Projects
- Problem-solving
Interviewers may also ask:
“Why did you choose this model?”
“How did you handle missing data?”
“Why is accuracy not always enough?”
“How would you improve a model after deployment?”
Salary Expectations in 2026
Salary depends on company, city, skill depth, experience, projects, and interview performance.
Role | Experience | Broad India Range |
Data Analyst | 0–2 years | ₹3–7 LPA |
Junior Data Scientist | 0–2 years | ₹4–9 LPA |
Data Scientist | 2–5 years | ₹7–18 LPA |
AI / ML Engineer | 2–5 years | ₹8–20 LPA |
These are only broad planning ranges and can vary significantly.
What Strong Answers Look Like
Good answers should be:
- Clear
- Short
- Practical
- Connected to a project
- Focused on reasoning
Weak Answer
“Random Forest is a good model.”
Better Answer
“I would consider Random Forest when the data has nonlinear patterns and I need a strong tree-based model. I would still compare it with simpler models using the right evaluation metric.”
The reference guide also emphasizes practical answers instead of vague statements.
How To Think Like a Data Scientist
For every problem, ask:
What is the business problem?
What data is available?
Is the data clean?
Which features matter?
Which model fits the problem?
Which metric should measure success?
How will the model behave after deployment?
A strong Data Scientist does not start with:
“Which algorithm should I use?”
First understand the problem and data.
Part 2: Python, NumPy, Pandas & Data Science Fundamentals
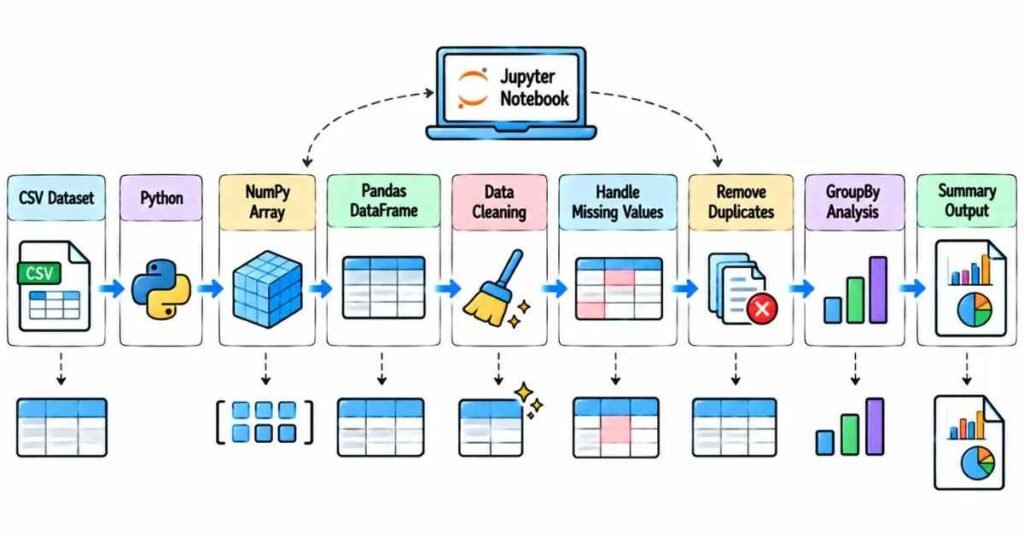
Python & Data Science Basics — Questions 1–40
Q1. Why is Python popular in Data Science?
Python is easy to read and has strong libraries for data analysis, machine learning, visualization, and AI.
Q2. What are the main Python data types?
Common types are:
int, float, string, boolean, list, tuple, set, dictionary
Q3. What is a list?
A list stores multiple values and can be modified.
numbers = [10, 20, 30]
Q4. What is a tuple?
A tuple is similar to a list but cannot be changed after creation.
Q5. List vs Tuple?
List: Mutable
Tuple: Immutable
Use tuples when values should stay fixed.
Q6. What is a dictionary?
A dictionary stores data as key-value pairs.
student = {“name”: “Ravi”, “age”: 22}
Q7. What is a set?
A set stores unique values.
It is useful for removing duplicates.
Q8. What is slicing in Python?
Slicing extracts part of a sequence.
data[0:5]
Q9. What is list comprehension?
It is a short way to create a list.
[x * 2 for x in numbers]
Q10. What is a function?
A function is reusable code written to perform a specific task.
Q11. What are *args and **kwargs?
*args accepts multiple positional arguments.
**kwargs accepts multiple named arguments.
Q12. What is a lambda function?
A lambda is a small anonymous function.
lambda x: x * 2
Q13. What is exception handling?
It handles runtime errors using:
try → except → finally
Q14. What is a class?
A class is a blueprint used to create objects.
Q15. What is an object?
An object is an instance of a class.
Q16. What is inheritance?
Inheritance allows one class to reuse properties and methods from another class.
Q17. What is a Python module?
A module is a Python file containing reusable code.
Q18. What is a package?
A package is a collection of related Python modules.
Q19. What is an iterator?
An iterator returns values one at a time.
It is useful when processing sequences.
Q20. What is a generator?
A generator produces values only when required using yield.
It can save memory for large data.
NumPy
Q21. What is NumPy?
NumPy is a Python library used for fast numerical operations and arrays.
Q22. What is a NumPy array?
A NumPy array stores values in an efficient numerical structure.
import numpy as np
a = np.array([1, 2, 3])
Q23. NumPy array vs Python list?
NumPy arrays are generally better for large numerical calculations.
Lists are more flexible for general-purpose Python data.
Q24. What is vectorization?
Vectorization performs operations on entire arrays without writing manual loops.
a * 2
Q25. What is broadcasting?
Broadcasting allows NumPy to perform operations on arrays with compatible shapes.
Q26. What is the shape of an array?
Shape shows the number of rows, columns, or dimensions.
a.shape
Q27. What is reshaping?
Reshaping changes the dimensions of an array without changing its values.
Q28. How do you handle missing numeric values in NumPy?
NumPy commonly represents missing numeric values using NaN.
Functions such as np.isnan() can help identify them.
Pandas
Q29. What is Pandas?
Pandas is a Python library used for data cleaning, analysis, and manipulation.
Q30. What is a Series?
A Series is a one-dimensional labeled data structure.
Q31. What is a DataFrame?
A DataFrame is a table-like structure with rows and columns.
It is one of the most commonly used objects in Data Science.
Q32. How do you read a CSV file in Pandas?
df = pd.read_csv(“data.csv”)
Q33. What does head() do?
head() displays the first few rows of a DataFrame.
It is useful for quickly checking the data.
Q34. What does info() show?
info() shows:
Columns
Data types
Non-null values
Memory usage
Q35. What does describe() do?
describe() gives summary statistics such as:
mean, standard deviation, minimum, maximum, and quartiles
Q36. How do you find missing values?
df.isnull().sum()
This shows the number of missing values in each column.
Q37. How do you handle missing values?
Common options are:
Remove rows
Fill with mean/median/mode
Use domain-based values
The choice depends on the data.
Q38. How do you remove duplicates?
df.drop_duplicates()
Before removing them, confirm whether they are true duplicates.
Q39. What is groupby()?
groupby() groups data and performs calculations.
Example:
df.groupby(“City”)[“Sales”].sum()
Q40. What is the difference between loc and iloc?
loc: Selects using labels.
iloc: Selects using row or column positions.
Practical Scenario
“A dataset contains missing values and duplicate rows. What would you do?”
A natural answer:
“I would first inspect how much data is missing and whether the duplicates are genuine errors. Then I would choose removal or replacement based on the column and business meaning instead of applying one rule to the whole dataset.”
Practice Strategy
Take one CSV dataset and practise:
Read Data → Check Shape → Inspect Columns → Find Missing Values → Remove Duplicates → Filter Rows → Group Data → Create Summary
Also practise explaining:
- List vs Tuple
- NumPy vs Pandas
- Series vs DataFrame
- loc vs iloc
- How you handle missing data
Part 3: Statistics, Probability & EDA
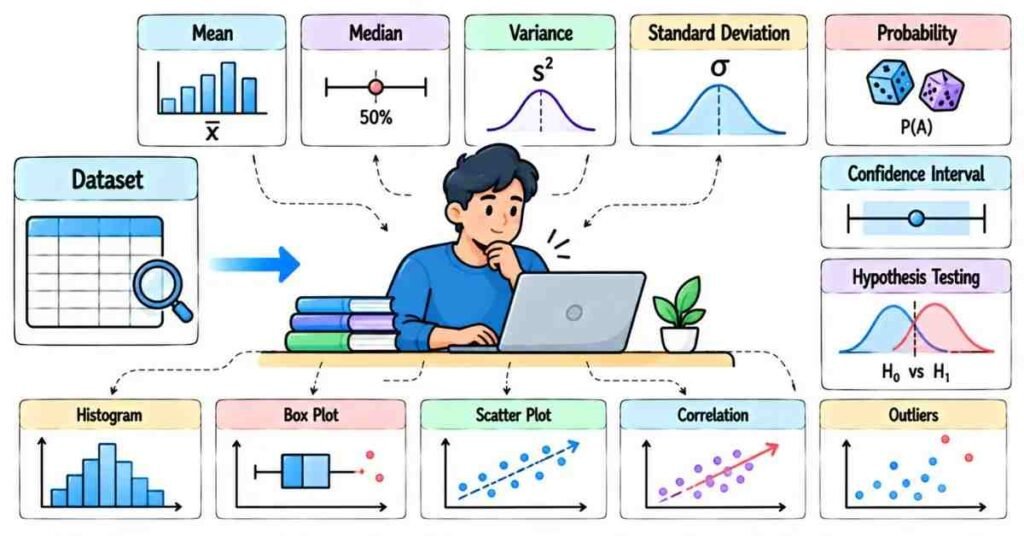
Statistics & EDA — Questions 41–75
Q41. What is Statistics?
Statistics is the process of collecting, analyzing, and interpreting data to make decisions.
Q42. What is Descriptive Statistics?
Descriptive Statistics summarizes existing data.
Examples:
Mean, Median, Standard Deviation
Q43. What is Inferential Statistics?
Inferential Statistics uses sample data to make conclusions about a larger population.
Q44. Population vs Sample?
Population: Complete group.
Sample: Smaller group selected from the population.
Q45. What is Mean?
Mean is the average value.
Mean = Sum of values / Number of values
Q46. What is Median?
Median is the middle value after arranging data in order.
It is useful when data contains outliers.
Q47. What is Mode?
Mode is the value that appears most frequently.
Q48. Mean vs Median?
Mean is affected by extreme values.
Median is usually more stable when the data contains large outliers.
Q49. What is Variance?
Variance measures how far values are spread from the mean.
Higher variance means greater spread.
Q50. What is Standard Deviation?
Standard Deviation measures data spread in the same unit as the original values.
Q51. What is an Outlier?
An outlier is a value that is unusually far from most other observations.
It should be investigated before removal.
Probability
Q52. What is Probability?
Probability measures how likely an event is to happen.
Its value ranges from 0 to 1.
Q53. What is Conditional Probability?
Conditional probability measures the chance of one event happening when another event has already occurred.
Q54. What is Bayes’ Theorem?
Bayes’ Theorem updates a probability when new information becomes available.
It is commonly used in classification problems.
Q55. What is a Random Variable?
A random variable represents the numerical outcome of a random process.
Q56. What is a Probability Distribution?
A probability distribution shows how likely different values are.
Q57. What is a Normal Distribution?
A Normal Distribution is a symmetric bell-shaped distribution.
Many statistical methods assume data is approximately normal.
Q58. What is Skewness?
Skewness measures whether a distribution is tilted more toward one side.
Q59. Positive vs Negative Skew?
Positive skew: Longer tail on the right.
Negative skew: Longer tail on the left.
Q60. What is Sampling?
Sampling means selecting a smaller group from a population for analysis.
Q61. What is the Central Limit Theorem?
The Central Limit Theorem says that sample means tend to follow a normal distribution when sample size becomes sufficiently large under common conditions.
Q62. What is a Confidence Interval?
A confidence interval gives a range of plausible values for a population parameter.
Hypothesis Testing
Q63. What is Hypothesis Testing?
Hypothesis testing checks whether the data provides enough evidence to support a claim.
Q64. What is the Null Hypothesis?
The Null Hypothesis usually states that there is no meaningful difference or effect.
Q65. What is the Alternative Hypothesis?
The Alternative Hypothesis states that a meaningful difference or effect exists.
Q66. What is a p-value?
A p-value shows how compatible the observed result is with the null hypothesis.
A smaller p-value gives stronger evidence against the null hypothesis.
Q67. What is the Significance Level?
The significance level is the threshold chosen before testing.
A common value is 0.05.
Q68. What is a Type I Error?
Type I Error means rejecting a true null hypothesis.
It is a false positive.
Q69. What is a Type II Error?
Type II Error means failing to reject a false null hypothesis.
It is a false negative.
Q70. What is a t-test?
A t-test is used to compare means under suitable assumptions.
Example:
Comparing average sales of two groups.
Q71. What is a Chi-Square Test?
Chi-Square tests are commonly used to study relationships between categorical variables.
Correlation & EDA
Q72. What is Correlation?
Correlation measures the strength and direction of association between two variables.
Common measures include Pearson and Spearman correlation.
Q73. Correlation vs Causation?
Correlation means two variables move together.
Causation means one variable actually influences the other.
Correlation alone does not prove causation.
Q74. What is EDA?
EDA stands for Exploratory Data Analysis.
It helps us understand data before building a model.
Q75. What do you check during EDA?
Common checks include:
Data types
Missing values
Duplicates
Outliers
Distributions
Correlations
Class balance
Important patterns
Useful plots include:
Histogram, Box Plot, Bar Chart, Scatter Plot
Practical Scenario
“A salary dataset has a few extremely high values. Would you use Mean or Median?”
A practical answer:
“I would first inspect those values. If they are genuine extreme salaries, Median may represent the typical salary better because Mean can be pulled upward by large outliers.”
Practice Strategy
Take one dataset and check:
Mean → Median → Standard Deviation → Missing Values → Outliers → Distribution → Correlation
Then create:
Histogram → Box Plot → Scatter Plot
Practise explaining what each result tells you about the data.
Part 4: Machine Learning
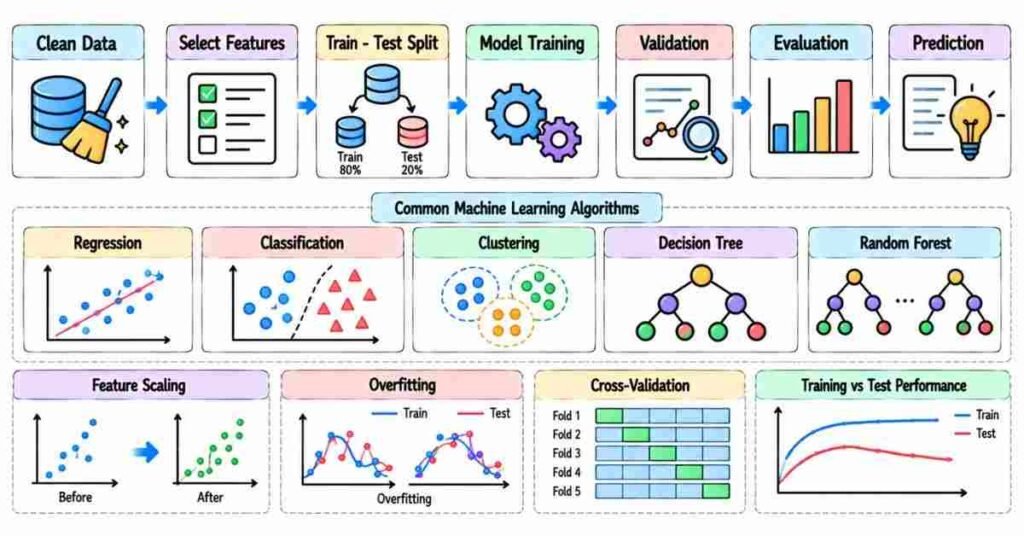
Machine Learning — Questions 76–110
Q76. What is Machine Learning?
Machine Learning allows systems to learn patterns from data and make predictions without being explicitly programmed for every rule.
Q77. What are the main types of Machine Learning?
The main types are:
Supervised Learning
Unsupervised Learning
Reinforcement Learning
Q78. What is Supervised Learning?
Supervised Learning uses labeled data.
Example:
Input: Customer details
Output: Churn or Not Churn
Q79. What is Unsupervised Learning?
Unsupervised Learning works with unlabeled data.
It is commonly used for clustering and pattern discovery.
Q80. What is Reinforcement Learning?
Reinforcement Learning learns through rewards and penalties based on actions.
Q81. What is Regression?
Regression predicts a continuous value.
Example:
House Price Prediction
Q82. What is Classification?
Classification predicts a category or class.
Example:
Spam or Not Spam
Q83. Regression vs Classification?
Regression: Predicts numbers.
Classification: Predicts categories.
Q84. What is Linear Regression?
Linear Regression models the relationship between input variables and a continuous target.
Q85. What is Logistic Regression?
Logistic Regression is mainly used for classification problems.
It predicts probabilities for classes.
Q86. What is a Decision Tree?
A Decision Tree makes predictions using a sequence of conditions.
It is easy to understand but can overfit.
Q87. What is Random Forest?
Random Forest combines many decision trees and uses their combined output.
It usually reduces overfitting compared with one tree.
Q88. What is K-Nearest Neighbors?
KNN predicts based on the nearest data points.
It works better when features are properly scaled.
Q89. What is Naive Bayes?
Naive Bayes is a probabilistic algorithm often used for text classification.
It assumes features are conditionally independent.
Q90. What is Support Vector Machine?
SVM finds a boundary that separates classes with maximum margin.
It works well for some high-dimensional problems.
Q91. What is clustering?
Clustering groups similar data points together without predefined labels.
Q92. What is K-Means?
K-Means divides data into K clusters based on similarity.
Q93. How do you choose K in K-Means?
Common methods include:
Elbow Method
Silhouette Score
Business understanding
Q94. What is overfitting?
Overfitting happens when a model learns training data too closely and performs poorly on new data.
Q95. What is underfitting?
Underfitting happens when the model is too simple to learn the important patterns.
Q96. How can overfitting be reduced?
Common methods include:
More data
Regularization
Simpler model
Cross-validation
Pruning
Dropout for neural networks
Q97. What is train-test split?
The dataset is divided into:
Training data: Used to learn.
Test data: Used to evaluate final performance.
Q98. What is validation data?
Validation data is used to compare models and tune settings before final testing.
Q99. What is cross-validation?
Cross-validation trains and evaluates a model on different data splits.
It gives a more reliable estimate of model performance.
Q100. What is a feature?
A feature is an input variable used by the model.
Example:
Age, Salary, Purchase Count
Q101. What is a target variable?
The target is the value the model tries to predict.
Example:
Customer Churn
Q102. What is feature scaling?
Feature scaling brings numerical features to comparable ranges.
It is useful for algorithms such as KNN and SVM.
Q103. What is normalization?
Normalization usually scales values into a fixed range such as 0 to 1.
Q104. What is standardization?
Standardization transforms data around:
Mean = 0
Standard Deviation = 1
Q105. What is hyperparameter tuning?
Hyperparameter tuning finds better model settings.
Examples:
Tree depth
Number of trees
Learning rate
Q106. What is Grid Search?
Grid Search tests predefined combinations of hyperparameters.
Q107. What is Random Search?
Random Search tests randomly selected hyperparameter combinations.
It can be faster when many parameters exist.
Q108. What is ensemble learning?
Ensemble learning combines multiple models to improve prediction quality.
Examples:
Random Forest, Bagging, Boosting
Q109. What is Bagging?
Bagging trains multiple models independently and combines their results.
It mainly helps reduce variance.
Q110. What is Boosting?
Boosting trains models sequentially, where later models focus more on previous errors.
Examples:
AdaBoost, Gradient Boosting, XGBoost
Practical Scenario
“Your model gives 98% training accuracy but only 75% test accuracy. What does this suggest?”
A practical answer:
“It likely indicates overfitting. I would check model complexity, cross-validation results, regularization, feature quality, and whether more training data is needed.”
Another Scenario
“Would you always choose the model with the highest accuracy?”
No.
The right model depends on:
- Business goal
- Precision and Recall
- Interpretability
- Prediction speed
- Data size
- Cost of errors
Practice Strategy
Take one classification dataset and practise:
Clean Data → Select Features → Train Model → Evaluate → Compare Models
Compare:
Logistic Regression → Decision Tree → Random Forest
Then explain:
- Why did you choose the model?
- Did it overfit?
- Which metric did you use?
- What would you improve?
Part 5: Deep Learning & NLP
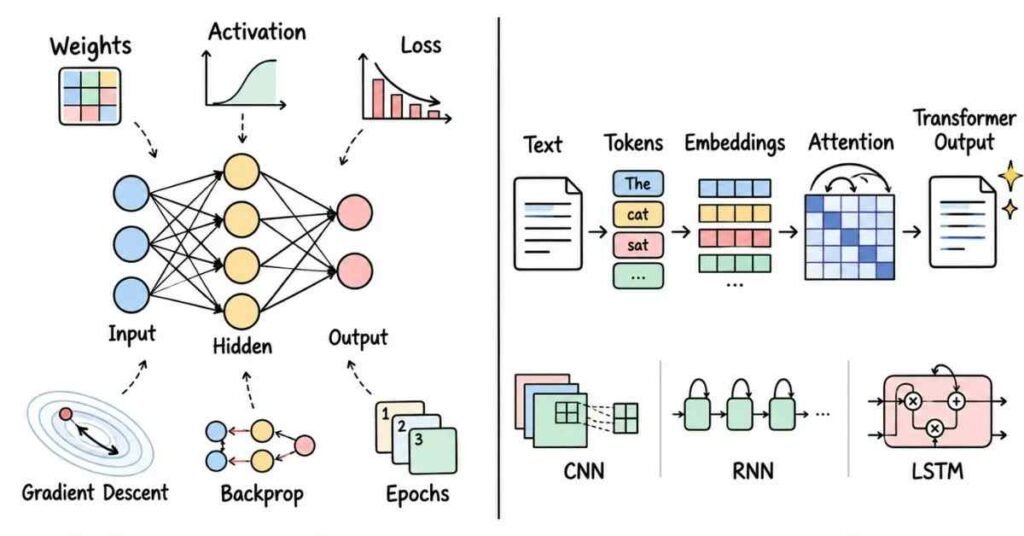
Deep Learning & NLP — Questions 111–145
Q111. What is Deep Learning?
Deep Learning uses neural networks with multiple layers to learn complex patterns from data.
It is widely used in images, text, speech, and AI systems.
Q112. What is a Neural Network?
A neural network is a model made of connected layers that transform input data into predictions.
Q113. What are the main layers in a Neural Network?
Common layers are:
Input Layer → Hidden Layers → Output Layer
Q114. What is a neuron?
A neuron receives inputs, applies weights and a calculation, then passes the result forward.
Q115. What are weights?
Weights control how strongly each input influences the model’s output.
They are updated during training.
Q116. What is bias?
Bias is an additional value that helps the model fit patterns more flexibly.
Q117. What is an activation function?
An activation function adds non-linearity to a neural network.
Common examples:
ReLU, Sigmoid, Tanh
Q118. What is ReLU?
ReLU returns zero for negative values and keeps positive values.
It is commonly used in hidden layers.
Q119. What is Sigmoid?
Sigmoid converts a value into a range between 0 and 1.
It is often used for binary classification outputs.
Q120. What is a loss function?
A loss function measures how far model predictions are from actual values.
Training tries to reduce this loss.
Q121. What is Gradient Descent?
Gradient Descent updates model parameters step by step to reduce loss.
Q122. What is the learning rate?
The learning rate controls how large each parameter update is.
Too high may make training unstable; too low may make training slow.
Q123. What is Backpropagation?
Backpropagation calculates how much each weight contributed to the error and updates the network accordingly.
Q124. What is an epoch?
One epoch means the model has processed the full training dataset once.
Q125. What is batch size?
Batch size is the number of training samples processed before updating model weights.
Q126. What is overfitting in Deep Learning?
The model performs very well on training data but poorly on new data.
Q127. How can Deep Learning overfitting be reduced?
Common methods include:
Dropout
Regularization
More data
Data augmentation
Early stopping
Q128. What is Dropout?
Dropout temporarily disables some neurons during training.
This can reduce over-dependence on specific neurons.
CNN & Sequence Models
Q129. What is a CNN?
CNN stands for Convolutional Neural Network.
It is commonly used for image-related tasks.
Q130. What is convolution?
Convolution applies filters to input data to detect useful patterns such as edges and shapes.
Q131. What is pooling?
Pooling reduces feature-map size while keeping important information.
Q132. What is an RNN?
RNN stands for Recurrent Neural Network.
It is designed for sequential data such as text or time series.
Q133. What is the limitation of basic RNNs?
Basic RNNs can struggle to remember information across long sequences.
Q134. What is LSTM?
LSTM is a type of recurrent network designed to keep important information for longer periods.
NLP Fundamentals
Q135. What is NLP?
NLP stands for Natural Language Processing.
It helps computers work with human language.
Q136. What is tokenization?
Tokenization splits text into smaller units such as words or subwords.
Example:
“AI is useful” → [“AI”, “is”, “useful”]
Q137. What are stop words?
Stop words are common words such as the, is, and that may be removed in some traditional NLP tasks.
Q138. What is stemming?
Stemming reduces words to a basic root form.
Example:
playing → play
Q139. What is lemmatization?
Lemmatization converts words into their meaningful dictionary base form.
It is usually more language-aware than stemming.
Q140. What is TF-IDF?
TF-IDF converts text into numerical features by measuring how important a word is within a document compared with the full collection.
Q141. What is a word embedding?
A word embedding represents words as numerical vectors.
Similar words are placed closer in vector space.
Q142. What is attention?
Attention helps a model focus more on the most relevant parts of the input.
Q143. What is a Transformer?
A Transformer is a neural-network architecture built around attention.
It is widely used for modern NLP tasks.
Q144. What is BERT?
BERT is a Transformer-based model designed to understand text context in both directions.
It is commonly used for classification and language-understanding tasks.
Q145. Deep Learning vs Machine Learning?
Machine Learning: Often works well with structured data and manually prepared features.
Deep Learning: Learns complex representations automatically and is especially useful for images, text, and large datasets.
Practical Scenario
“Your neural network performs well on training data but poorly on validation data. What would you check?”
A practical answer:
“I would check for overfitting. I may try dropout, regularization, early stopping, more training data, or a simpler network.”
Another Scenario
“Would you always use Deep Learning instead of traditional Machine Learning?”
No.
For smaller structured datasets, models such as Logistic Regression, Random Forest, or XGBoost may be simpler and perform very well.
Deep Learning is more useful when the problem and data justify its extra complexity.
Practice Strategy
Practise explaining:
Neural Network → Activation → Loss → Gradient Descent → Backpropagation
Then revise:
CNN → RNN → LSTM → Tokenization → TF-IDF → Embeddings → Attention → Transformer
Part 6: SQL, Feature Engineering & Model Evaluation
Fresh wording lo, short ga maintain chesthanu. Exact 0% AI-detector score guarantee cheyyalem, but content ni original, natural, and simple style lo rasthunna.
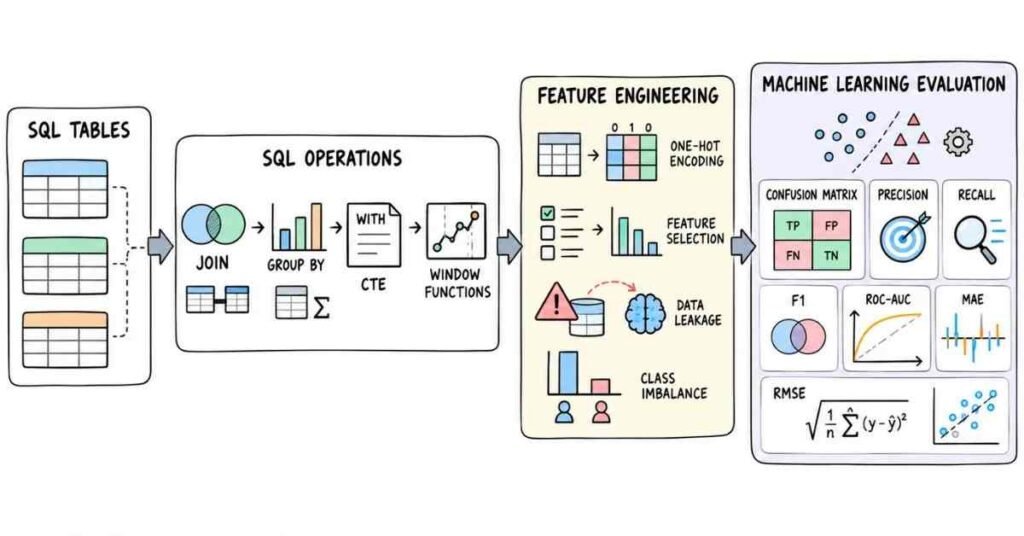
SQL, Feature Engineering & Evaluation — Questions 146–180
Q146. Why is SQL important in Data Science?
SQL helps Data Scientists extract, filter, join, and summarize data stored in databases.
Q147. What is a primary key?
A primary key uniquely identifies each row in a table.
Q148. What is a foreign key?
A foreign key connects one table with another related table.
Q149. What is an INNER JOIN?
It returns only matching rows from both tables.
Q150. What is a LEFT JOIN?
It returns all rows from the left table and matching rows from the right table.
Q151. What is GROUP BY?
GROUP BY combines similar rows so aggregate calculations can be performed.
Q152. What is HAVING?
HAVING filters grouped results after GROUP BY.
Q153. WHERE vs HAVING?
WHERE: Filters rows before grouping.
HAVING: Filters groups after aggregation.
Q154. What is a subquery?
A subquery is a query written inside another SQL query.
Q155. What is a CTE?
A CTE is a temporary named result used inside a SQL query.
Q156. What is a window function?
Window functions calculate values across related rows without combining them into one row.
Example: ROW_NUMBER().
Q157. What is an index?
An index helps the database find records faster.
Too many indexes can slow writes.
Q158. What is feature engineering?
Feature engineering creates or improves variables used by a machine learning model.
Q159. Why is feature engineering important?
Better features can improve model performance more than simply using a more complex algorithm.
Q160. What is feature selection?
Feature selection keeps useful variables and removes irrelevant or redundant ones.
Q161. What is feature extraction?
Feature extraction creates new features from existing data.
Q162. How do you handle categorical data?
Common methods include:
One-hot encoding
Label encoding
Target-based techniques when appropriate
Q163. What is one-hot encoding?
It converts categories into separate binary columns.
Q164. What is label encoding?
It converts categories into numerical labels.
Q165. What is multicollinearity?
Multicollinearity occurs when input features are strongly related to each other.
It can affect some models.
Q166. What is data leakage?
Data leakage happens when information unavailable at prediction time enters model training.
It can make results look unrealistically good.
Q167. What is class imbalance?
Class imbalance happens when one class has far more examples than another.
Example:
95% Non-Fraud, 5% Fraud
Q168. How can class imbalance be handled?
Possible methods include:
Resampling
Class weights
Better evaluation metrics
Q169. What is a confusion matrix?
A confusion matrix shows:
True Positive, True Negative, False Positive, False Negative
Q170. What is Accuracy?
Accuracy is the percentage of total predictions that are correct.
Q171. What is Precision?
Precision measures how many predicted positives were actually positive.
Q172. What is Recall?
Recall measures how many actual positive cases the model correctly found.
Q173. Precision vs Recall?
Use Precision when false positives are costly.
Use Recall when missing a positive case is costly.
Q174. What is F1-score?
F1-score balances Precision and Recall.
It is useful when classes are uneven.
Q175. What is ROC-AUC?
ROC-AUC measures how well a classifier separates classes across different thresholds.
Q176. What is MAE?
MAE is the average absolute difference between predicted and actual values.
Q177. What is MSE?
MSE averages squared prediction errors.
Large errors receive more penalty.
Q178. What is RMSE?
RMSE is the square root of MSE.
It gives error in the same unit as the target.
Q179. How do you choose the right evaluation metric?
Choose based on the business problem.
Example:
Fraud detection → Recall may matter more than Accuracy.
Q180. How do you know if a model is good?
Check:
Validation performance
Correct metric
Overfitting
Business usefulness
Performance on unseen data
Practical Scenario
“A fraud model has 98% accuracy but misses most fraud cases. Is it good?”
No.
Accuracy is misleading because the classes may be imbalanced.
I would check Recall, Precision, F1-score, and the confusion matrix.
Practice Strategy
Practise:
SQL Joins → GROUP BY → Window Functions → Feature Engineering → Data Leakage → Precision → Recall → F1 → ROC-AUC
For each model, ask:
Which metric matters for the business problem?
Part 7: MLOps, Deployment & Production AI
Fresh wording lo, short and natural ga rasthunna. Exact 0% AI-detector score guarantee cheyyalem, but content ni copied/template-style kakunda original wording lo maintain chesthanu.
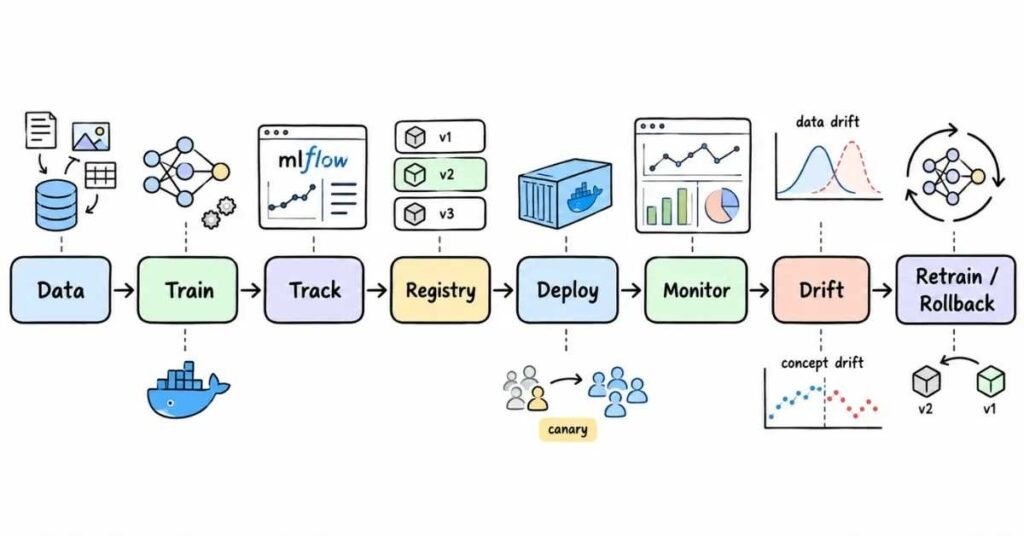
MLOps & Deployment — Questions 181–210
Q181. What is MLOps?
MLOps is the practice of managing ML models from development to deployment, monitoring, and retraining.
Q182. Why is MLOps needed?
A model is useful only when it works reliably after deployment.
MLOps helps manage versions, monitoring, updates, and failures.
Q183. What is model deployment?
Model deployment makes a trained model available for real users or applications.
Q184. Batch prediction vs Real-time prediction?
Batch: Predictions are created in groups.
Real-time: Prediction is returned immediately after a request.
Q185. When is batch prediction useful?
Batch prediction works well when immediate output is not required.
Example: Monthly customer churn scoring.
Q186. When is real-time prediction useful?
Use it when the response is needed immediately.
Example: Fraud detection during payment.
Q187. How can a model be exposed to an application?
A common method is to wrap the model inside an API.
Example:
Application → Prediction API → Model
Q188. What is model serialization?
Serialization saves a trained model so it can be loaded later without retraining.
Q189. What is Docker used for in ML?
Docker packages the model, code, and dependencies into one consistent environment.
Q190. Why is reproducibility important?
Another developer should be able to reproduce the same experiment using the same code, data, and settings.
Q191. What is experiment tracking?
Experiment tracking records:
Model
Parameters
Metrics
Dataset version
Results
It helps compare experiments.
Q192. What is MLflow?
MLflow is commonly used to track ML experiments, models, and model versions.
Q193. What is a model registry?
A model registry keeps approved model versions in one managed place.
Q194. What is model versioning?
Model versioning tracks different versions of a trained model.
It helps compare, deploy, or roll back models safely.
Q195. What is CI/CD in Machine Learning?
CI/CD automates testing and deployment when code or model changes are approved.
Q196. What is a training pipeline?
A training pipeline connects steps such as:
Data → Cleaning → Features → Training → Evaluation → Model
Q197. What is an inference pipeline?
An inference pipeline prepares new data and sends it to the deployed model for prediction.
Q198. What is model monitoring?
Model monitoring checks whether the deployed model continues to perform correctly.
Q199. What should be monitored after deployment?
Common checks include:
Prediction quality
Latency
Errors
Input data
Drift
Resource usage
Q200. What is data drift?
Data drift happens when production input data changes from the data used during training.
Q201. What is concept drift?
Concept drift happens when the relationship between inputs and the target changes over time.
Q202. Data drift vs Concept drift?
Data drift: Input distribution changes.
Concept drift: The pattern connecting input and output changes.
Q203. What is model retraining?
Retraining means training the model again using newer or improved data.
Q204. When should a model be retrained?
Possible triggers include:
Performance drop
Major data drift
New data
Business-rule changes
Q205. What is model rollback?
Rollback means returning to an older stable model when the new version causes problems.
Q206. What is A/B testing for ML models?
Two model versions are tested with different user groups to compare real-world performance.
Q207. What is Canary Deployment?
A new model is first given a small amount of traffic.
If it works well, traffic is increased gradually.
Q208. What is prediction latency?
Prediction latency is the time between sending model input and receiving the prediction.
Q209. Why can a model perform well offline but poorly in production?
Possible reasons include:
Different production data
Data drift
Wrong preprocessing
Data leakage during training
Missing features
Changed user behavior
Q210. What makes an ML model production-ready?
A production model should have:
Good validation → Reliable deployment → Monitoring → Versioning → Retraining plan → Rollback support
Practical Scenario
“Your model had good test accuracy, but production performance dropped after three months. What would you check?”
A natural answer:
“I would compare current production data with the training data, check for data or concept drift, verify preprocessing, and review model metrics. If the change is real, I would consider retraining with newer data.”
Practice Strategy
Practise this flow:
Data → Training → Evaluation → Registry → Deployment → Monitoring → Retraining
Then explain:
- How will you deploy the model?
- How will you detect drift?
- When should retraining happen?
- How will you roll back a bad model?
- What metrics should be monitored?
Part 8: Generative AI, LLMs & Scenario-Based Questions
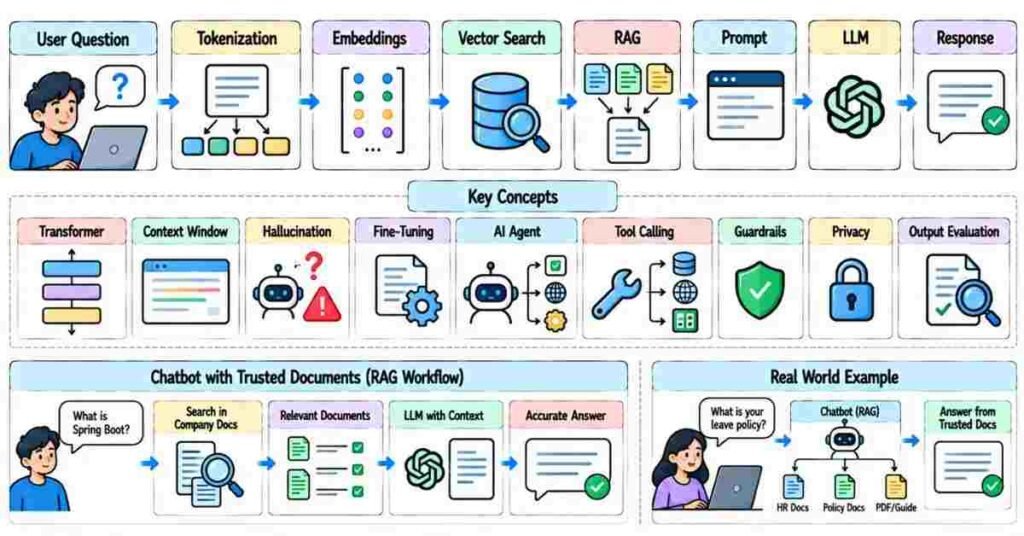
Generative AI & LLMs — Questions 211–240
Q211. What is Generative AI?
Generative AI creates new content such as text, images, code, or audio based on patterns learned from data.
Q212. How is Generative AI different from traditional Machine Learning?
Traditional ML mainly predicts or classifies.
Generative AI creates new outputs.
Q213. What is an LLM?
LLM stands for Large Language Model.
It is trained on large amounts of text and can understand and generate language.
Q214. What is a Transformer?
Transformer is the architecture behind many modern language models.
It uses attention to understand relationships between words.
Q215. What is self-attention?
Self-attention helps the model identify which words are important to each other in the same input.
Q216. What is a token?
A token is a small unit of text processed by the model.
It may be a word, part of a word, or punctuation.
Q217. What is tokenization?
Tokenization converts text into tokens before the model processes it.
Q218. What is an embedding?
An embedding converts text into a numerical vector.
Similar meanings usually have similar vector representations.
Q219. What are vector databases?
Vector databases store and search embeddings.
They are useful for semantic search and RAG systems.
Q220. What is semantic search?
Semantic search finds content based on meaning rather than exact keyword matching.
Q221. What is prompt engineering?
Prompt engineering means writing clear instructions so an AI model gives more useful output.
Q222. What makes a good prompt?
A good prompt includes:
Context
Goal
Required format
Constraints
Relevant examples
Q223. What is zero-shot prompting?
The model answers a task without being given examples.
Q224. What is few-shot prompting?
The prompt includes a few examples to show the expected pattern.
Q225. What is hallucination in Generative AI?
Hallucination happens when the model gives information that sounds correct but is actually wrong or unsupported.
Q226. How can hallucinations be reduced?
Possible methods include:
Better prompts
RAG
Reliable source data
Output validation
Human review
Q227. What is RAG?
RAG stands for Retrieval-Augmented Generation.
It retrieves relevant information first and gives that context to the language model before generating an answer.
Q228. Why use RAG?
RAG helps the model answer using relevant external knowledge instead of depending only on what it learned during training.
Q229. What is fine-tuning?
Fine-tuning trains an existing model further on a smaller task-specific dataset.
Q230. RAG vs Fine-tuning?
RAG: Adds external knowledge at query time.
Fine-tuning: Changes model behavior using additional training.
Q231. What is context window?
Context window is the amount of text a model can consider at one time.
Q232. What is temperature?
Temperature controls how random or creative the output is.
Lower values are usually more predictable.
Q233. What is an AI agent?
An AI agent can use a model together with tools, memory, and steps to complete a task.
Q234. What is tool calling?
Tool calling allows a model to use external functions or systems.
Example:
LLM → Database Tool → Result → Final Answer
Q235. What are guardrails in AI?
Guardrails are rules and checks used to keep AI outputs safe, relevant, and within expected limits.
Q236. What is model evaluation for Generative AI?
Evaluation checks whether outputs are:
Correct
Relevant
Safe
Consistent
Useful
Q237. How would you evaluate a chatbot?
I would check:
Answer quality → Retrieval quality → Hallucination rate → Latency → User feedback
Q238. What is prompt injection?
Prompt injection is an attempt to manipulate an AI system through malicious or misleading instructions.
Q239. How can sensitive data be protected in AI systems?
Use:
Access control
Data filtering
Secret management
Logging
Input/output checks
Sensitive data should not be exposed unnecessarily.
Q240. What makes a good GenAI solution?
A good solution should have:
Clear use case → Reliable data → Good prompts → Evaluation → Security → Monitoring
Practical Scenario
“A company chatbot gives wrong answers even though the correct information exists in internal documents. What would you check?”
A natural answer:
“I would first check whether the right documents are being retrieved. Then I would review chunking, embeddings, search quality, prompt context, and whether the model is using retrieved information correctly.”
Another Scenario
“Would you fine-tune a model immediately for company FAQs?”
Not always.
For changing company information, RAG may be a better first option because documents can be updated without retraining the model.
Practice Strategy
Practise explaining:
LLM → Tokens → Embeddings → Vector Search → RAG → Prompt → Response
Then ask:
- Why use RAG?
- When is fine-tuning useful?
- How do you reduce hallucinations?
- How would you evaluate a chatbot?
- How do you protect private data?
Part 9: Behavioral, Communication & Career Strategy
The STAR Method
For experience-based questions, keep the answer simple:
Situation: What happened?
Task: What were you responsible for?
Action: What did you personally do?
Result: What changed in the end?
The reference PDF also uses STAR as the main framework for behavioral answers.
20 Behavioral Interview Questions
Q1. Tell me about yourself.
Keep it around one minute.
Talk about your background, Data Science skills, one strong project, and the kind of role you are looking for.
Q2. Explain one Data Science project.
Start with the problem.
Then explain the data, what you tried, which model you used, and what result you got.
Q3. Tell me about a messy dataset you handled.
Mention what was wrong with the data and how you cleaned it.
Do not just say, “I removed missing values.”
Q4. Tell me about a model that failed.
Explain why it failed and what you changed.
Interviewers usually care more about your thinking than the failure itself.
Q5. Describe an overfitting problem.
You can say the training score looked strong, but validation performance was poor.
Then explain how you reduced the gap.
Q6. Tell me about a time data changed your decision.
Explain what you first expected, what the data showed, and how your final decision changed.
Q7. Tell me about a mistake you made.
Choose a real mistake.
Keep the focus on how you corrected it and what you changed afterward.
Q8. How do you handle missing values?
First understand why the value is missing.
Then decide whether to remove, replace, or keep it based on the column and business meaning.
Q9. How would you explain a model to a non-technical manager?
Avoid algorithm details first.
Explain what the model predicts, what inputs it uses, and how the result helps the business.
Q10. Tell me about a disagreement in a project.
Show that you compared evidence instead of arguing from preference.
Q11. How do you manage several tasks at once?
Prioritize work based on impact, deadline, and dependency.
Q12. Tell me about learning a new tool quickly.
Mention how you used documentation, small tests, and one practical task to learn it.
Q13. How do you handle feedback?
Listen first.
If the feedback improves the work, apply it and understand why the change matters.
Q14. Tell me about a production model issue.
A simple flow is:
Issue → Investigation → Cause → Fix → Validation
Q15. What would you do if model performance drops after deployment?
Check current data, preprocessing, drift, missing features, and model metrics before deciding to retrain.
Q16. Why do you want to work in Data Science?
Connect your answer to solving real problems with data, not only to salary or job demand.
Q17. What is your strongest skill?
Choose one skill you can prove with a project.
For example:
SQL, Python, EDA, Machine Learning, or problem-solving.
Q18. What is your weakness?
Pick something genuine and manageable.
Then explain what you are doing to improve it.
Q19. Where do you see yourself in three years?
A natural answer:
“I want to become strong enough to handle a Data Science problem from raw data to deployment and explain the result clearly to both technical and business teams.”
Q20. Do you have any questions for us?
You can ask:
What kind of Data Science problems does the team work on?
How are models moved into production?
How do you monitor model performance?
What does success look like in this role?
How much ownership will I have?
The reference guide also closes its behavioral section with thoughtful questions for the interviewer.
50 Self-Preparation Prompts
Technical Practice — 1–20
Ask me 10 Python questions one by one.
Test me on Pandas.
Quiz me on NumPy.
Give me a missing-value problem.
Ask me EDA questions.
Test me on probability.
Quiz me on hypothesis testing.
Ask me SQL joins.
Test me on regression.
Ask me classification questions.
Give me an overfitting scenario.
Test me on feature engineering.
Ask me about data leakage.
Quiz me on Precision and Recall.
Test me on Deep Learning.
Ask me NLP questions.
Quiz me on Transformers.
Ask me RAG questions.
Give me an MLOps scenario.
Run a Data Science mock interview.
Behavioral Practice — 21–35
Improve my introduction.
Review my project explanation.
Turn my project into a STAR story.
Ask me about a failed model.
Ask me about messy data.
Review my teamwork answer.
Ask me about a mistake.
Help me answer feedback questions.
Ask me about deadlines.
Simulate a production issue.
Ask me to explain a model simply.
Test my problem-solving approach.
Run a behavioral interview.
Give me five questions to ask the interviewer.
Check whether my answers show my own contribution.
Career Practice — 36–50
Improve my resume summary.
Write a Data Science LinkedIn headline.
Improve my project bullets.
Suggest ATS keywords.
Review my skills section.
Improve my GitHub project description.
Suggest portfolio projects.
Help me explain a career switch.
Write a thank-you email.
Improve my ML project description.
Review my resume for Data Science roles.
Help me prepare for salary discussion.
Suggest LinkedIn Featured content.
Create a 7-day revision plan.
Conduct a full Data Science with AI interview.
Resume Optimization
1. Headline
Data Scientist | Python | SQL | Machine Learning | Generative AI
2. Professional Summary
Keep it to 3–4 lines.
Mention your background, strongest skills, one area of project work, and target role.
3. Skills
Programming: Python, SQL
Data: Pandas, NumPy
ML: Scikit-learn
AI: NLP, LLMs, RAG
Deployment: Docker, MLflow basics
4. Experience / Projects
Avoid:
“Worked on churn prediction.”
Better:
“Built a customer churn model using Python and compared multiple classifiers using Precision, Recall, and F1-score.”
5. Education
Add degree, college, and graduation details.
6. Projects
Strong options:
Customer Churn
Fraud Detection
Recommendation System
Sales Forecasting
Sentiment Analysis
RAG Chatbot
LinkedIn Profile
The reference PDF also keeps LinkedIn preparation separate from resume preparation.
Headline
Data Scientist | Machine Learning | Python | SQL | Generative AI
About
Use three short paragraphs:
Who you are
What you can work on
What role you are looking for
Featured
Add:
- GitHub projects
- ML notebooks
- Dashboards
- AI demos
- Project case studies
Portfolio Strategy
For every project, show:
Problem → Data → Cleaning → Approach → Model → Evaluation → Result
For GenAI projects, add:
Retrieval → Prompt → Model → Evaluation → Limitations
A portfolio is stronger when the interviewer can see how you thought through the problem.
Salary Guidance
Salary varies by company, location, project depth, and interview performance.
Role | Experience | Broad India Range |
Data Analyst | 0–2 years | ₹3–7 LPA |
Junior Data Scientist | 0–2 years | ₹4–9 LPA |
Data Scientist | 2–5 years | ₹7–18 LPA |
AI / ML Engineer | 2–5 years | ₹8–20 LPA |
Use these only as rough planning ranges.
Post-Interview Follow-Up
Thank-You Email
Subject: Thank You — Data Science Interview
Hi [Interviewer Name],
Thank you for taking the time to speak with me today. I enjoyed our discussion, especially the part about Data Science and Machine Learning work.
The role sounds interesting, and I would be happy to contribute to the team.
Best regards,
[Your Name]
Follow-Up Email
Subject: Following Up — Data Science Interview
Hi [Name],
I wanted to follow up on my interview for the Data Science role. I remain interested in the opportunity and wanted to check whether there is any update on the next step.
Best regards,
[Your Name]
The reference PDF also places thank-you and follow-up templates near the end of the guide.
Final Interview Checklist
Technical
Python revised
SQL practised
Statistics revised
ML algorithms reviewed
Metrics understood
Deep Learning basics revised
RAG and LLM basics reviewed
One strong project ready
Mock interview completed
Behavioral
Introduction ready
5–8 STAR stories ready
One failure story ready
One difficult-data story ready
Strength and weakness prepared
Questions for interviewer ready
Profile
Resume updated
LinkedIn updated
GitHub checked
Portfolio organized
Project descriptions reviewed
Day Before Interview
Read your resume once
Review project flow
Revise key metrics
Check laptop and internet
Sleep properly instead of learning new topics