
Advanced Excel with AI Interview Preparation Guide 2026
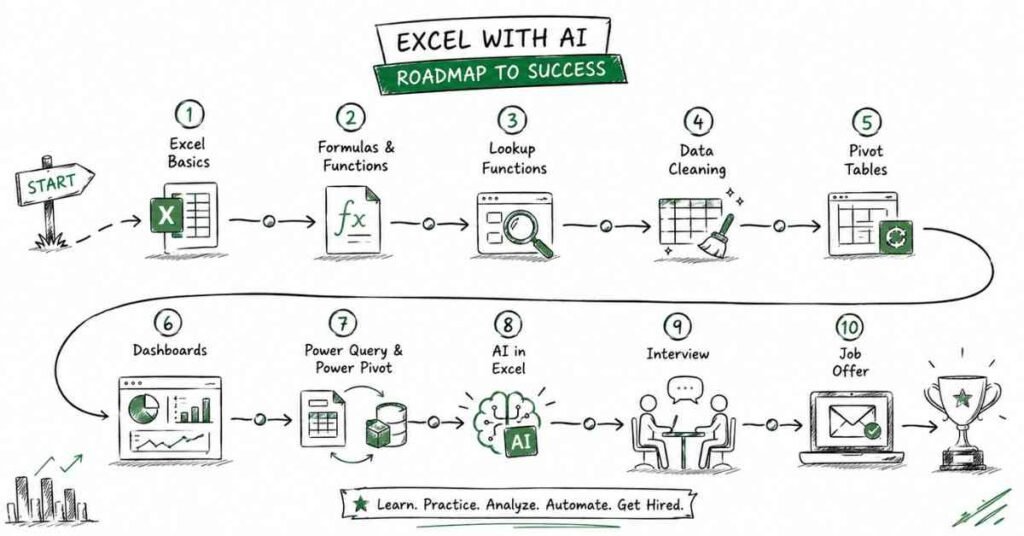
Table of Contents
Part 1: Introduction & 30-Day Study Plan
This first part sets the direction for Advanced Excel with AI interview preparation. It explains what Excel interviews test, why AI matters in modern Excel workflows, and how to build a practical 30-day plan that makes you interview-ready.
What this guide covers
This first part sets the direction for Advanced Excel with AI interview preparation. It explains what Excel interviews test, why AI matters in modern Excel workflows, and how to build a practical 30-day plan that makes you interview-ready.
Who this guide is for
This guide is useful if you are:
- A fresher preparing for your first Excel or MIS interview.
- A student targeting analyst, operations, finance, or reporting roles.
- A candidate moving from basic Excel to advanced Excel with AI tools.
- A working professional preparing for data, reporting, or operations interviews.
- A candidate who knows formulas but is not yet confident solving interview questions under pressure.
The structure is meant to help both beginners and experienced candidates build confidence step by step. It gives you a clear path from fundamentals to interview execution.
What Excel is and why it matters
Excel is a spreadsheet tool used to store, organize, calculate, analyze, and present data. It is used across business, finance, operations, reporting, analytics, and many administrative workflows.
Excel matters because it helps professionals work with data quickly without needing a full programming environment. It is one of the most common tools used to clean data, build reports, summarize information, and support decision-making.
A simple way to think about Excel is this: it is a flexible data tool for calculation, analysis, and reporting. If you can use Excel well, you can solve many everyday business problems efficiently.
Where Excel fits in real work
In real companies, Excel is used for MIS reporting, sales tracking, finance analysis, dashboards, data cleaning, inventory management, scheduling, and operational reporting. Common tasks include:
- Preparing daily, weekly, and monthly reports.
- Cleaning and validating raw data.
- Summarizing large datasets.
- Building dashboards and charts.
- Tracking targets, KPIs, and performance metrics.
- Supporting analysis for managers and stakeholders.
This is why Excel interviews test more than basic typing or formatting. Interviewers often want to see whether you can use formulas, filters, pivot tables, and AI-assisted features to solve practical business problems.
Common Excel-related roles
Excel interviews vary depending on the role. Common role types include:
- MIS Executive: reporting, formatting, tracking, and data summaries.
- Data Analyst: analysis, formulas, pivot tables, and dashboards.
- Operations Executive: tracking, reconciliation, and report handling.
- Finance/Accounts Executive: calculations, reconciliation, and statement analysis.
- HR/Recruitment Support: tracker management, reporting, and data cleanup.
- Business Analyst: structured reporting and business metrics.
- Reporting Analyst: recurring dashboards, summaries, and validation.
Understanding the role early helps you focus your preparation. An MIS role may focus more on reporting and formatting, while a data analyst role may focus more on formulas, lookups, and dashboard logic.
Common interview process
A typical Excel interview process often includes:
- HR or recruiter screening.
- Basic Excel round.
- Formula and function round.
- Data cleaning or worksheet task.
- Pivot table and reporting round.
- Scenario-based analysis questions.
- AI or automation awareness questions.
- Behavioral or hiring manager round.
In many interviews, Excel questions are mixed with practical reasoning. You may be asked to explain how you would clean data, calculate totals, summarize reports, and use AI to speed up repetitive work.
Core skill areas interviewers usually check
Most Excel interviews evaluate some combination of:
- Workbook and worksheet basics.
- Cell references and formatting.
- Formulas and functions.
- Lookup logic.
- Data cleaning and validation.
- Date, text, and logical handling.
- Pivot tables and charts.
- Dashboard basics.
- AI-assisted productivity.
- Reporting accuracy and business reasoning.
These areas appear repeatedly because they reflect real office work. If you are comfortable with these topics, you can handle most interview rounds with confidence.
Why AI matters in Excel interviews
AI is becoming important because modern Excel users are expected to work faster and make better decisions with less manual effort. AI tools can help with formula suggestions, data summaries, pattern detection, and productivity.
A strong candidate does not just say “I use AI.” A strong candidate explains how AI helps with real tasks like cleaning data, generating summaries, understanding formulas, or speeding up repetitive reporting work.
How to think in Excel interviews
A strong Excel answer usually follows this structure:
- Understand the task clearly.
- Identify the data structure.
- Choose the right formula, feature, or tool.
- Apply the logic step by step.
- Check for errors and edge cases.
- Explain how AI or automation could improve efficiency.
For example, if asked to find duplicate values and clean a dataset, do not jump straight into random shortcuts. First identify the column, determine whether duplicates should be removed or flagged, and then choose the correct Excel method. That kind of reasoning is what interviewers look for.
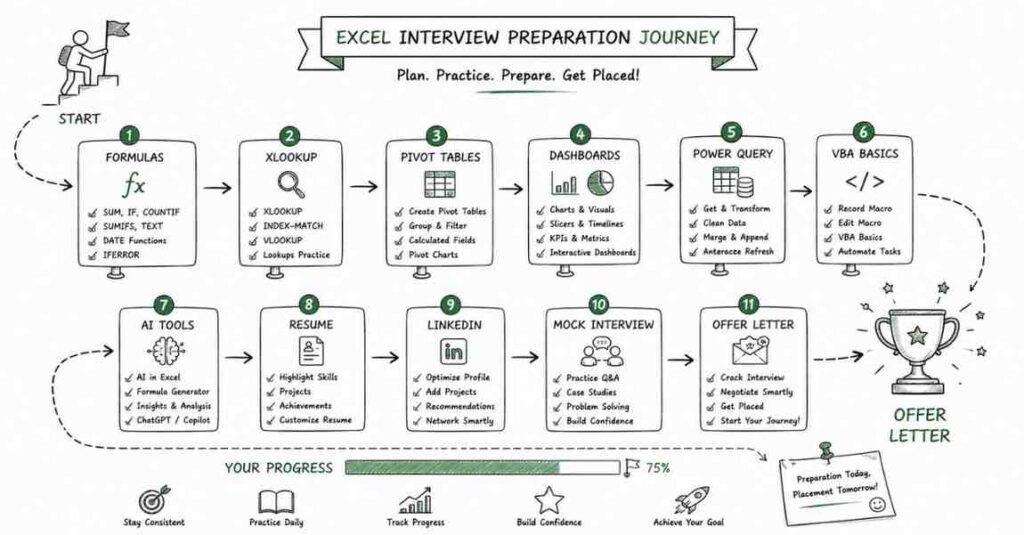
30-day study plan
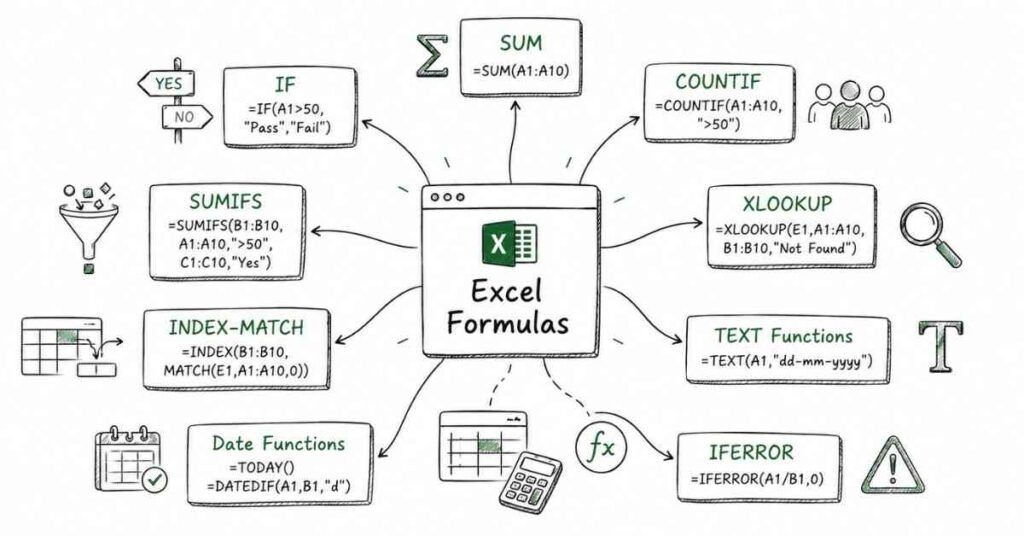
A practical 30-day Excel with AI study plan looks like this:
Week 1: Excel basics and worksheet fundamentals
Focus on workbook structure, worksheets, rows, columns, cells, formatting, references, sorting, filtering, and basic navigation. Learn how to work comfortably inside a spreadsheet.
Week 2: Formulas, functions, and logic
Study SUM, AVERAGE, COUNT, IF, nested IF, AND, OR, NOT, COUNTIF, SUMIF, and other core formulas. Practice understanding how formulas behave with different inputs.
Week 3: Lookup logic, data cleaning, and reporting
Move into VLOOKUP, HLOOKUP, XLOOKUP, INDEX-MATCH, text functions, date functions, pivot tables, and chart basics. Continue practicing data cleanup and validation.
Week 4: AI features, dashboards, and mock interviews
Focus on AI-assisted workflow ideas, dashboard preparation, scenario-based analysis, and full mock interviews. Spend the rest of the week on resume positioning, behavioral questions, and final review.
Daily study routine
A practical daily routine looks like this:
- 45 minutes of concept revision.
- 60 minutes of formula or report practice.
- 30 minutes of solving interview questions.
- 15 minutes of notes, error review, or AI-assisted practice.
If you are a fresher, do not skip speaking practice. Many candidates understand Excel privately but freeze when asked to explain a formula or reporting approach in real time.
Salary expectations in India
Excel salary expectations vary by role, industry, and the level of reporting responsibility. Fresher roles in MIS, operations, or support often start modestly, while stronger analyst, reporting, or finance roles can improve compensation significantly.
A practical approach is to treat salary numbers as directional context rather than guaranteed outcomes. In interviews, your accuracy, reporting skill, and speed often matter as much as the title itself.
How to prepare effectively
The best way to prepare for Excel interviews is to build from basic worksheet skills to formulas, then move into lookups, pivot tables, dashboards, and AI-assisted workflows. Start simple, then layer complexity gradually.
You should also practice explaining your logic out loud. In many interviews, the explanation matters almost as much as the final spreadsheet result.
Revision focus
Revise what Excel is, where it is used, the common Excel role types, the usual interview format, the key skill areas, and the 30-day study plan before moving to worksheet basics.
Part 2: Excel Fundamentals & Worksheet Basics — Questions 1–40
This part builds the foundation for the rest of the Excel with AI guide. It covers workbook structure, worksheets, cells, references, formatting, and the basic skills interviewers expect you to understand before moving into formulas and reporting.
1) What is Microsoft Excel?
Microsoft Excel is a spreadsheet application used to store, organize, calculate, and analyze data. It is one of the most widely used tools in business, finance, reporting, and data work.
2) Why is Excel important?
Excel is important because it helps professionals manage data quickly and efficiently. It is used for analysis, reporting, tracking, and decision-making in many roles.
3) What is a workbook in Excel?
A workbook is an Excel file that contains one or more worksheets. It is the main container for your data and analysis.
4) What is a worksheet?
A worksheet is a single spreadsheet inside a workbook. It is made up of rows, columns, and cells where data is entered and analyzed.
5) What is the difference between a workbook and a worksheet?
A workbook is the entire Excel file, while a worksheet is one tab inside that file. A workbook can contain many worksheets.
6) What is a cell in Excel?
A cell is the basic unit of a worksheet where a row and column intersect. It is where you enter data, formulas, or text.
7) What is a cell reference?
A cell reference is the address of a cell, such as A1 or B5. It helps formulas point to specific data.
8) What is a row?
A row is a horizontal line of cells in a worksheet. Rows are numbered 1, 2, 3, and so on.
9) What is a column?
A column is a vertical line of cells in a worksheet. Columns are labeled with letters such as A, B, C, and so on.
10) What is the difference between a row and a column?
A row runs horizontally, while a column runs vertically. Rows usually represent records, and columns usually represent attributes or fields.
11) What is the name box in Excel?
The name box shows the address of the selected cell or range. It can also be used to jump to a specific cell or named range.
12) What is the formula bar?
The formula bar displays the content or formula of the active cell. It helps you view and edit data more easily.
13) What is a range in Excel?
A range is a group of selected cells. For example, A1:A10 is a range of cells in one column.
14) What is a named range?
A named range is a custom name given to a cell or range of cells. It makes formulas easier to read and manage.
15) Why are named ranges useful?
They improve formula clarity and reduce errors. They are especially helpful in larger workbooks.
16) What is data in Excel?
Data is the information stored in cells. It can be numbers, text, dates, times, or formulas.
17) What is the difference between text and numeric data?
Text is treated as a label or string, while numeric data is used in calculations. Excel handles them differently in formulas and sorting.
18) What is formatting in Excel?
Formatting is the process of changing how data appears without changing the data itself. It includes font, color, borders, alignment, and number format.
19) Why is formatting important?
Formatting makes spreadsheets easier to read and understand. It also helps highlight important information.
20) What is conditional formatting?
Conditional formatting changes the appearance of cells based on rules or conditions. It is often used to highlight values, trends, or exceptions.
21) Why is conditional formatting useful?
It helps identify patterns, outliers, and important values quickly. It is widely used in reporting and dashboards.
22) What is autofill in Excel?
Autofill is a feature that copies data or extends patterns automatically when you drag a cell handle. It is useful for speed and consistency.
23) What is the fill handle?
The fill handle is the small square at the bottom-right corner of a selected cell. Dragging it lets you copy or extend data.
24) What is sort in Excel?
Sort arranges data in a specific order, such as ascending or descending. It helps organize and analyze data more efficiently.
25) What is filter in Excel?
Filter shows only the rows that match selected conditions. It hides the rest of the data temporarily.
26) What is the difference between sort and filter?
Sort rearranges the order of data, while filter displays only certain rows based on criteria. They are often used together.
27) What is freeze panes?
Freeze panes keeps selected rows or columns visible while scrolling. It is useful when working with large datasets.
28) Why is freeze panes useful?
It helps you keep headers visible while reviewing long sheets. This improves navigation and reduces mistakes.
29) What is a data table in Excel?
A data table is a structured set of rows and columns containing related information. It is the usual format for analysis and reporting.
30) What is a spreadsheet header?
A header is the top row that labels each column. It helps explain what each field represents.
31) Why are headers important?
Headers make data understandable and support formulas, sorting, and filtering. They are essential for clean spreadsheet design.
32) What is sheet navigation?
Sheet navigation means moving between worksheets in a workbook. It includes switching tabs and jumping between cells or ranges.
33) Why is organization important in Excel?
Because messy files are harder to use, audit, and update. Good organization improves speed and accuracy.
34) What is a clean Excel sheet?
A clean sheet has clear headers, organized data, proper formatting, and no unnecessary clutter. It is easier to read and analyze.
35) What is a common beginner mistake in Excel?
A common mistake is entering data without consistent structure or formatting. Another is mixing raw data and summary calculations in the same area without organization.
36) What is the difference between manual entry and formula-based output?
Manual entry means typing values directly, while formula-based output is calculated automatically. Formula-based output is usually more reliable for repeat work.
37) What is an Excel template?
A template is a pre-designed workbook structure that can be reused. It saves time and maintains consistency.
38) Why are templates useful?
They reduce repetitive setup work and help standardize reporting. They are common in MIS and business reporting roles.
39) What is a strong answer for Excel basics questions?
A strong answer explains the concept clearly and connects it to real workbook use. Interviewers like answers that show practical understanding, not just definitions.
40) What is the best way to practice Excel basics?
The best way is to build sample sheets, rename tabs clearly, format headers, sort and filter data, and practice moving around workbooks until the process feels natural.
Revision focus
Revise workbook versus worksheet, rows, columns, cells, ranges, formatting, conditional formatting, sorting, filtering, freeze panes, and sheet organization before moving to formulas and functions.
Part 3: Essential Formulas, Functions & Logical Thinking — Questions 41–80
This part covers the formulas and functions that appear most often in Excel interviews and daily reporting work. It focuses on calculations, logical thinking, and the ability to choose the right function for the right task
41) What is a formula in Excel?
A formula is an expression used to perform calculations or return results in a cell. It usually starts with an equals sign.
42) What is a function in Excel?
A function is a predefined formula built into Excel. It helps perform common tasks such as summing values, finding averages, or testing conditions.
43) What is the difference between a formula and a function?
A formula is written manually by the user, while a function is a built-in calculation tool. Functions can be combined inside formulas.
44) What does the equals sign mean in Excel?
The equals sign tells Excel that the cell contains a formula or calculation. Without it, Excel treats the input as plain text.
45) What is the SUM function?
SUM adds numbers in a selected range or list of cells. It is one of the most commonly used Excel functions.
46) What is the AVERAGE function?
AVERAGE calculates the arithmetic mean of a group of values. It is often used for reporting and performance analysis.
47) What is the COUNT function?
COUNT counts the number of numeric cells in a range. It ignores blank cells and text values.
48) What is the COUNTA function?
COUNTA counts all non-empty cells, including text, numbers, and formulas. It is useful when you want to count filled cells rather than just numbers.
49) What is the COUNTBLANK function?
COUNTBLANK counts the number of empty cells in a selected range. It is useful for checking missing data.
50) What is the MIN function?
MIN returns the smallest value in a range. It is often used to find the lowest score, price, or date.
51) What is the MAX function?
MAX returns the largest value in a range. It is useful for finding the highest value in a dataset.
52) What is the ROUND function?
ROUND changes a number to a specified number of decimal places. It is useful for cleaner reporting.
53) What is the IF function?
IF checks whether a condition is true or false and returns one result if true and another if false. It is one of the most important logical functions in Excel.
54) Why is IF useful?
It helps create decisions inside a spreadsheet. For example, it can label values as Pass or Fail, Yes or No, or Eligible or Not Eligible.
55) What is nested IF?
Nested IF means one IF function is placed inside another. It is used when multiple conditions must be checked.
56) What is the AND function?
AND returns TRUE only when all conditions are true. It is often used inside logical formulas.
57) What is the OR function?
OR returns TRUE when at least one condition is true. It is useful when any one of multiple conditions is acceptable.
58) What is the NOT function?
NOT reverses a logical result. It turns TRUE into FALSE and FALSE into TRUE.
59) What is the difference between AND and OR?
AND requires all conditions to be true, while OR requires only one condition to be true. This difference is important in decision-based formulas.
60) What is the IFERROR function?
IFERROR returns a custom result when a formula produces an error. It helps make spreadsheets cleaner and easier to read.
61) Why is IFERROR useful?
It prevents ugly error values from showing in reports. It is often used with lookups and calculations.
62) What is SUMIF?
SUMIF adds values that meet a single condition. It is useful for conditional totals.
63) What is COUNTIF?
COUNTIF counts cells that meet one condition. It is commonly used for tracking categories, statuses, or repeated values.
64) What is AVERAGEIF?
AVERAGEIF calculates the average for cells that meet a condition. It is useful when analyzing a specific subset of data.
65) What is SUMIFS?
SUMIFS adds values that meet multiple conditions. It is a stronger version of SUMIF for more complex logic.
66) What is COUNTIFS?
COUNTIFS counts cells that meet multiple conditions. It is widely used in reporting and MIS work.
67) What is AVERAGEIFS?
AVERAGEIFS calculates the average for values that meet multiple conditions. It is useful for segment-based analysis.
68) What is the difference between IF and IFS?
IF checks one condition at a time, while IFS allows multiple conditions in a cleaner structure. IFS is often easier to read when there are many outcomes.
69) What is a logical test?
A logical test is a condition that returns TRUE or FALSE. It is the basis of IF and many other decision functions.
70) What is a conditional formula?
A conditional formula returns different outputs based on a condition. IF, IFS, and IFERROR are common examples.
71) What is the importance of syntax in formulas?
Formula syntax must be correct for Excel to calculate properly. Even a small mistake can break the result.
72) What is operator precedence in Excel?
Operator precedence is the order in which Excel performs calculations. It determines which parts of a formula are processed first.
73) Why are brackets used in Excel formulas?
Brackets control calculation order. They ensure Excel evaluates the right part of the formula first.
74) What is a relative reference?
A relative reference changes when a formula is copied to another cell. For example, A1 becomes A2 if copied down one row.
75) Why is relative reference useful?
It helps formulas adjust automatically across rows or columns. It is the default behavior in Excel.
76) What is a strong answer for formula questions?
A strong answer explains what the formula does and when to use it. Interviewers like practical examples more than memorized definitions.
77) What is a common formula mistake?
A common mistake is using the wrong condition, range, or cell reference. Another is forgetting how formulas behave when copied.
78) What is a best practice for formula use?
Use clear structure, test formulas on small examples, and keep ranges consistent. This reduces errors in large files.
79) Why are formulas important in Excel interviews?
Because they show whether you can turn raw data into useful outputs. Interviewers often check if you can reason through calculation logic.
80) How should you practice Excel formulas?
Practice one formula at a time, then combine them in small business examples. Repetition helps you understand when each function is useful.
Revision focus
Revise SUM, AVERAGE, COUNT, COUNTA, COUNTBLANK, MIN, MAX, ROUND, IF, nested IF, AND, OR, NOT, IFERROR, SUMIF, COUNTIF, SUMIFS, COUNTIFS, and formula syntax before moving to lookup and reference skills.
Part 4: Lookup, Reference & Dynamic Formula Skills — Questions 81–120
Revise SUM, AVERAGE, COUNT, COUNTA, COUNTBLANK, MIN, MAX, ROUND, IF, nested IF, AND, OR, NOT, IFERROR, SUMIF, COUNTIF, SUMIFS, COUNTIFS, and formula syntax before moving to lookup and reference skills.
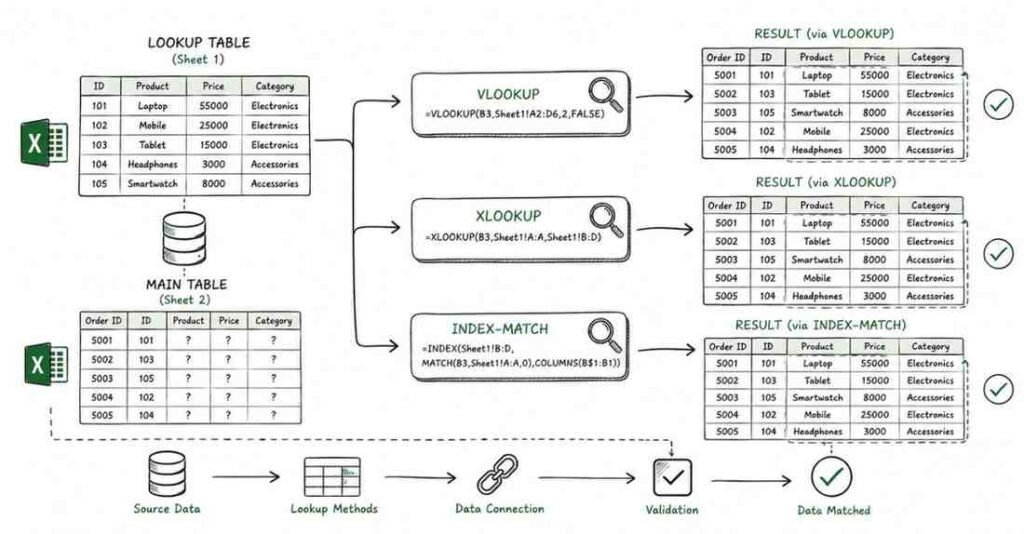
This part covers the Excel functions and reference logic that are frequently tested in interviews and used heavily in real reporting work. It focuses on finding data, connecting tables, and building formulas that stay flexible as workbooks change.
81) What is VLOOKUP?
VLOOKUP searches for a value in the first column of a range and returns a value from another column in the same row. It is one of the most common lookup functions in Excel.
82) Why is VLOOKUP important?
VLOOKUP is important because it helps match data across sheets or tables. It is widely used in reporting, reconciliation, and data matching tasks.
83) What is the syntax of VLOOKUP?
The basic syntax includes lookup value, table array, column index number, and match type. Each part controls how the lookup works.
84) What is the limitation of VLOOKUP?
VLOOKUP can only search from left to right. It also depends on the column position, which can make it less flexible.
85) What is HLOOKUP?
HLOOKUP searches for a value in the top row of a range and returns a value from a row below it. It is similar to VLOOKUP but works horizontally.
86) When is HLOOKUP used?
It is used when data is arranged across rows instead of columns. It is less common than VLOOKUP in everyday reporting.
87) What is XLOOKUP?
XLOOKUP is a newer and more flexible lookup function. It can search vertically or horizontally and does not have many of the limitations of VLOOKUP.
88) Why is XLOOKUP preferred over VLOOKUP?
Because it is more flexible, easier to read, and can search in any direction. It also handles missing matches more cleanly.
89) What is INDEX?
INDEX returns the value from a specific position in a range. It is often used in combination with MATCH.
90) What is MATCH?
MATCH returns the position of a lookup value within a range. It helps locate the row or column number needed for INDEX formulas.
91) What is the difference between INDEX and MATCH?
INDEX returns a value, while MATCH returns a position. Used together, they create a powerful lookup method.
92) Why is INDEX-MATCH useful?
It is more flexible than VLOOKUP and can look in either direction. It is often preferred in complex workbooks.
93) What is a lookup table?
A lookup table is a reference table used to match one value with another. It is commonly used for mapping IDs, categories, or codes.
94) What is an exact match?
An exact match returns a result only when the lookup value exactly matches the reference value. It is the safest option in most reporting tasks.
95) What is an approximate match?
An approximate match returns the nearest match based on sorted data. It is useful in specific cases such as tax slabs or grading systems.
96) What is a mixed reference?
A mixed reference fixes either the row or the column, but not both. For example, A$1 or $A1.
97) Why are mixed references useful?
They help when copying formulas across rows and columns while keeping part of the reference fixed. This is common in report templates and tables.
98) What is an absolute reference?
An absolute reference stays fixed when copied. It uses dollar signs, such as $A$1.
99) Why are absolute references important?
They are important when formulas must always point to the same cell or range. This is common in constants, tax rates, and control cells.
100) What is the difference between relative and absolute reference?
A relative reference changes when copied, while an absolute reference stays fixed. A mixed reference fixes only one direction.
101) What is the CONCATENATE function?
CONCATENATE joins text from multiple cells into one string. It is used to combine values like names, codes, or labels.
102) What is TEXTJOIN?
TEXTJOIN combines text from multiple cells with a separator and can ignore empty cells. It is more flexible than CONCATENATE.
103) What is the use of the ampersand symbol in Excel?
The ampersand symbol joins text values together in formulas. It is a simple way to combine data from multiple cells.
104) What is a structured reference?
A structured reference uses table names and column names instead of cell addresses. It is used in Excel tables and makes formulas easier to understand.
105) Why are structured references useful?
They make formulas more readable and easier to maintain when data changes. They are especially helpful in tables.
106) What is a dynamic formula?
A dynamic formula automatically adjusts when the source data changes. It helps make spreadsheets more flexible and reusable.
107) What is a spill formula?
A spill formula returns multiple results into adjacent cells automatically. It is used in newer versions of Excel.
108) Why are dynamic arrays useful?
They reduce manual formula copying and make calculations more efficient. They are part of modern Excel behavior.
109) What is FILTER in Excel?
FILTER returns rows that meet specific conditions from a dataset. It is a modern dynamic function.
110) What is SORT in Excel?
SORT arranges data dynamically based on a selected column or row. It updates automatically when the source changes.
111) What is UNIQUE in Excel?
UNIQUE returns distinct values from a range. It is useful for identifying categories, names, or codes without duplicates.
112) Why are dynamic functions useful in reporting?
They reduce manual maintenance and make reports more responsive to data changes. They are useful in dashboards and analysis sheets.
113) What is a common lookup mistake?
A common mistake is using the wrong match type or column reference. Another is not checking whether the data is sorted when using approximate match.
114) What is a common reference mistake?
A common mistake is forgetting to lock cells with absolute references when needed. This can break formulas when copied.
115) What is a strong answer for lookup questions?
A strong answer explains what problem the lookup solves and why the chosen function fits. Interviewers want to see flexible thinking, not just syntax knowledge.
116) Why are lookup functions important in interviews?
Because they show whether you can connect data from different sources. This is a common task in reporting, analysis, and reconciliation.
117) How do reference types affect formulas?
They control what changes when a formula is copied. Understanding references is essential for building reusable spreadsheets.
118) What is a common best practice for lookups?
Use clear lookup tables, test with known values, and check for errors or missing matches. Clean structure makes formulas more reliable.
119) Why should you know newer Excel functions?
Because modern Excel roles often expect more efficient and flexible formulas. Functions like XLOOKUP, FILTER, SORT, and UNIQUE improve productivity.
120) How should you practice lookup and reference skills?
Practice matching data across two sheets, locking references, and rewriting old formulas in simpler ways. Repetition helps you understand when each function is best.
Revision focus
Revise VLOOKUP, HLOOKUP, XLOOKUP, INDEX, MATCH, absolute and relative references, mixed references, CONCATENATE, TEXTJOIN, structured references, FILTER, SORT, and UNIQUE before moving to data cleaning and validation.
Part 5: Data Cleaning, Validation & Text/Date Handling — Questions 121–160
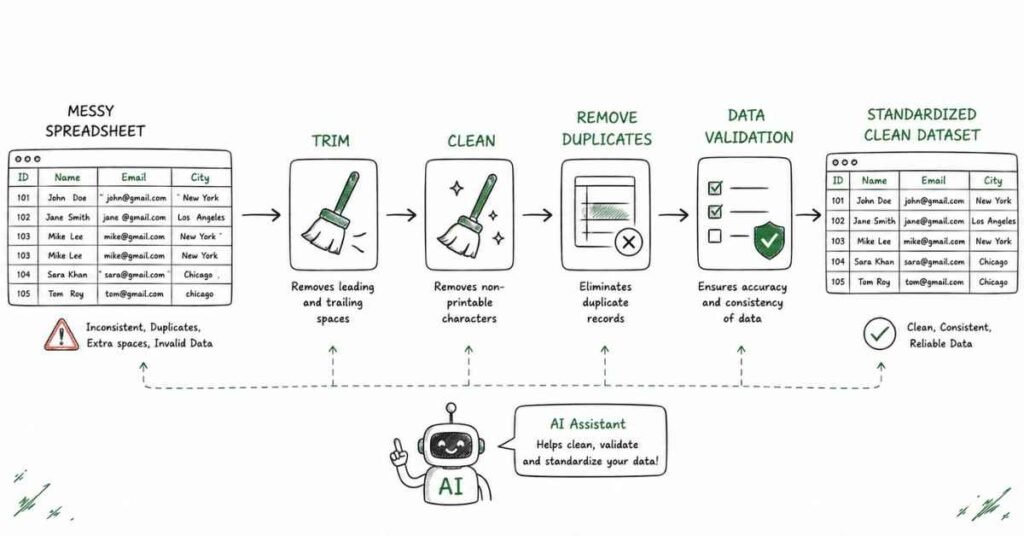
This part covers the Excel skills that are crucial when working with messy real-world data. It focuses on cleaning text, handling dates, validating inputs, and making spreadsheets more reliable for reporting and analysis.
121) What is data cleaning in Excel?
Data cleaning is the process of fixing, standardizing, and preparing messy data for analysis. It helps make the dataset accurate and usable.
122) Why is data cleaning important?
Because raw data often contains errors, duplicates, blanks, extra spaces, or inconsistent formats. Clean data leads to better formulas, reports, and decisions.
123) What is TRIM?
TRIM removes extra spaces from text except for single spaces between words. It is commonly used to clean imported data.
124) Why is TRIM useful?
Because extra spaces can cause lookup errors and inconsistent results. TRIM helps standardize text values.
125) What is CLEAN?
CLEAN removes non-printing characters from text. It is useful when data is copied from other systems.
126) Why is CLEAN useful?
It helps remove hidden characters that may break formulas or comparisons. It is often used with TRIM.
127) What is SUBSTITUTE?
SUBSTITUTE replaces specific text within a string with new text. It is useful for changing unwanted characters or words.
128) What is REPLACE?
REPLACE changes part of a text string based on position. It is useful when the exact text location is known.
129) What is LEFT?
LEFT returns characters from the beginning of a text string. It is commonly used to extract prefixes or codes.
130) What is RIGHT?
RIGHT returns characters from the end of a text string. It is useful for extracting suffixes or ending digits.
131) What is MID?
MID returns characters from the middle of a text string. It is useful when the required data is in the center of the text.
132) What is LEN?
LEN counts the number of characters in a text string. It is helpful for checking data length.
133) Why are text functions important?
Because many business datasets contain names, codes, IDs, or descriptions. Text functions help clean and reshape this information.
134) What is UPPER?
UPPER converts text to all capital letters. It is useful for standardizing text formats.
135) What is LOWER?
LOWER converts text to all lowercase letters. It is useful for normalization.
136) What is PROPER?
PROPER capitalizes the first letter of each word. It is often used for names or titles.
137) What is a date in Excel?
A date is stored as a serial number in Excel, even though it appears as a calendar date. This allows Excel to calculate with dates.
138) Why is date handling important?
Because many reports depend on deadlines, periods, aging, and time-based analysis. Date errors can affect the whole report.
139) What is TODAY?
TODAY returns the current date. It updates automatically whenever the sheet recalculates.
140) What is NOW?
NOW returns the current date and time. It is useful when both date and time matter.
141) What is DAY?
DAY returns the day number from a date. It is useful for extracting date parts.
142) What is MONTH?
MONTH returns the month number from a date. It is commonly used in date analysis.
143) What is YEAR?
YEAR returns the year from a date. It is useful for trend and period analysis.
144) What is DATEDIF?
DATEDIF calculates the difference between two dates. It is often used for age or tenure calculations.
145) What is EOMONTH?
EOMONTH returns the last date of a month based on a given date. It is useful for month-end reporting.
146) What is DATE?
DATE creates a valid Excel date from year, month, and day values. It is useful when dates are split into separate fields.
147) What is data validation?
Data validation restricts what can be entered into a cell. It helps maintain clean and accurate data.
148) Why is data validation useful?
Because it prevents invalid values from being entered in the first place. It improves data quality and reduces correction work.
149) What is a drop-down list in Excel?
A drop-down list is a validation feature that lets users choose from predefined options. It reduces typing errors and ensures consistency.
150) Why are drop-downs useful?
They standardize entries and make data entry easier. They are common in forms and trackers.
151) What is error checking in Excel?
Error checking helps identify problems in formulas or data. It can reveal issues like invalid references or inconsistent logic.
152) What are common Excel errors?
Common errors include #DIV/0!, #N/A, #VALUE!, #REF!, and #NAME?. Each one points to a different type of problem.
153) What does #DIV/0! mean?
It means a formula is trying to divide by zero or an empty cell. This is a common calculation error.
154) What does #N/A mean?
It means a value was not found. It often appears in lookup formulas.
155) What does #VALUE! mean?
It means there is a problem with the type of value being used in a formula. For example, text may be used where a number is expected.
156) What is data consistency?
Data consistency means using the same format, spelling, and structure across the dataset. It is essential for clean analysis.
157) Why is consistency important in Excel?
Because inconsistent text or date formats can break formulas, summaries, and lookups. Consistency makes the workbook more reliable.
158) What is a common cleaning mistake?
A common mistake is skipping text cleanup before doing lookups or analysis. Another is mixing formats in the same column.
159) What is a strong answer for cleaning and validation questions?
A strong answer explains how you identify messy data, clean it systematically, and validate the final result. Interviewers like practical data hygiene thinking.
160) How should you practice data cleaning skills?
Practice with raw datasets containing extra spaces, mixed dates, duplicate values, and inconsistent text. Cleaning real-looking data helps you build confidence.
Revision focus
Revise TRIM, CLEAN, SUBSTITUTE, REPLACE, LEFT, RIGHT, MID, LEN, UPPER, LOWER, PROPER, date functions, data validation, drop-down lists, common error types, and data consistency before moving to pivot tables, charts, and dashboard basics.
Part 6: Pivot Tables, Charts, MIS Reporting & Dashboard Basics — Questions 161–200
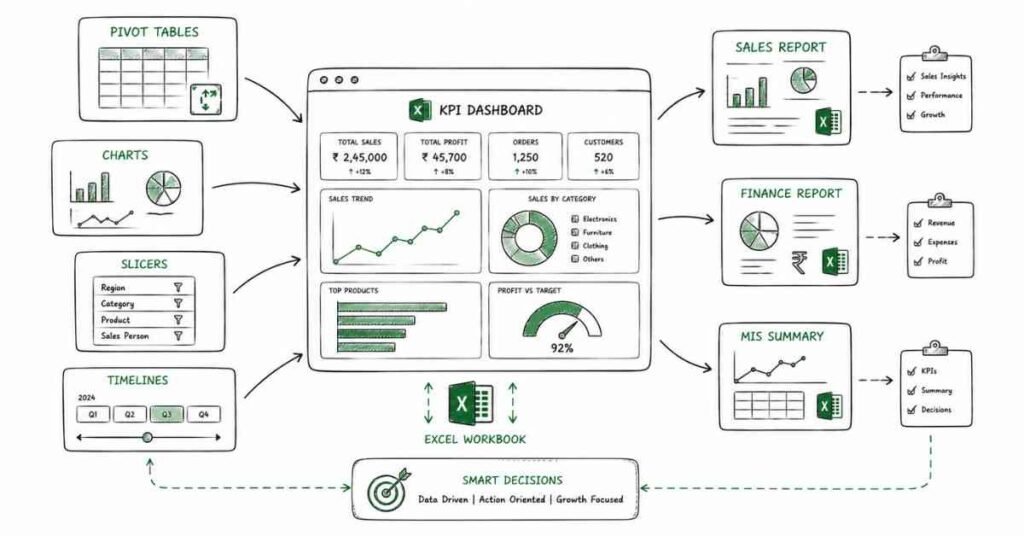
This part covers the reporting skills that make Excel useful in business environments. It focuses on summarizing data, creating charts, building dashboards, and presenting information in a way that managers and stakeholders can understand quickly.
161) What is a Pivot Table?
A Pivot Table is an Excel tool used to summarize and analyze large datasets quickly. It helps rearrange data into meaningful reports without changing the original source data.
162) Why are Pivot Tables important?
Because they make analysis faster and easier. They are one of the most common tools used in MIS reporting and data summaries.
163) What can Pivot Tables be used for?
They can be used for totals, counts, averages, grouping, comparison, and trend analysis. They are useful for business reporting and quick summaries.
164) What are Rows and Columns in a Pivot Table?
Rows and Columns define how the data is arranged in the Pivot Table. They help organize categories and subcategories for analysis.
165) What is the Values area in a Pivot Table?
The Values area contains the metric being measured, such as sum, count, or average. It is the main output of the Pivot Table.
166) What is the Filters area in a Pivot Table?
The Filters area lets you limit the data shown in the Pivot Table. It is useful for focusing on a specific segment or period.
167) What is a Pivot Chart?
A Pivot Chart is a chart connected to a Pivot Table. It visualizes summarized data dynamically.
168) Why are Pivot Charts useful?
They make trends and comparisons easier to understand visually. They are often used in reporting dashboards.
169) What is a chart in Excel?
A chart is a visual representation of data. It helps make numerical information easier to interpret.
170) Why are charts important?
Because visuals are faster to understand than raw numbers. Charts improve communication in reports and presentations.
171) What is a column chart?
A column chart uses vertical bars to compare values. It is commonly used for category comparison.
172) What is a bar chart?
A bar chart uses horizontal bars to compare values. It is useful when labels are long or space is limited.
173) What is a line chart?
A line chart shows trends over time or ordered data. It is often used in performance tracking.
174) What is a pie chart?
A pie chart shows proportions of a whole. It is best used when there are few categories and clear part-to-whole relationships.
175) What is a dashboard in Excel?
A dashboard is a summary view that combines key charts, metrics, and indicators on one screen. It gives a quick business overview.
176) Why are dashboards useful?
Because they present important information in a compact and visual way. Managers often rely on dashboards for quick decisions.
177) What is an MIS report?
An MIS report is a management information report used to summarize business data. It often includes performance numbers, trends, and operational updates.
178) Why are MIS reports important?
Because they support business monitoring and decision-making. They are common in operations, sales, HR, and finance functions.
179) What is KPI in reporting?
KPI stands for Key Performance Indicator. It is a measurable value that shows how well a process or team is performing.
180) Why are KPIs important?
Because they help track progress against goals. Dashboards often focus on KPIs.
181) What is slicer in Excel?
A slicer is a visual filter tool used with Pivot Tables and Pivot Charts. It makes filtering easier and more user-friendly.
182) Why are slicers useful?
They improve dashboard interaction and reduce the need for manual filtering. They are often used in reporting files.
183) What is a timeline in Excel?
A timeline is a filtering tool for date fields in Pivot Tables. It helps users filter by period quickly.
184) Why are timelines useful?
They make time-based reporting more interactive. They are especially useful for monthly or quarterly analysis.
185) What is a summary report?
A summary report presents key data in a condensed format. It focuses on the most important metrics instead of raw detail.
186) What is trend analysis in Excel?
Trend analysis is the study of data patterns over time. It helps identify growth, decline, or seasonal behavior.
187) Why is trend analysis important?
Because it helps businesses understand direction and performance. It is one of the most common analysis tasks in Excel.
188) What is comparative analysis?
Comparative analysis compares values across categories, periods, or groups. It is commonly used in sales, finance, and operations reporting.
189) What is a KPI card?
A KPI card is a visual block that highlights one important metric. It is often used in dashboards for quick visibility.
190) What is a common reporting mistake?
A common mistake is overloading a report with too much data. Another is using visuals that are hard to read or poorly labeled.
191) What makes a good dashboard?
A good dashboard is clear, clean, relevant, and easy to update. It focuses on the most important metrics and uses visuals wisely.
192) What is a common chart mistake?
A common mistake is using the wrong chart type for the data. Another is creating charts with too many categories or cluttered labels.
193) How should charts be labeled?
Charts should have clear titles, axis labels, and legends when needed. Good labeling makes the chart easier to interpret.
194) Why is color important in dashboards?
Color helps highlight trends, comparisons, and exceptions. It should be used carefully to improve clarity, not create noise.
195) What is MIS automation in Excel?
MIS automation means reducing manual reporting work by using formulas, pivot tables, templates, or reusable structures. It improves speed and accuracy.
196) Why is automation useful in reporting?
Because many reports are repeated daily, weekly, or monthly. Automation saves time and reduces errors.
197) What is a strong answer for Pivot Table questions?
A strong answer explains how the Pivot Table summarizes data, what fields go where, and how it helps in reporting. Interviewers like practical examples of business usage.
198) What is a strong answer for dashboard questions?
A strong answer explains the goal of the dashboard, the metrics included, and how the visuals help decision-making. Clarity and business relevance matter most.
199) Why are Pivot Tables and dashboards important in interviews?
Because they show whether you can turn raw data into useful business summaries. These skills are highly relevant in MIS and analyst roles.
200) How should you practice reporting skills in Excel?
Practice building summaries from raw data, then turn them into pivot tables, charts, and simple dashboards. Focus on clarity, usefulness, and presentation.
Revision focus
Revise Pivot Tables, Pivot Charts, rows and columns areas, filters, slicers, timelines, chart types, dashboards, MIS reports, KPI cards, trend analysis, and reporting best practices before moving to advanced Excel tools, automation, and AI features.
Part 7: Advanced Excel Tools, Automation & AI Features — Questions 201–240
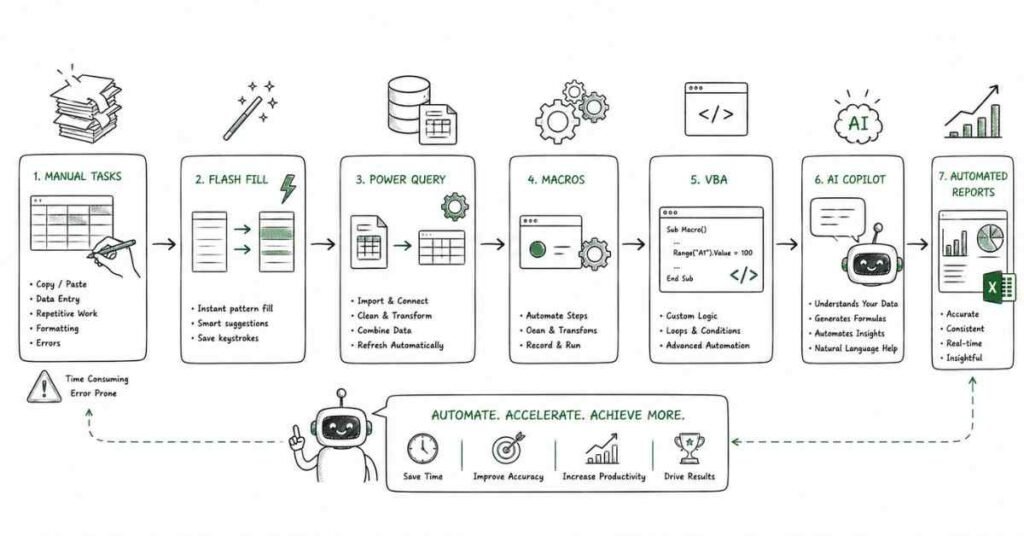
This part covers the advanced Excel features and AI-assisted workflows that are increasingly relevant in modern interview conversations. It focuses on automation, productivity, smarter analysis, and how AI can help you work faster without replacing Excel fundamentals.
201) What are advanced Excel tools?
Advanced Excel tools are features that help manage, analyze, or automate data more efficiently. Examples include Power Query, Power Pivot, macros, data validation, Pivot Tables, and dynamic functions.
202) What is Power Query?
Power Query is a data preparation tool in Excel used to import, clean, transform, and combine data. It is commonly used when working with large or messy datasets.
203) Why is Power Query useful?
Because it automates repetitive cleaning and transformation tasks. It helps reduce manual work in reporting.
204) What is Power Pivot?
Power Pivot is a data modeling tool in Excel used to build relationships and perform advanced analysis across tables. It is useful for larger and more complex datasets.
205) What is a macro in Excel?
A macro is a recorded or programmed sequence of actions that can be run automatically. It helps automate repeated tasks.
206) Why are macros useful?
They save time and reduce manual effort for repetitive work. They are especially helpful in reporting workflows.
207) What is VBA?
VBA stands for Visual Basic for Applications. It is the programming language used to create more advanced Excel automation.
208) Why is VBA used?
Because it allows custom automation beyond normal formulas and features. It is often used for specialized Excel tasks.
209) What is the difference between a macro and VBA?
A macro can be a recorded action or scripted process, while VBA is the underlying language used to build more advanced automation. Macros are often simpler to use, while VBA offers more control.
210) What is Flash Fill?
Flash Fill automatically fills values based on a detected pattern. It is useful for splitting, combining, or formatting text.
211) Why is Flash Fill useful?
It can save time when cleaning or reshaping text data. It is especially helpful for quick transformations.
212) What is What-If Analysis?
What-If Analysis is a set of tools used to test different scenarios in Excel. It helps users understand how changing values affects outcomes.
213) What is Goal Seek?
Goal Seek finds the input value needed to achieve a desired output. It is often used in financial or planning analysis.
214) What is Scenario Manager?
Scenario Manager lets you save and compare different sets of input values. It is useful for comparing business cases.
215) Why are What-If tools useful?
They support planning and decision-making. They help users explore possibilities before making choices.
216) What is Solver?
Solver is an optimization tool in Excel used to find the best possible result under given constraints. It is useful for resource and planning problems.
217) Why is Solver useful?
It helps solve problems where you need to maximize, minimize, or optimize a result. It is more advanced than normal formulas.
218) What is an add-in in Excel?
An add-in is an extra tool or extension that adds more features to Excel. Add-ins expand functionality.
219) Why are add-ins useful?
They allow users to extend Excel’s capabilities for specific business needs. They are often used in specialized workflows.
220) What is automation in Excel?
Automation means reducing manual work by using formulas, tools, macros, or scripts. It helps complete repetitive tasks faster.
221) Why is automation important in reporting?
Because many business reports repeat the same steps every day or month. Automation improves speed and consistency.
222) What is AI in Excel?
AI in Excel refers to intelligent features or tools that help analyze data, suggest insights, or speed up tasks. It may include formula help, natural-language analysis, or Copilot-style features.
223) How can AI help in Excel?
AI can help generate formulas, summarize data, detect patterns, and explain spreadsheet logic. It can also help users work faster.
224) Why is AI important for modern Excel users?
Because workplace productivity is increasingly expected to be faster and smarter. AI can reduce repetitive effort and support analysis.
225) Can AI replace Excel knowledge?
No. AI can assist, but you still need to understand Excel fundamentals to use it correctly. Good judgment remains important.
226) How should AI be used in Excel work?
It should be used as a support tool for ideas, formulas, summaries, and productivity. The final check should still come from the user.
227) What is a prompt in AI-assisted Excel work?
A prompt is the instruction or question given to the AI tool. Better prompts usually lead to better results.
228) Why is prompt quality important?
Because clear prompts help AI give more accurate and useful suggestions. Vague prompts often produce weak answers.
229) What is a good AI use case in Excel interviews?
A good use case is explaining how AI can help clean data, create formula ideas, summarize sheets, or speed up repetitive reporting. The key is to show practical value.
230) What is a bad AI use case in Excel interviews?
A bad use case is depending on AI without understanding the result. Interviewers want to see that AI supports your skill, not replaces it.
231) What is data transformation?
Data transformation means changing data into a better format for analysis. It may include splitting, merging, cleaning, or reshaping fields.
232) Why is transformation important?
Because raw data often needs preparation before reporting. Clean transformation makes analysis easier and more accurate.
233) What is repetitive task automation?
It is the use of Excel features to handle repeated actions automatically. Examples include templates, formulas, Power Query, and macros.
234) Why do managers value automation?
Because it saves time and lowers error rates. It also makes reports more consistent.
235) What is a common advanced Excel mistake?
A common mistake is using advanced tools without understanding the result. Another is automating the wrong process before cleaning the logic.
236) What is a strong answer for advanced Excel questions?
A strong answer explains the tool, the problem it solves, and the benefit it provides. That shows both technical understanding and business awareness.
237) Why are advanced tools important in interviews?
Because they show whether you can work efficiently with real business data. They also show readiness for more demanding reporting roles.
238) How should you practice advanced Excel tools?
Practice importing data, cleaning it with Power Query, automating repetitive tasks, and testing scenario tools. Try to connect each feature to a real business use case.
239) Why should you learn AI features alongside Excel?
Because modern reporting roles increasingly expect faster analysis and smarter workflow support. AI tools can help you become more productive.
240) What should you remember about AI and Excel?
AI is most useful when combined with strong Excel fundamentals. The best candidates know both the tool and the reasoning behind the result.
Revision focus
Revise Power Query, Power Pivot, macros, VBA, Flash Fill, What-If Analysis, Goal Seek, Scenario Manager, Solver, automation, prompt quality, and practical AI use cases before moving to scenario-based analysis and interview practice.
Part 8: Scenario-Based Analysis, Problem Solving & Interview Practice — Questions 241–280
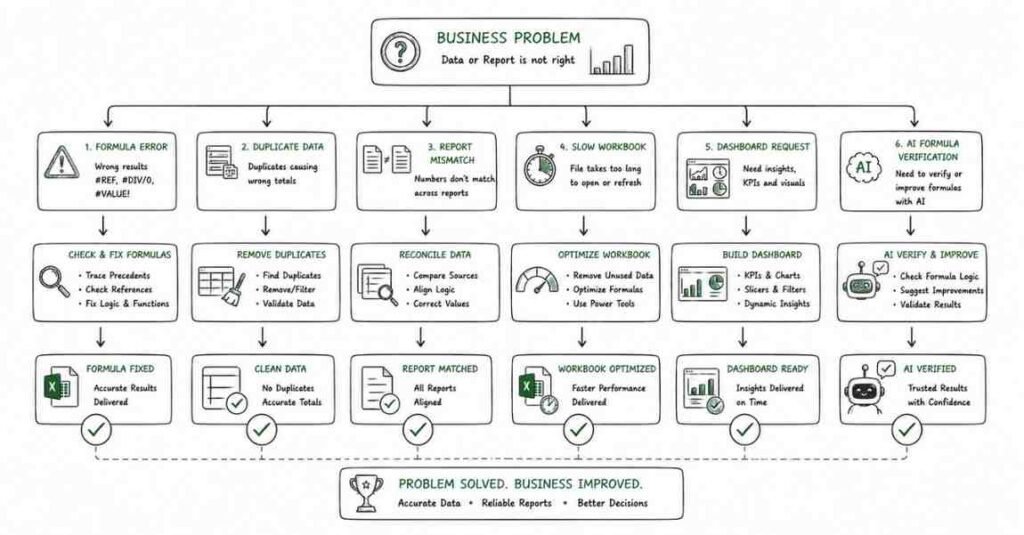
This part focuses on how you apply Excel skills in real situations. Interviewers often test whether you can think logically, solve data problems, and choose the right Excel feature for the task instead of just naming formulas.
241) What is scenario-based Excel questioning?
Scenario-based questioning means the interviewer gives a real work situation and asks how you would solve it in Excel. It tests practical thinking more than memorization.
242) Why are scenario-based questions important?
Because most Excel jobs are about solving business problems, not reciting formulas. These questions show how you think under real conditions.
243) What would you do if a report had duplicate values?
First identify the source of the duplicates, then decide whether to remove, flag, or consolidate them. You may use Conditional Formatting, Remove Duplicates, or formulas depending on the need.
244) What would you do if a formula returned an error?
Check the formula syntax, cell references, data type, and source values. Then fix the root cause before applying any error-handling formula.
245) What would you do if a lookup formula failed?
Check whether the lookup value exists, whether the data types match, and whether the reference range is correct. Also confirm whether you are using the right lookup type.
246) What would you do if a report needed monthly summary data?
Use Pivot Tables, SUMIF/SUMIFS, or grouped formulas depending on the structure. The goal is to summarize the source data clearly.
247) What would you do if data had inconsistent date formats?
Standardize the dates using date functions or text cleaning methods. Then verify that Excel recognizes them as actual dates.
248) What would you do if a workbook was too slow?
Reduce unnecessary formulas, limit heavy formatting, review volatile functions, and simplify the workbook structure. Large files often need cleanup and better design.
249) What would you do if two reports did not match?
Compare filters, date ranges, formulas, and source tables carefully. Mismatch issues often come from logic differences rather than data mistakes.
250) What would you do if a manager asked for a quick dashboard?
Identify the key metrics first, then use Pivot Tables, charts, and clear layout to build a concise summary. Focus on the most important business numbers.
251) What would you do if data had blanks in important columns?
Decide whether blanks should be filled, removed, or flagged. Use filters, conditional formatting, or formulas to handle them properly.
252) What would you do if a sheet had text mixed with numbers?
Check whether the data needs to be converted to one format. Text functions, data validation, or cleaning steps may be needed.
253) What would you do if a report needed to be updated daily?
Create a reusable structure with formulas, templates, or automation so the process is faster and more consistent. Repetition should be reduced wherever possible.
254) What would you do if the source data kept changing?
Use flexible formulas, dynamic functions, or structured tables so the workbook adapts better. Hardcoding should be avoided when possible.
255) What would you do if a chart looked confusing?
Review the chart type, labels, scale, and number of categories. Then simplify the visual so it communicates the message better.
256) What would you do if an AI tool suggested a formula you did not understand?
Test the formula on a small example, break it into parts, and verify the logic manually. Never use AI output blindly.
257) What would you do if a report needed better accuracy?
Validate formulas, cross-check totals, and compare the report with source data. Accuracy must come before presentation.
258) What would you do if you were asked to explain a workbook to a non-technical person?
Use simple language, focus on the purpose of the report, and explain the key numbers and visuals. Avoid too much technical detail.
259) What would you do if a workbook had too many manual steps?
Look for repeated actions that can be replaced with formulas, tables, Power Query, or macros. The goal is to reduce manual work.
260) What would you do if you made a mistake in a report?
Own the mistake quickly, correct it, and explain the fix clearly. Good reporting work depends on honesty and speed.
261) How do you approach a new Excel task?
First understand the goal, then inspect the data, choose the right Excel tool, and test the result. A structured approach prevents errors.
262) How do you decide which Excel feature to use?
Choose based on the problem type: formulas for calculations, Pivot Tables for summaries, charts for visuals, and automation for repetitive work. The best feature depends on the task.
263) What is the best way to debug an Excel file?
Check one step at a time: data, formula, references, formatting, and output. Debugging becomes easier when you isolate the issue.
264) Why is checking assumptions important?
Because many Excel mistakes come from wrong assumptions about data, formulas, or source logic. Clarifying assumptions reduces errors.
265) What is a common scenario-based mistake?
A common mistake is jumping into a formula without understanding the business problem. Another is giving a technical answer without explaining the reasoning.
266) What is a strong answer for scenario questions?
A strong answer explains the situation, the Excel tool you would use, and why that tool fits the problem. Interviewers want a clear problem-solving approach.
267) Why do interviewers ask Excel scenario questions?
Because they want to see how you think under practical pressure. These questions show whether you can work independently and accurately.
268) How should you practice scenario questions?
Practice with sample business problems such as attendance, sales, targets, errors, mismatches, and monthly reports. Try explaining your process out loud.
269) What is an interview-style Excel task?
It is a practical problem where you must use Excel to clean, analyze, or summarize data. These tasks are common in analyst and MIS interviews.
270) How should you handle a live Excel task in an interview?
Read the task carefully, organize the sheet, think step by step, and explain your approach clearly while working. Calm logic matters more than speed alone.
271) What is a case-study style Excel question?
It is a longer practical question based on a real business scenario. It often tests formulas, logic, and presentation together.
272) Why is logic important in Excel interviews?
Because Excel is not only about tools, it is about solving problems correctly. Good logic prevents wrong output even when the formula works syntactically.
273) How can you improve interview confidence?
Practice common formulas, redo sample reports, and explain your work without reading notes. Familiarity reduces pressure.
274) What is a common interview weakness in Excel candidates?
A common weakness is knowing formulas but not knowing when to use them. Another is weak explanation of the result.
275) What is a strong way to explain your answer?
Start with the problem, mention the Excel feature, describe the steps, and end with the expected result. That structure sounds clear and professional.
276) Why should you talk about validation in interviews?
Because interviewers value accuracy. Validation shows that you check your work instead of assuming it is correct.
277) What is a practical way to prepare for Excel interviews?
Practice short timed tasks, build sample reports, and solve common business scenarios. This creates real readiness, not just theoretical knowledge.
278) Why is speaking practice important in Excel interviews?
Because many candidates can work in Excel but struggle to explain their logic clearly. Strong communication improves interview performance.
279) What is a strong answer for “How do you solve Excel problems?”
A strong answer describes how you understand the task, inspect the data, choose the right tools, test the result, and validate accuracy. That shows structure and confidence.
280) What is the biggest lesson from scenario-based Excel practice?
The biggest lesson is to combine logic, Excel skill, and clear communication. Interview success depends on all three, not just formulas.
Revision focus
Revise duplicate handling, formula debugging, lookup failures, monthly reporting, dashboard requests, workbook performance, data mismatch handling, AI formula checking, and step-by-step problem-solving before moving to the final career strategy section.
Part 9: Behavioral, Resume, LinkedIn & Career Strategy — Advanced Excel with AI Interview Preparation Guide
This final part focuses on presenting yourself well for Excel and MIS-related roles, not just solving spreadsheet tasks. Strong candidates need to explain their work clearly, show reporting confidence, and present a resume and LinkedIn profile that reflect real Excel, analysis, and AI-assisted productivity skills.
STAR method
The STAR method means answering behavioral questions with:
- Situation.
- Task.
- Action.
- Result.
This works especially well for Excel interviews because many behavioral questions are really trying to understand how you handled reporting errors, data mismatches, urgent requests, repeated tasks, or time pressure.
Use this Excel-friendly STAR approach:
- Situation: A report issue, data problem, dashboard request, or repetitive workflow.
- Task: What you were responsible for.
- Action: What you analyzed, cleaned, summarized, automated, or verified.
- Result: What improved, what was fixed, or what you learned.
Example:
Situation: A weekly MIS report had mismatched totals across two sheets.
Task: The goal was to identify the source of mismatch before the report went to management.
Action: The formulas, filters, and source ranges were checked carefully, and the issue was traced to an outdated lookup table. The table was refreshed and the report logic was standardized.
Result: The totals matched correctly, the report was submitted on time, and the same issue did not repeat in later cycles.
20 behavioral questions
Below are 20 common behavioral questions with answer direction.
- Tell me about yourself.
Framework: background → Excel skills → role target. - Why do you want to work in an Excel or MIS role?
Framework: interest in data/reporting → problem-solving → long-term fit. - Tell me about a reporting problem you solved.
Framework: problem → diagnosis → fix → result. - Describe a time you handled a data mismatch.
Framework: mismatch → investigation → resolution. - Tell me about a time you worked under deadline pressure.
Framework: pressure → prioritization → communication → outcome. - Describe a time you improved a report or process.
Framework: old workflow → improvement → benefit. - Tell me about a time you used Excel formulas to solve a problem.
Framework: task → formula logic → result. - Describe a time you had to explain a report to a non-technical person.
Framework: complexity → simplification → understanding. - Tell me about a mistake you made in Excel.
Framework: mistake → ownership → correction → lesson. - Describe a time you handled unclear instructions.
Framework: ambiguity → clarification → execution. - Tell me about a repetitive task you automated or simplified.
Framework: repetitive issue → tool/process → benefit. - Describe a time you updated a daily or monthly report.
Framework: regular work → method → reliability. - Tell me about a time you learned a new Excel feature quickly.
Framework: skill gap → learning → application. - Describe a time you checked your work for accuracy.
Framework: validation → cross-checking → outcome. - Tell me about a time you worked across teams.
Framework: coordination → dependency → result. - Describe a time feedback changed your report or analysis.
Framework: feedback → adjustment → learning. - Why should we hire you for this Excel role?
Framework: Excel fundamentals + reporting skill + accuracy + reliability. - Where do you see yourself in 3 years?
Framework: deeper reporting ownership + stronger analysis + productivity impact. - How do you handle repetitive work?
Framework: structure → automation mindset → consistency. - How do you use AI responsibly in Excel work?
Framework: support tool → verification → practical use.
Keep answers specific and realistic. For freshers, academic work, internships, or practical projects are acceptable if explained honestly.
50 AI self-preparation prompts
Use these prompts with an AI assistant or for self-practice.
- Ask me Excel behavioral questions one by one.
- Evaluate my “Tell me about yourself” answer for an Excel role.
- Rewrite my introduction for an MIS executive role.
- Rewrite my introduction for a data analyst role.
- Conduct a mock HR interview for an Excel role.
- Conduct a mock technical interview for Excel basics.
- Ask me Excel formula questions one by one.
- Ask me lookup function questions.
- Ask me Pivot Table interview questions.
- Ask me dashboard interview questions.
- Ask me data cleaning interview questions.
- Ask me Excel error-handling questions.
- Ask me AI-assisted Excel workflow questions.
- Ask me reporting and MIS questions.
- Turn my Excel project into a STAR answer.
- Improve my Excel resume bullet points.
- Convert my reporting work into stronger resume language.
- Create a 30-second Excel elevator pitch.
- Create a 60-second reporting-role elevator pitch.
- Ask follow-up questions after every answer I give.
- Score my answers for clarity and confidence.
- Find weak spots in my Excel interview preparation.
- Simulate a live Excel task interview.
- Simulate a formula-based interview round.
- Simulate a Pivot Table interview round.
- Simulate a dashboard design interview round.
- Simulate a reporting validation interview.
- Improve my LinkedIn headline for Excel roles.
- Improve my LinkedIn About section for reporting roles.
- Ask me why I chose Excel.
- Ask me why I want to move into reporting or analytics.
- Ask me why I am changing jobs.
- Ask me how I would explain a report mismatch.
- Ask me how I would explain an AI-assisted workflow.
- Help me explain a dashboard project clearly.
- Help me explain an MIS project clearly.
- Make my Excel interview answers sound more natural.
- Shorten my long answers into interview-ready versions.
- Help me answer “What is your weakness?” for an Excel role.
- Help me answer “Why this company?” for a reporting role.
- Create 20 likely HR questions for Excel freshers.
- Create 20 likely HR questions for MIS analysts.
- Cross-examine my resume like an interviewer.
- Check whether my project claims sound realistic.
- Turn my college project into an industry-style reporting project summary.
- Build a 7-day Excel mock interview plan.
- Create a thank-you email after an Excel interview.
- Create a recruiter outreach message for MIS or reporting roles.
- Create a no-response follow-up after 5 days.
- Create a final revision checklist from my weak Excel areas.
Resume optimization
ATS-focused resume guidance for Excel roles rewards exact skill names instead of vague statements like “good knowledge of Excel.” The resume should clearly show your reporting, analysis, and automation strengths, as well as any AI-assisted productivity exposure.
Use this structure:
- Name and contact details.
- Resume headline.
- 3–4 line summary.
- Technical skills.
- Experience or projects.
- Education.
- Certifications.
- Portfolio, sample workbook, or project links if relevant.
Useful keywords to include naturally:
- Microsoft Excel, Advanced Excel, Formulas, Functions, VLOOKUP, XLOOKUP, INDEX-MATCH, Pivot Tables, Charts, Dashboards, MIS Reporting, Data Cleaning, Data Validation, Power Query, Power Pivot, Macros, VBA, Conditional Formatting, Lookup Functions, What-If Analysis, Goal Seek, Solver, AI-assisted workflow, Reporting, KPI tracking, Data Analysis.
Current resume advice also emphasizes showing real usage context instead of just listing tools. That means explaining what you calculated, reported, cleaned, automated, or improved.
Better bullet style:
- Built daily and weekly MIS reports using Pivot Tables, formulas, and lookup functions for business tracking.
- Cleaned and standardized raw data using TRIM, text functions, validation, and formatting rules.
- Created summary dashboards with charts, KPI cards, and conditional formatting for management review.
- Used VLOOKUP, XLOOKUP, and INDEX-MATCH to connect records across sheets and reduce manual matching.
- Automated repetitive reporting tasks using templates, dynamic formulas, and structured workbook design.
- Validated report accuracy by cross-checking source data, formulas, and summary totals.
- Supported decision-making by turning raw data into clear and concise Excel reports.
- Used AI-assisted tools to speed up formula generation, analysis, and report preparation while verifying outputs manually.
Avoid these mistakes:
- Writing only “worked on Excel sheets.”
- Listing formulas without showing report usage.
- Claiming automation or AI use without examples.
- Including too many unrelated tools.
- Skipping validation, reporting, or business impact.
Resume summary example
For fresher:
“Entry-level Excel and MIS professional with strong foundations in Advanced Excel, formulas, lookup functions, Pivot Tables, charts, data cleaning, and reporting. Hands-on project experience in building summaries, dashboards, and structured reports using Excel tools and AI-assisted productivity methods. Seeking an opportunity to contribute to reporting, analysis, and operational support while growing in automation and data-driven decision-making.”
For experienced candidate:
“Excel and reporting professional with experience building MIS reports, dashboards, and analysis files using Advanced Excel, Pivot Tables, lookup functions, data validation, and automation techniques. Comfortable with recurring reporting workflows, data cleanup, validation, and AI-assisted productivity while maintaining accuracy and consistency. Interested in roles that combine reporting execution with business insight and process improvement.”
LinkedIn profile optimization
For Excel roles, your LinkedIn profile should quickly show your reporting identity, practical skills, and project depth. Recruiters usually scan your headline, About section, recent experience, and listed skills before deciding whether to contact you.
Use these upgrades:
- Headline: include role target plus skill keywords.
- About: 3 short paragraphs with background, tools, and role focus.
- Experience: use action-based, reporting-specific bullets.
- Featured: add workbook samples, dashboards, or project links if available.
- Skills: list formulas, reporting tools, and data handling concepts.
- URL: customize it.
- Open to Work: enable it if relevant.
Headline examples:
- General Excel: Advanced Excel Executive | Pivot Tables, XLOOKUP, Dashboards, MIS Reporting
- Fresher: Aspiring MIS Analyst | Advanced Excel, Data Cleaning, Lookup Functions, Dashboards
- Experienced: Excel Reporting Specialist | Advanced Excel, Power Query, Automation, KPI Dashboards
About section template:
“I work with Excel to organize, clean, analyze, and present data for reporting and decision-making. My core skills include Advanced Excel, formulas, lookup functions, Pivot Tables, charts, dashboards, data cleaning, and reporting workflows.
My projects and experience include building MIS reports, summary sheets, KPI dashboards, and recurring analysis files. I also use AI-assisted tools where appropriate to speed up formula support, data summaries, and repetitive work while still validating results manually.
I am currently targeting opportunities in MIS, reporting, operations, analytics, and Excel-focused roles where accuracy, structure, and productivity matter.”
Project and portfolio strategy
Projects are extremely important for Excel candidates because they give interviewers something concrete to discuss. A strong Excel project does not need to be huge, but it should show logic, reporting ability, and practical use.
Strong project categories:
- MIS reporting project.
- Sales tracker dashboard.
- Attendance or HR tracker.
- Expense analysis workbook.
- Inventory summary report.
- KPI dashboard.
- Reconciliation workbook.
- Data cleaning and validation project.
- Monthly performance report.
- AI-assisted Excel productivity demo.
For each project, prepare these six points:
- Problem statement.
- Data source or workbook structure.
- Excel tools used.
- Your contribution.
- Key challenges.
- Result and next step.
Example explanation:
“I built a monthly sales MIS report in Excel using formulas, Pivot Tables, and charts. I cleaned raw data, standardized dates and text fields, created summary metrics, and used lookup functions to connect different sheets. I also prepared a dashboard view for quick review by management, and I used AI support to speed up formula ideas while validating each result manually.”
Salary guidance in India
Excel salary data in India varies significantly by role, company type, and whether the position is focused on MIS, reporting, analytics, or operations. Fresher and early-career Excel-heavy roles often appear in support, reporting, operations, and coordination functions, while stronger analytics or automation skills can improve compensation over time.
A practical planning range is:
- Fresher: ₹2.5–4.5 LPA.
- 1–3 years: ₹4–7 LPA.
- 3–6 years: ₹6–12 LPA.
- Senior / specialized roles: ₹10–18+ LPA depending on reporting depth and business impact.
Use salary discussions carefully and base expectations on your actual reporting skill, accuracy, and productivity. In Excel roles, speed, reliability, and clear presentation often matter as much as the title.
Sample line:
“Based on my Excel, reporting, and data handling experience, and the current market range for similar roles in India, I am looking for a fair opportunity in the range of X to Y LPA, while also considering the role scope and growth path.”
Thank-you and follow-up emails
Thank-you email template
Subject: Thank you — Excel/MIS interview
Hello [Interviewer Name],
Thank you for taking the time to speak with me today regarding the Excel/MIS role. I enjoyed our discussion, especially the conversation around [Pivot Tables / dashboards / data cleaning / reporting / AI-assisted workflow].
The role aligns strongly with my background in Excel, reporting, and problem solving, and I would be excited about the opportunity to contribute.
Thank you again for your time and consideration.
Best regards,
[Your Name]
[Phone Number]
[Email]
Follow-up email after 4–7 days
Subject: Follow-up on Excel/MIS interview
Hello [Interviewer Name],
I hope you are doing well. I wanted to follow up on the interview process for the Excel/MIS position. I remain very interested in the role and wanted to check whether there are any updates regarding the next steps.
Thank you for your time and consideration.
Best regards,
[Your Name]
Final 30-day checklist
Week 1
- Revise Excel basics, workbook structure, formatting, sorting, and filtering.
- Practice speaking about workbook organization aloud.
- Finalize 2 reporting or dashboard project stories.
- Update resume summary and skills.
Week 2
- Revise formulas, functions, lookup logic, and references.
- Solve small formula problems daily.
- Strengthen one MIS or reporting project explanation.
- Update LinkedIn headline and About section.
Week 3
- Revise data cleaning, validation, Pivot Tables, charts, and dashboards.
- Practice report-building questions.
- Prepare answers around mismatches, errors, and formula logic.
- Practice explaining your workbook logic aloud.
Week 4
- Revise automation, AI features, scenario-based questions, and STAR answers.
- Do full mock interviews: HR, formulas, reporting, and scenario rounds.
- Review salary range and recruiter communication.
- Apply consistently and track responses.
Final 3 days
Review only your condensed notes and project summaries.
Practice concise spoken answers.
Keep resume, workbook samples, project links, and documents ready.
Focus on clarity, calmness, and consistency.
Revision focus
Revise behavioral answers, resume wording, LinkedIn positioning, project explanations, salary discussion, and follow-up email templates before your final interview rounds.