
How Much Statistics Does a Data Analyst Need?
Table of Contents
Statistics is important in data analytics, but beginners do not need to become statisticians before they can start analysing data. For most entry-level analytics work, the priority is understanding a practical set of concepts well enough to describe data, compare groups, recognise unusual patterns, and avoid misleading conclusions.
The most useful statistics for data analysts begins with mean, median, percentages, variance, standard deviation, distributions, and basic probability. Correlation, hypothesis testing, and regression become more valuable as the analysis becomes deeper.
For students who feel uncomfortable with mathematics, this distinction matters. The goal is not to memorise every statistical formula. It is to know which concept helps answer a particular data question.
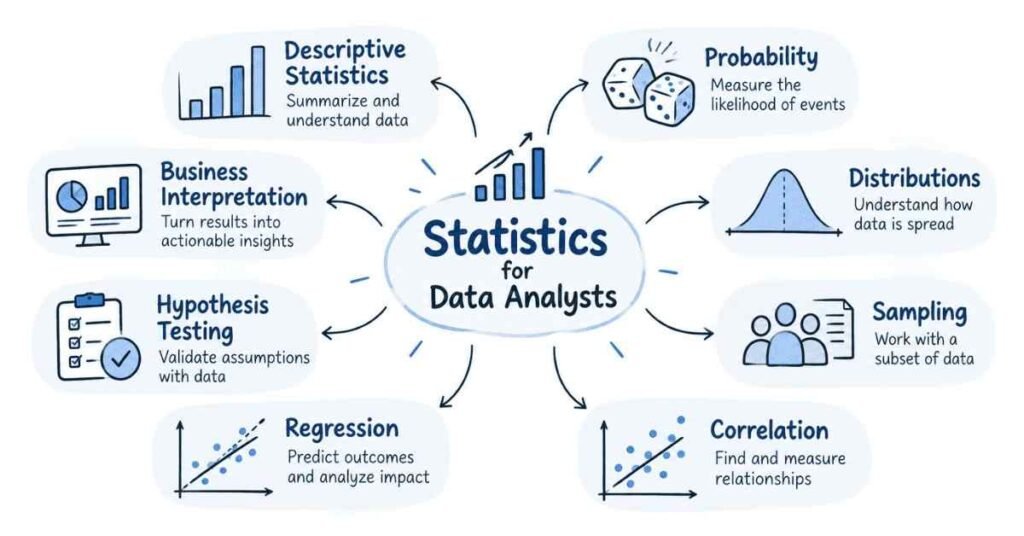
Quick Answer: How Much Statistics Is Enough for a Data Analyst?
A beginner should be comfortable with four areas:
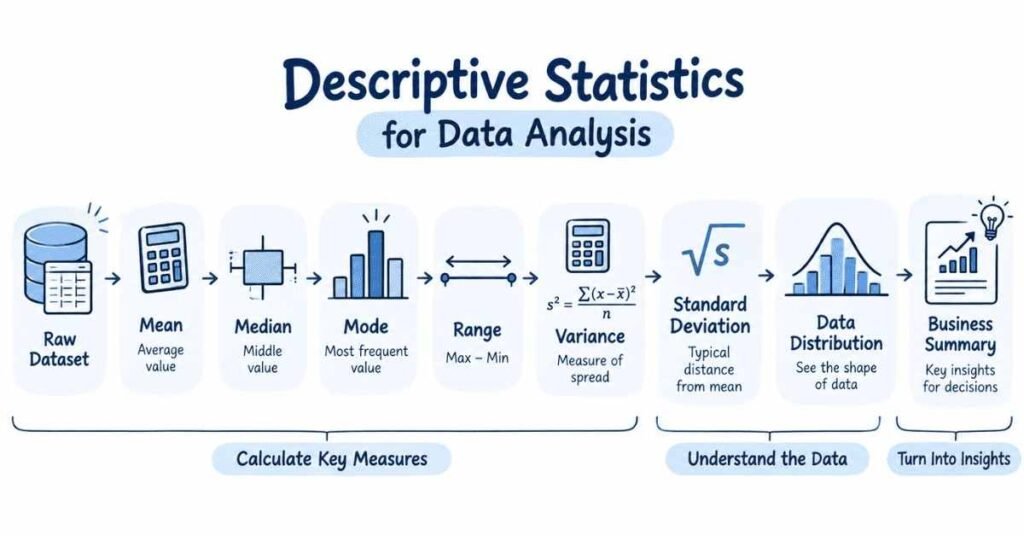
Describing data: mean, median, percentages, minimum, maximum and quartiles.
Understanding variation: range, variance and standard deviation.
Understanding uncertainty: basic probability, samples and distributions.
Studying relationships: correlation and basic regression, followed later by hypothesis testing where the work requires it.
NIST describes mean and median as common ways of representing the centre of a dataset and variance as one way of measuring how spread out the values are.
The important skill is knowing when those measures are useful.
Start Your Data Analytics Journey
Learn Excel, SQL, Power BI, Python & AI with practical projects.
👉 Join Now
Why Statistics Matters in Data Analytics
Analytics often begins with a simple business question, but raw numbers rarely provide a complete answer.
Suppose an online store reports an average order value of ₹2,500. That appears useful until you discover that a small number of very large orders are pulling the average upward.
A typical customer’s order may actually be much lower.
Statistics helps an analyst recognise these situations. Instead of reporting a single number without context, the analyst can compare the mean with the median, look at the spread of order values, inspect the distribution, and decide which measure gives a clearer description.
This is the practical purpose of statistics in data analytics: not making analysis more mathematical, but making conclusions more reliable.
Which Statistical Concepts Should Beginners Learn?
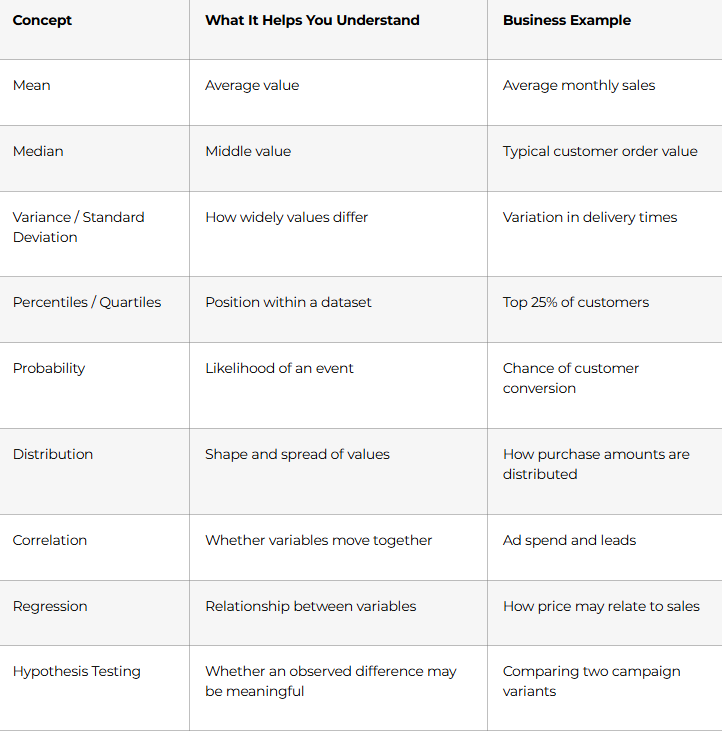
Beginners do not need equal depth in every topic. Descriptive statistics and variability should come first.
Mean and Median: Why Analysts Need Both
The mean is calculated by adding the values and dividing by the number of observations. The median is the middle value once the observations are ordered. NIST identifies both as common measures of location.
The difference becomes important when data contains extreme values.
Imagine five orders:
₹500, ₹600, ₹700, ₹800 and ₹10,000.
The large order changes the mean significantly, while the median remains ₹700.
This does not mean the median is always better. It means an analyst should examine the data before deciding which summary represents it appropriately. NIST specifically notes that the usefulness of a location measure can depend on the underlying distribution.
That judgement is one of the essential statistics skills for analysts.
Variance and Standard Deviation: Looking Beyond the Average
Two datasets can have the same average and still behave very differently.
Suppose two delivery teams both have an average delivery time of 30 minutes. One usually delivers between 28 and 32 minutes. The other ranges from 10 minutes to an hour.The averages are similar, but the consistency is not.Measures of spread help reveal this difference.
NIST defines variance as a measure related to the squared distance of observations from the mean and treats measures of scale as ways of describing variability within data.
For analysts, the practical lesson is straightforward: never assume the average tells the whole story.
Why Probability and Distributions Matter
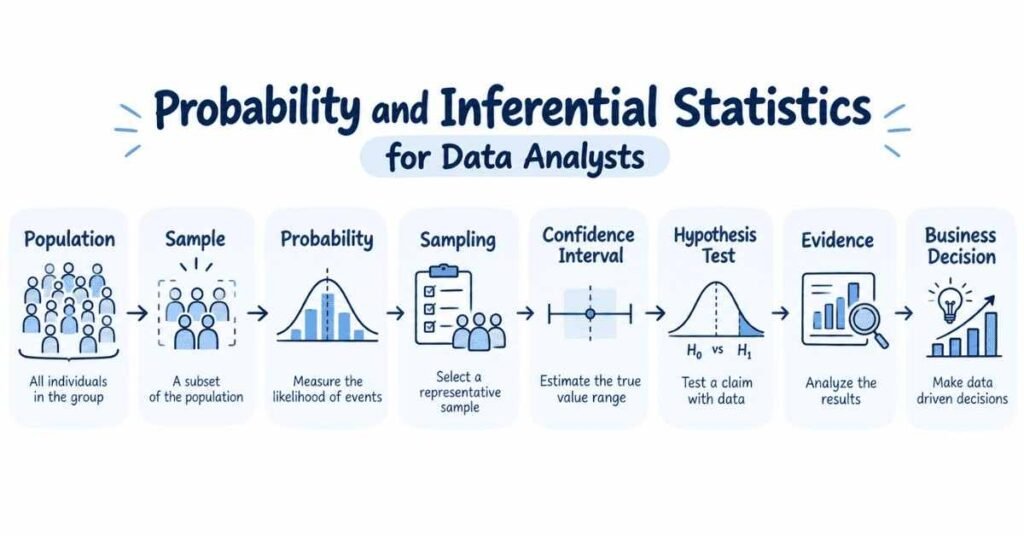
Probability becomes useful when analysis moves from describing what happened to reasoning about uncertainty.
An analyst may need to consider the likelihood of a conversion, a return, a late delivery, or another event.Distributions add context by showing how values are spread.
Order amounts, customer ages, response times, or transaction values may not all follow the same shape. Some datasets are relatively balanced, while others are heavily concentrated on one side or contain long tails and extreme values.
NIST describes probability distributions as a fundamental statistical concept and notes that distributional assumptions matter for techniques such as confidence intervals and hypothesis tests.
A beginner does not need to memorise dozens of probability distributions. Understanding why data shape matters is the more useful starting point.
Do Data Analysts Need Correlation, Regression and Hypothesis Testing?
They are useful, but they belong after the fundamentals.
Correlation helps describe how two variables move in relation to one another. An analyst might compare advertising spend and lead volume or product price and units sold.
However, correlation alone does not establish that one variable caused the other. Business context and further analysis are necessary.
Regression goes further by modelling relationships between variables and can support estimation or prediction.
Hypothesis testing is useful when an analyst needs to evaluate whether an observed difference is consistent with more than random variation—for example, when comparing two versions of a campaign or product experience.
These concepts are also part of FLM’s current statistics module, alongside descriptive statistics, probability distributions, and covariance.
A Practical Example: Analysing E-Commerce Orders
Consider an analyst reviewing an e-commerce dataset.
The first report shows an average order value of ₹1,800.
Instead of stopping there, the analyst checks the median and finds it is ₹950. This suggests that higher-value purchases may be lifting the average.
The analyst then looks at variation across product categories. Electronics has much wider order-value variation than everyday household products.
Next, the distribution is inspected to understand whether a small number of high-value orders explain that difference.
At this point, statistics has already improved the analysis without requiring advanced mathematics.
The analyst has moved from:
“Average order value is ₹1,800.”
to a more useful interpretation:
“The average is influenced by a smaller number of high-value purchases, while the typical order is closer to the median.”
That is the level of reasoning beginners should aim to develop.
How Deep Should a Beginner Go?
For reporting and dashboard-oriented analytics, a strong foundation in descriptive statistics, percentages, variation, distributions and basic correlation may be enough to begin meaningful project work.
Learners moving toward product experimentation, forecasting or more advanced analytics will need deeper knowledge of probability, sampling, confidence intervals, hypothesis testing and regression.
Data science and machine-learning paths generally require still greater statistical depth.
The key is to learn statistics according to the problem you are trying to solve rather than studying advanced theory too early.
Common Misconceptions About Statistics in Analytics
One misconception is that strong mathematics must come before analytics. In practice, many beginners understand statistical concepts more easily when they see them applied to sales, marketing, finance or customer data.
Another mistake is memorising formulas without learning interpretation. Knowing how to calculate variance is less useful if you cannot explain what higher variability means for the business.
Beginners also sometimes treat averages as complete answers. Outliers, skewed distributions and different levels of variation can make a single average misleading.
Finally, statistical software and AI tools do not remove the need for understanding. A tool can calculate a correlation or run a test, but the analyst still needs to interpret the result correctly.
A Practical Statistics Roadmap for Data Analysts
A sensible learning sequence is to begin with percentages, ratios, mean, median and quartiles. Then learn range, variance and standard deviation so that you can describe variation.
After that, study basic probability and common distribution ideas. Once these concepts are comfortable, move into correlation, covariance, and basic regression.
Hypothesis testing and confidence intervals can follow when your projects require comparisons or inferential reasoning.
The current AI-powered Data Analytics course from FLM includes descriptive statistics, probability distributions, correlation, covariance, hypothesis testing, and regression as part of the broader analytics syllabus.
FLM Perspective: Learn Statistics Through Decisions, Not Formulas
A useful learning framework is:
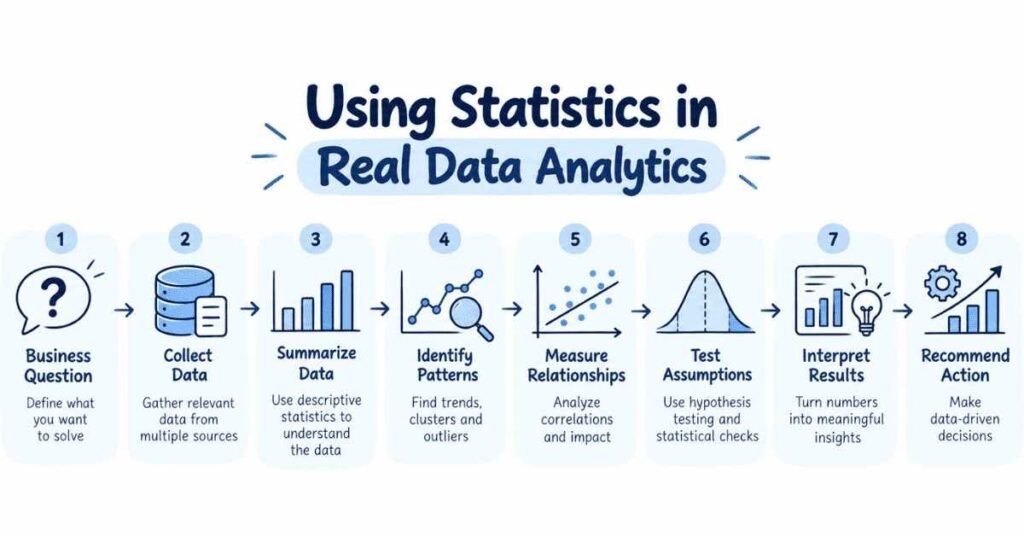
Describe → Compare → Explain → Validate
Describe the data using suitable summaries.
Compare groups, periods or categories.
Explain the patterns using business context and statistical relationships.
Validate whether your conclusion is supported by enough evidence.
This approach keeps analyst statistics connected to practical decisions rather than turning statistics into a separate mathematics subject.
Conclusion
A data analyst needs enough statistics to understand what the data is saying—and enough judgement to recognise when a simple summary is not sufficient.
Start with mean, median, percentages, variance, standard deviation and distributions. Add probability and correlation once those foundations are comfortable. Move into regression and hypothesis testing when the type of analysis demands them.
You do not need to master advanced statistics before beginning data analytics. You do need to understand the statistical ideas behind the numbers you report.
That distinction makes statistics far more manageable for beginners.
Related Career Guides
- How to Become a Data Analytics Professional – Understand the complete analytics career path.
- 90-Day AI-Powered Data Analyst Roadmap – Follow a practical step-by-step learning plan.
- Data Analytics Interview Preparation Guide 2026 – Prepare for technical and practical interview questions.
- How to Use Excel for Data Analysis – Apply statistics to real datasets using Excel.
- What Is Exploratory Data Analysis (EDA)? – Learn how statistics helps identify patterns, outliers, and distributions.
Frequently Asked Questions (FAQs)
Do data analysts need advanced statistics?
Not for every analytics role. Beginners should first build strong descriptive-statistics and data-interpretation skills. More advanced topics become relevant for experimentation, forecasting and modelling.
Which statistics should a beginner learn first?
Begin with mean, median, percentages, quartiles, range, variance and standard deviation.
Why is median useful in analytics?
Median can provide a useful description of the centre when extreme values strongly affect the mean.
Why do analysts need variance?
Variance helps describe how widely observations differ rather than only showing their average value.
Is probability necessary for data analytics?
Basic probability is useful for understanding uncertainty, distributions and later concepts such as statistical testing.
Do data analysts need hypothesis testing?
Not for every task, but it becomes useful when analysts need to evaluate differences between groups or experiments.
Is statistics difficult for non-IT students?
It can be learned gradually. Business examples and real datasets often make statistical concepts easier to understand than studying formulas alone.
Can AI calculate statistics for me?
AI and analytics software can perform calculations, but analysts still need to select the right method, check assumptions and interpret the output.
Ready to Become a Data Analyst
Build real-world skills and prepare for your analytics career.
👉 Join Our Data Analytics Program