
How to Build a Data Analytics Learning Plan from Scratch
Table of Contents
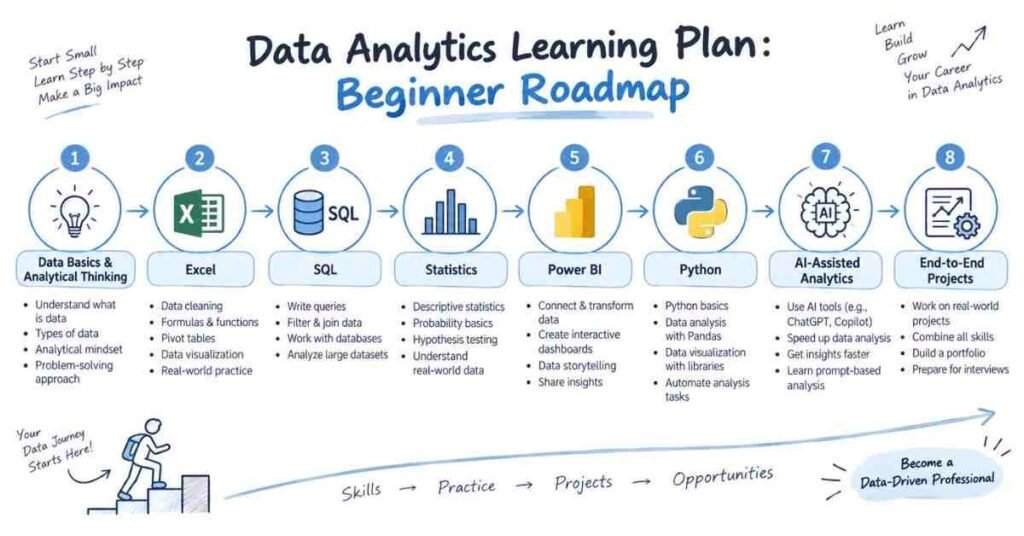
A good data analytics learning plan is not a long list of tools. It is a sequence that helps you understand data, work with it, answer questions, and communicate useful insights. For beginners, one common mistake is trying to learn Excel, SQL, Power BI, Python, statistics, and AI tools at the same time.
A better approach is to learn one layer at a time and connect every new skill to a practical dataset. This is especially useful for students, freshers, non-IT learners, working professionals, and people already working around data who want to move into an IT-focused analytics role.
Quick Answer: What Should You Learn First in Data Analytics?
Start with the business question and basic data handling, then build skills in this order:
- Data basics and analytical thinking
- Excel for cleaning, calculations, and quick analysis
- SQL for querying structured data
- Basic statistics for interpreting patterns correctly
- Data visualization with Power BI or a similar BI tool
- Python for larger or repeatable analysis
- AI-assisted analytics for productivity, checking, and exploration
- End-to-end projects that combine the skills
This sequence is a recommended learning path, not a universal rule. Your starting point can change if you already know Excel, SQL, or another tool.
Start Your Data Analytics Journey
Learn Excel, SQL, Power BI, Python & AI with practical projects.
👉 Join Now
Step 1: Understand What an Analyst Is Trying to Solve
Before learning software, practice turning a broad problem into answerable questions.
Suppose a retail store has six months of sales data. Instead of saying, “Analyze the data,” ask:
- Which products generate the most revenue?
- Which months show lower sales?
- Which locations have the highest average order value?
- Are repeat customers behaving differently from new customers?
This habit matters because tools become more useful once the question is clear. Microsoft’s data-analyst learning material similarly describes analytics work around preparing, transforming, visualizing, and turning data into useful information for decision-making.
Practice Goal
Take any small dataset and write five business questions before touching a formula or chart. This trains analytical thinking from the beginning.
Step 2: Learn Excel as Your First Working Tool
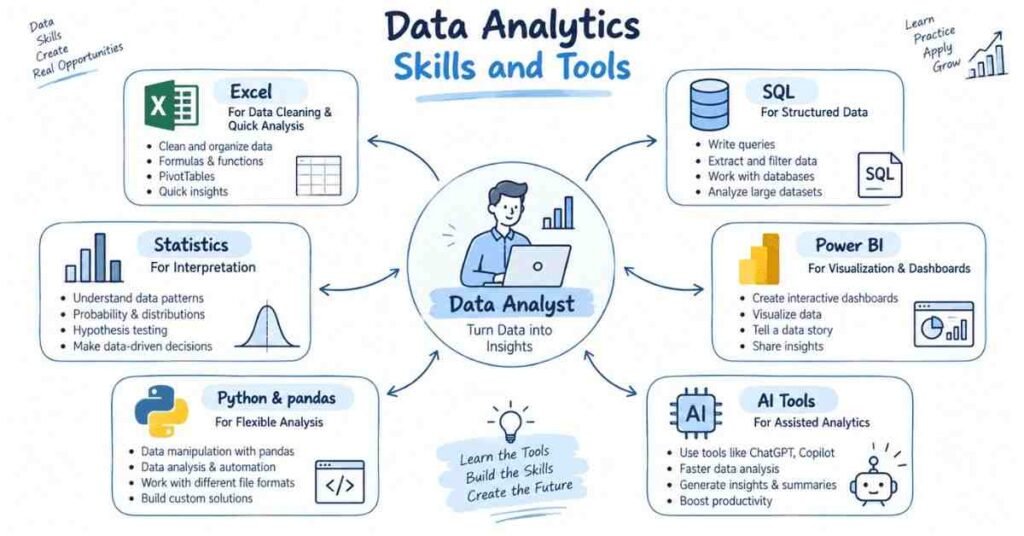
For many beginners, Excel is a practical place to understand rows, columns, data types, formulas, filters, lookup logic, PivotTables, and charts.
Focus first on:
- Sorting and filtering
- Basic formulas such as SUM, AVERAGE, COUNT, and IF
- Text and date functions
- Lookup concepts
- Removing duplicates and handling missing values
- PivotTables and simple charts
- Basic dashboard thinking
Power Query can be introduced after the basics. Microsoft describes Power Query as technology for connecting to data and then transforming, combining, and loading it for analysis.
Practice Goal
Use a sales or expense dataset. Clean inconsistent categories, calculate totals, create a PivotTable, and build two charts. Then write three observations in plain English.
Step 3: Move to SQL for Structured Data
Once you are comfortable reading a table, learn how to retrieve and combine data from databases.
A beginner SQL sequence can be:
SELECT → WHERE → ORDER BY → aggregate functions → GROUP BY → HAVING → joins → subqueries/CTEs → window functions
PostgreSQL’s official tutorial introduces querying, joins, aggregates, views, transactions, and window functions. Its documentation explains how joins combine rows from multiple tables and how aggregate functions calculate results such as counts, sums, averages, minimums, and maximums.
Practice Goal
Create or use a small database containing customers, orders, and products. Write queries answering questions such as:
- Which customers placed the most orders?
- What is monthly revenue?
- Which product categories contribute the most sales?
Do not practice SQL only as syntax. Every query should answer a real question.
Step 4: Learn the Statistics You Actually Need
You do not need to begin with advanced mathematics. Start with concepts that help you understand and interpret data:
- Mean, median, and percentages
- Range and variation
- Distributions
- Correlation
- Sampling basics
- Probability fundamentals
- Confidence and hypothesis-testing concepts when you are ready
The objective is not simply to memorize formulas. It is to understand what a number means and recognize situations where a single metric may give an incomplete picture.
Practice Goal
Take the same retail dataset and compare average sales with median sales. Look for unusually large orders and examine whether a few extreme values are influencing the result.
Step 5: Learn Data Visualization and Power BI
After you can clean and query data, start learning how to communicate findings visually.
Microsoft’s current Power BI learning paths cover preparing data, building data models, and creating reports. Its data-preparation path specifically includes Power Query for connecting to, profiling, cleaning, transforming, and loading data before modeling.
Start with:
- Choosing a chart that matches the question
- Avoiding unnecessary visual clutter
- Building basic measures and KPIs
- Understanding relationships between tables
- Filters and slicers
- Report layout and storytelling
Practice Goal
Build a one-page sales dashboard containing revenue, order count, category performance, monthly trends, and one useful filter.
Then ask: Can someone understand the main story quickly without me explaining every chart?
Step 6: Add Python When You Need More Flexibility
Python becomes useful when analysis is repetitive, datasets become larger, or you need more control over cleaning and exploration.
Begin with Python fundamentals and then move to pandas. The official pandas documentation describes it as a tool for exploring, cleaning, and processing tabular data and supports common data sources such as CSV, Excel, SQL, JSON, and Parquet.
You do not need to learn every Python topic before applying it to analytics.
Practice Goal
Load a CSV file with pandas, inspect missing values, clean several columns, group the data, calculate summary metrics, and export the cleaned result.
Step 7: Use AI Tools as Assistants, Not as Substitutes
AI tools can support your learning by explaining unfamiliar formulas, suggesting SQL approaches, helping interpret errors, generating draft code, or proposing questions to investigate.
But treat AI output as something to verify. A query that runs can still answer the wrong business question. A professional-looking chart can still communicate the wrong message.
A useful learning rule is:
Ask AI → Test the output → Inspect the data → Explain the result yourself
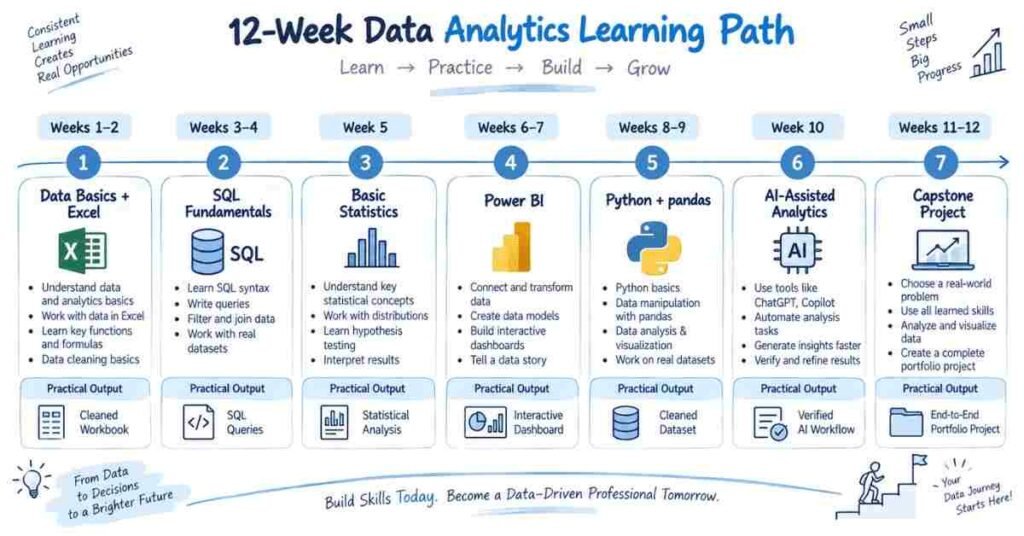
A Practical 12-Week Analytics Learning Path
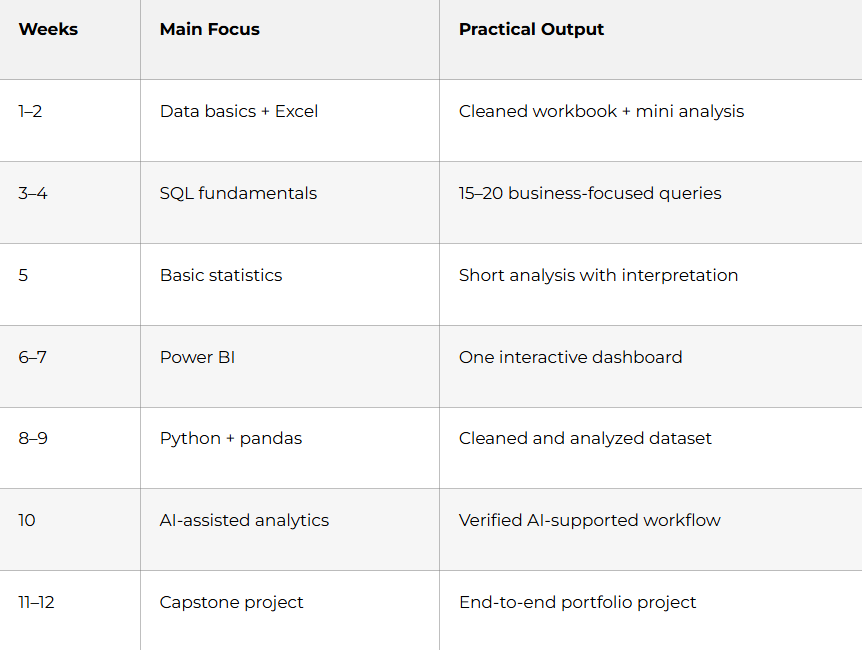
Treat this as a template rather than a deadline. Someone working full-time may need more weeks, while someone who already knows Excel or SQL may progress faster.
The FLM-Style “One Skill, One Dataset, One Output” Method
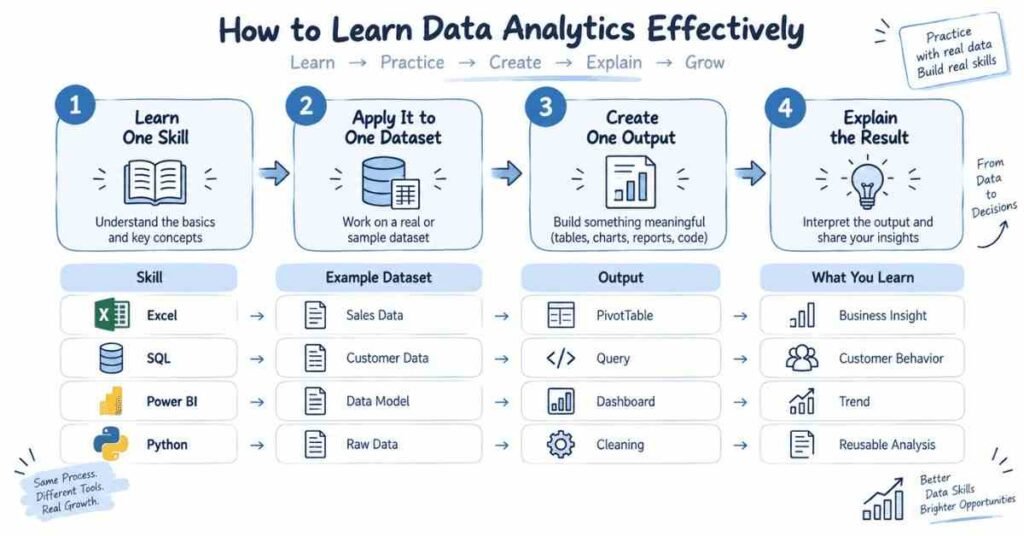
A simple way to avoid passive learning is to connect every skill to visible work:
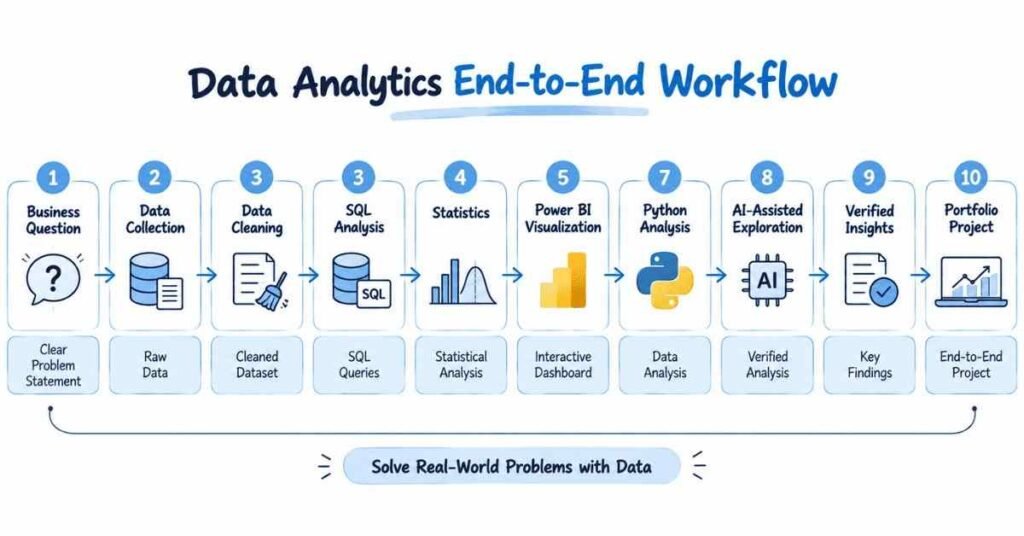
Learn one skill → Apply it to one dataset → Create one output → Explain the result
For example:
- Excel → clean sales data → PivotTable → explain the top category
- SQL → join orders and customers → query result → explain customer behavior
- Power BI → model data → dashboard → explain a trend
- Python → automate cleaning → reusable notebook → explain what changed
- AI tool → assist with analysis → verified result → explain what you accepted or corrected
This makes your analytics learning path cumulative instead of fragmented.
Common Mistakes When Learning Data Analytics
A data analytics roadmap can fail even when the learning resources are good. Common problems include collecting courses without practicing, jumping into advanced Python too early, building dashboards before learning data cleaning, copying project steps without understanding them, and accepting AI-generated formulas or queries without verification.
Another mistake is changing datasets for every skill. Reusing one dataset across Excel, SQL, statistics, Power BI, and Python helps you understand how the tools connect.
How Do You Know When You Are Ready to Move Forward?
Do not wait until you have “finished” an entire tool. Move forward when you can complete a small task without following every step from a tutorial.
After learning SQL, for example, you should be able to look at a simple business question and decide whether you need filtering, grouping, aggregation, or a join.
After learning visualization, you should be able to explain why you selected a particular chart.
Your goal is not tool completion. It is independent problem-solving.
Frequently Asked Questions (FAQs)
Can a complete beginner learn data analytics?
Yes. Begin with data basics and a simple working tool such as Excel, then gradually move into SQL, statistics, visualization, programming, and projects.
Should I learn Excel or SQL first?
For many complete beginners, Excel provides an accessible way to understand tables and basic analysis. SQL can follow soon afterward because it introduces structured querying of database data.
Do I need Python from the beginning?
No. Python is useful, but it does not have to be your first skill. You can build a strong foundation in Excel, SQL, statistics, and visualization before adding Python.
How much statistics do you need for data analytics?
Start with descriptive statistics, distributions, variation, correlation, and basic probability. Learn more advanced statistical techniques when the problems or projects you work on require them.
Should I learn Power BI before SQL?
You can explore Power BI early, but learning data querying and preparation helps you understand where dashboard data comes from and how it should be structured.
How can a non-IT learner practice effectively?
Use small datasets based on familiar subjects such as sales, expenses, attendance, e-commerce, or customer behavior. Focus first on questions and outputs rather than technical terminology.
How should working professionals learn with limited time?
Use a consistent weekly schedule and aim for one measurable output each week. A completed query set, dashboard, or cleaned dataset provides clearer evidence of progress than several unfinished tutorials.
Can AI tools help me learn data analytics?
Yes. They can support explanations, debugging, draft formulas, code, and exploratory analysis. The important step is verifying the result and understanding the logic yourself.
Related Career Guides
Useful follow-up topics include:
- Data Analytics Roadmap for Beginners
- Excel Skills Required for Data Analysts
- SQL Learning Roadmap for Data Analytics
- How to Build a Data Analytics Portfolio
- Data Analytics Projects for Beginners
Only link these titles once the corresponding FLM article exists or has been approved in the content cluster.
Build Your Learning Plan Around Practice
A strong data analytics learning plan should not simply be a checklist of software. It should explain how one skill prepares you for the next and how every skill is applied to a practical problem.
If you prefer structured Telugu guidance while following this type of learning sequence, you can learn Data Analytics with practical projects through FLM’s AI-Powered Data Analytics program. The current course page includes Excel, SQL, statistics, Power BI, Python, AI-assisted analysis, and project-based learning.
Whether you learn data analytics independently or through structured training, keep the same principle:
Learn a concept → apply it → create an output → explain what it means → move to the next layer.
Ready to Become a Data Analyst
Build real-world skills and prepare for your analytics career.
👉 Join Our Data Analytics Program