Advanced Excel with AI: Complete 90-Day Career Transformation Roadmap
Think about this – you’re spending hours creating reports that could be done in minutes. You’re manually sorting through thousands of rows when AI could do it instantly. You’re stuck in the same position while others who know Excel with AI are getting promoted and earning more.
This isn’t just another Excel course. This is your ticket to becoming irreplaceable in today’s job market, where Excel remains the most in-demand skill across industries – appearing in over 531,000 job listings, far surpassing even Python and machine learning.
Why This 90-Day Journey Will Change Your Career
Every business today runs on data. Whether you’re in finance, marketing, HR, operations, or even a student preparing for your first job, Excel with AI isn’t optional anymore – it’s essential. Companies like Infosys, TCS, Accenture, Capgemini, Wipro, and IBM are actively hiring professionals who can combine traditional Excel expertise with modern AI capabilities.
The reality is simple: professionals with certified Excel skills earn 12% more on average than those without certification. More importantly, 83% of clerical and administrative positions require Excel proficiency, and this extends to engineering, finance, and management roles.
But here’s what makes this different – you’re not just learning Excel. You’re learning how to make Excel work smarter using ChatGPT and AI, which means you’ll finish tasks in hours that used to take days.
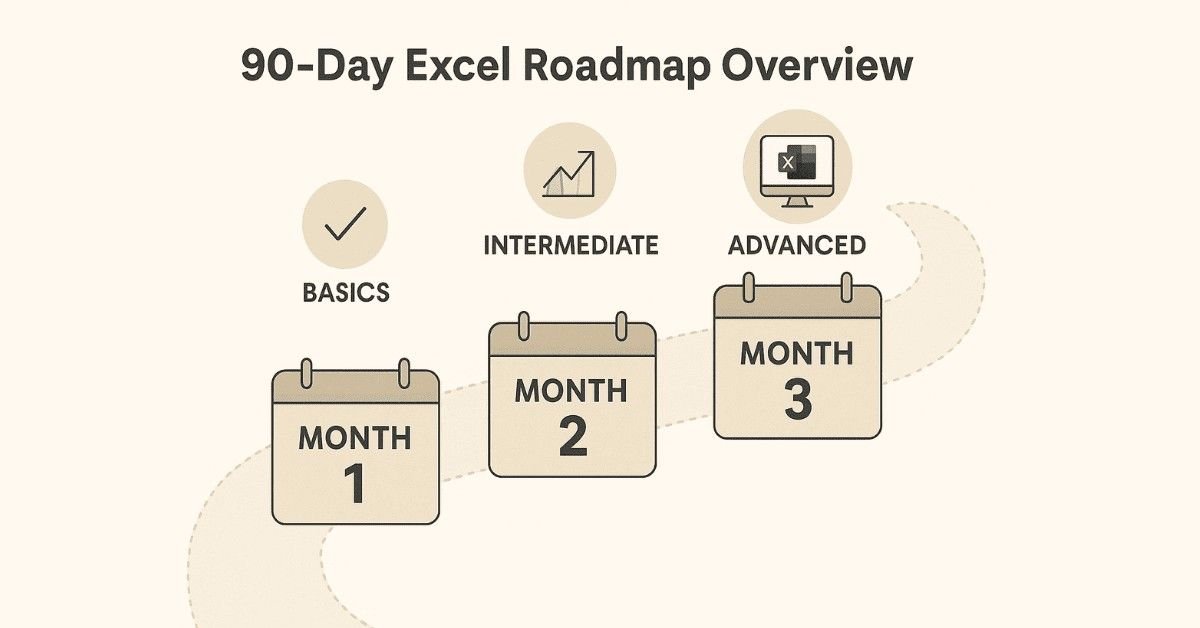
Month 1: Building Your Foundation (Days 1-30)
Become an Excel Power User
Master formulas, dashboards, automation & data analysis with our
Advanced Excel Course.
The first month is about establishing a rock-solid foundation. You’ll start from absolute basics and gradually build confidence. Even if you’ve never opened Excel before, by day 30, you’ll be creating professional spreadsheets with AI assistance.

Week 1: Getting Comfortable with Excel and AI (Days 1-7)
Day 1: Excel Interface Mastery
Understanding the Excel workspace, ribbons, quick access toolbar, formula bar, and cells. Learning to navigate large spreadsheets efficiently using keyboard shortcuts. Creating your first workbook and understanding file formats.
Day 2: Introduction to ChatGPT for Excel
Setting up ChatGPT account and understanding different versions. Learning how AI can assist your Excel work. Exploring basic prompts to get Excel help. Understanding the capabilities and limitations of AI in spreadsheet tasks.
Day 3: Data Entry Fundamentals
Entering different types of data (text, numbers, dates). Understanding Excel’s auto-fill feature. Using AI to generate sample datasets for practice. Learning best practices for organizing data in rows and columns.
Day 4: Cell Formatting Basics
Formatting cells with fonts, colors, borders, and alignments. Understanding number formats for currency, percentages, and decimals. Using ChatGPT to suggest formatting standards for professional reports.
Day 5: Date and Time Formatting
Working with date formats, time formats, and custom date displays. Understanding how Excel stores dates as numbers. Using AI to create date calculation formulas and solve date-related problems.
Day 6: Understanding Cell References
Learning the difference between relative references (A1), absolute references ($A$1), and mixed references. Understanding when to use each type. Practicing with real-world examples using AI guidance.
Day 7: Weekend Practice + Mini Project
Building your first personal budget spreadsheet from scratch. Applying all concepts learned during the week. Using ChatGPT to troubleshoot issues and improve your spreadsheet design.
Week 2: Prompt Engineering and Basic Formulas (Days 8-14)

Day 8: Introduction to Prompt Engineering
Learning the framework for writing effective prompts to ChatGPT. Understanding how to structure questions to get accurate Excel solutions. Practicing with different prompt styles and analyzing results.
Day 9: Refining AI Queries
Taking vague requirements and turning them into specific prompts. Learning to provide context to AI for better formula suggestions. Understanding how to iterate and improve AI responses.
Day 10: SUM and AVERAGE Functions
Mastering the most fundamental Excel functions. Learning different ways to select ranges. Using ChatGPT to generate complex SUM and AVERAGE formulas with multiple conditions.
Day 11: MIN, MAX, and COUNT Functions
Finding minimum and maximum values in datasets. Counting cells with numbers, non-empty cells, and cells meeting specific criteria. Asking AI to create formulas combining multiple functions.
Day 12: Using AI to Generate Formulas
Learning to describe what you want to accomplish in plain English. Getting ChatGPT to write the exact formula you need. Understanding the formula components AI creates so you can modify them.
Day 13: Formula Explanation with AI
Taking complex formulas from colleagues or online sources and asking ChatGPT to explain them step-by-step. Breaking down nested functions. Understanding formula logic for future modifications.
Day 14: AI Formula Debugging
Identifying common Excel errors (#VALUE, #REF, #DIV/0). Using ChatGPT to troubleshoot formula errors by providing context. Learning systematic approaches to debugging with AI assistance.
Week 3: Data Management with AI Support (Days 15-21)
Day 15: Sorting Data
Single-level and multi-level sorting techniques. Sorting by color, custom lists, and multiple criteria. Using AI to determine optimal sorting strategies for different datasets.
Day 16: Filtering Fundamentals
Applying auto-filters to find specific data quickly. Creating custom filters with multiple conditions. Using ChatGPT to design complex filter criteria for large datasets.
Day 17: Advanced Filtering Techniques
Using filter by color, filter by date ranges, and text filters. Combining multiple filter conditions. Asking AI to help create filter combinations for business reporting scenarios.
Day 18: Data Validation Basics
Creating dropdown lists for data entry control. Setting validation rules for numbers, dates, and text length. Understanding why data validation prevents errors and improves data quality.
Day 19: Advanced Data Validation with AI
Using ChatGPT to create custom validation formulas. Building dependent dropdown lists. Creating validation rules that reference other cells or sheets.
Day 20: Remove Duplicates
Identifying and removing duplicate records from datasets. Understanding which columns to check for duplicates. Using AI to analyze data and suggest duplicate removal strategies.
Day 21: Weekend Project – Sales Data Dashboard
Creating a comprehensive sales tracking spreadsheet with sorting, filtering, and validation. Incorporating all techniques learned. Using ChatGPT for guidance and optimization.
Week 4: Text Functions and Data Cleaning (Days 22-30)
Day 22: Text to Columns
Splitting data from single columns into multiple columns. Working with delimited and fixed-width data. Using AI to determine best approach for different data formats.
Day 23: Flash Fill Magic
Understanding Excel’s intelligent Flash Fill feature. Using patterns to automatically transform data. Combining Flash Fill with AI suggestions for complex transformations.
Day 24: LEFT, RIGHT, and MID Functions
Extracting specific characters from text strings. Working with name separation and data parsing. Using ChatGPT to create formulas for extracting information from structured text.
Day 25: LEN and CONCATENATE
Counting characters in cells for validation. Combining text from multiple cells. Using AI to build complex text combination formulas with separators.
Day 26: ChatGPT for Text Manipulation
Describing text transformation needs in natural language. Getting AI to write formulas for complex string operations. Understanding how to modify AI-generated text formulas.
Day 27: Data Cleanup Strategies
Removing extra spaces, fixing inconsistent capitalization, and standardizing formats. Using AI to identify data quality issues. Creating cleanup checklists with ChatGPT assistance.
Day 28: Handling Missing Data
Identifying blank cells and null values. Deciding when to fill, delete, or flag missing data. Using ChatGPT to suggest appropriate handling strategies based on context.
Day 29: Data Transformation Project
Cleaning a messy customer database with multiple issues. Applying all text functions and cleanup techniques. Using AI throughout the process for guidance and validation.
Day 30: Month 1 Review and Assessment
Completing a comprehensive practical test covering all topics. Building a complete project from scratch. Receiving personalized feedback and identifying areas for improvement.
Practice Excel Functions the Right Way
Learn VLOOKUP, XLOOKUP, IF, SUMIFS, COUNTIFS & more with our
Excel How-to Guides.
Month 2: Intermediate Mastery with AI (Days 31-60)
Month two transforms you from a beginner into an intermediate user capable of handling real business problems. You’ll work with logical functions, lookup formulas, and data analysis tools that professionals use daily.
Week 5: Logical and Conditional Functions (Days 31-37)
Day 31: Understanding IF Function
Creating basic IF statements for decision-making. Nesting multiple conditions. Using ChatGPT to build complex logical tests from business rules described in plain language.
Day 32: Advanced IF with IFS
Using IFS function for multiple conditions without nesting. Understanding when IFS is better than nested IF. Getting AI assistance to convert complex nested IF into cleaner IFS formulas.
Day 33: AND and OR Logic
Combining conditions with AND and OR operators. Building multi-criteria decision trees. Using ChatGPT to translate complex business logic into correct formula syntax.
Day 34: COUNTIF and SUMIF
Counting and summing cells based on single criteria. Working with different operators and wildcards. Using AI to create dynamic criteria based on other cell values.
Day 35: COUNTIFS and SUMIFS
Handling multiple criteria across different columns. Understanding the syntax differences from single-criteria functions. Getting ChatGPT to generate formulas with 3+ conditions.
Day 36: IFERROR for Clean Outputs
Handling errors gracefully in formulas. Displaying custom messages when errors occur. Using AI to wrap complex formulas with proper error handling.
Day 37: Weekend Project – Conditional Dashboard
Creating an employee performance tracker with multiple conditional logic. Implementing automated flags and alerts. Using ChatGPT for complex condition building.
Week 6: Lookup Functions Made Simple (Days 38-44)
Day 38: VLOOKUP Fundamentals
Understanding vertical lookup concepts. Finding data in tables based on lookup values. Using ChatGPT to debug VLOOKUP errors and suggest improvements.
Day 39: Advanced VLOOKUP Techniques
Approximate match vs exact match lookups. Using VLOOKUP with sorted data. Getting AI assistance for complex VLOOKUP scenarios with multiple tables.
Day 40: HLOOKUP for Horizontal Data
Working with horizontally structured tables. Understanding when to use HLOOKUP instead of VLOOKUP. Using ChatGPT to convert between VLOOKUP and HLOOKUP.
Day 41: XLOOKUP – The Modern Solution
Understanding XLOOKUP advantages over VLOOKUP. Searching in any direction and returning multiple values. Using AI to migrate old VLOOKUP formulas to XLOOKUP.
Day 42: INDEX and MATCH Combination
Building flexible two-way lookups. Understanding why INDEX-MATCH is more powerful than VLOOKUP. Getting ChatGPT to generate INDEX-MATCH formulas from descriptions.
Day 43: AI as Your Lookup Tutor
Describing lookup problems in plain English. Getting step-by-step explanations from ChatGPT. Learning to troubleshoot lookup formulas with AI assistance.
Day 44: Lookup Functions Project
Creating an automated invoice system using multiple lookup techniques. Pulling product prices, customer details, and tax rates automatically. Using AI for formula optimization.
Week 7: Data Visualization with AI Guidance (Days 45-51)
Day 45: Chart Basics
Understanding when to use column, line, and pie charts. Creating your first charts from data. Using ChatGPT to recommend appropriate chart types for different data stories.
Day 46: Customizing Charts
Formatting chart elements, colors, and styles. Adding data labels and legends effectively. Getting AI suggestions for professional chart design principles.
Day 47: Advanced Chart Types
Creating combo charts, scatter plots, and waterfall charts. Understanding specialized chart use cases. Using ChatGPT to determine which advanced chart fits your data.
Day 48: AI Recommendations for Visualizations
Describing your data and goals to ChatGPT. Getting specific visualization recommendations. Learning to ask AI about color schemes and chart best practices.
Day 49: Dynamic Charts
Creating charts that update automatically with new data. Using named ranges and table references. Getting AI help to build self-updating chart configurations.
Day 50: Dashboard Design Principles
Arranging multiple charts for maximum impact. Understanding visual hierarchy and user experience. Using ChatGPT to critique and improve dashboard layouts.
Day 51: Complete Visualization Project
Building a multi-chart sales performance dashboard. Implementing best practices learned throughout the week. Getting AI feedback on design and effectiveness.
Week 8: Data Analysis and Insights (Days 52-60)
Day 52: Descriptive Statistics
Calculating mean, median, mode, and standard deviation. Understanding what these measures tell you about data. Using ChatGPT to interpret statistical results in business context.
Day 53: Data Analysis Toolpak
Enabling and using Excel’s Analysis Toolpak add-in. Running regression analysis and correlation studies. Getting AI assistance to interpret statistical output.
Day 54: Using AI for Data Interpretation
Uploading datasets to ChatGPT for analysis. Getting plain-English explanations of trends and patterns. Learning to ask AI the right questions about your data.
Day 55: Writing Insights with AI Help
Translating numbers into business insights. Using ChatGPT to draft executive summaries from data. Creating data-driven recommendations with AI assistance.
Day 56: Goal Seek Functionality
Using Goal Seek to work backwards from desired results. Solving for unknown variables in formulas. Getting ChatGPT to help frame Goal Seek scenarios.
Day 57: Data Tables for What-If Analysis
Creating one-variable and two-variable data tables. Analyzing multiple scenarios simultaneously. Using AI to determine which variables to test.
Day 58: Business Scenario Simulation
Building financial models with multiple scenarios. Using ChatGPT to suggest scenario variables. Creating comparison frameworks for decision-making.
Day 59: Comprehensive Analysis Project
Analyzing a complete business dataset from raw data to insights. Creating visualizations, running statistics, and writing recommendations. Using AI throughout the analytical process.
Day 60: Month 2 Review and Certification Prep
Completing intermediate-level assessment test. Reviewing all Month 2 concepts and techniques. Preparing for advanced topics in Month 3.
Month 3: Advanced Mastery and Career Preparation (Days 61-90)
The final month transforms you into an advanced Excel professional ready for the job market. You’ll master automation, PivotTables, advanced analytics, and most importantly, prepare yourself for landing jobs with profile optimization and interview preparation.
Week 9: PivotTables and Advanced Analysis (Days 61-67)
Day 61: PivotTable Fundamentals
Understanding what PivotTables are and why they’re powerful for data summarization. Creating your first PivotTable from raw data. Learning to drag and drop fields into rows, columns, values, and filters areas. Using ChatGPT to explain PivotTable concepts in simple terms.
Day 62: PivotTable Calculations
Adding calculated fields to PivotTables for custom metrics. Understanding different summarization methods (sum, average, count, percentage). Using AI to create complex calculated field formulas based on business requirements.
Day 63: Grouping and Formatting PivotTables
Grouping dates by month, quarter, and year automatically. Grouping numeric data into ranges. Applying professional formatting and styles. Getting ChatGPT suggestions for optimal grouping strategies based on your analysis goals.
Day 64: Slicers and Interactive Filtering
Adding slicers for easy visual filtering of PivotTables. Creating connected slicers across multiple PivotTables. Designing user-friendly dashboard interfaces. Using AI to suggest which fields should become slicers.
Day 65: PivotCharts for Visual Analysis
Creating charts directly from PivotTables that update dynamically. Understanding when to use PivotCharts versus regular charts. Combining multiple PivotCharts into comprehensive dashboards. Getting ChatGPT guidance on chart selection for different data stories.
Day 66: ChatGPT for PivotTable Setup
Describing your analysis needs to AI and getting step-by-step PivotTable creation instructions. Using ChatGPT to troubleshoot PivotTable issues. Getting AI recommendations for which fields to analyze and how to structure your PivotTable.
Day 67: Weekend PivotTable Project
Building a complete sales analysis dashboard using multiple PivotTables and PivotCharts. Implementing slicers for interactive exploration. Creating executive-ready reports with AI assistance throughout the process.
Prepare for Excel Interviews
Get 150+ real Excel interview questions—formulas, dashboards, analytics, automation—in our
Excel Interview Preparation Guide.
Week 10: Automation with Macros and VBA (Days 68-74)
Day 68: Introduction to Macros
Understanding what macros are and how they save time by automating repetitive tasks. Recording your first macro for a simple task. Playing back macros and understanding when to use macro automation.
Day 69: Advanced Macro Recording
Recording macros with relative references for flexibility. Assigning macros to buttons for easy execution. Understanding macro security settings and safe practices. Using ChatGPT to explain macro concepts and troubleshoot recording issues.
Day 70: Introduction to VBA Code
Viewing the Visual Basic code behind recorded macros. Understanding basic VBA structure and syntax. Making simple edits to existing macro code. Getting AI explanations of VBA code line-by-line.
Day 71: ChatGPT-Generated VBA Scripts
Describing automation tasks to ChatGPT in plain English. Getting AI to write complete VBA scripts for complex tasks. Understanding how to implement AI-generated code safely. Learning to modify AI-written code for your specific needs.
Day 72: Custom Functions with VBA
Creating user-defined functions that work like built-in Excel functions. Using ChatGPT to write custom function code. Testing and debugging custom functions. Building a library of reusable functions.
Day 73: Advanced Automation Scenarios
Automating data imports from multiple sources. Creating self-updating reports that run on schedule. Building forms for data entry automation. Using AI to design complete automation workflows.
Day 74: Automation Project
Building an automated monthly report generator using macros and VBA. Implementing error handling and user feedback. Testing thoroughly with different scenarios. Getting ChatGPT assistance for code optimization.
Week 11: Advanced AI Tools and Add-ins (Days 75-81)
Day 75: ExcelGPT Add-in Installation
Installing and setting up the ExcelGPT add-in for Excel. Understanding how to access AI formulas directly within spreadsheets. Configuring API keys and settings. Exploring the add-in interface and capabilities.
Day 76: AI Formulas in Sheets
Using ExcelGPT to generate formulas without leaving Excel. Writing natural language prompts that create instant calculations. Understanding the advantages of in-sheet AI versus separate ChatGPT queries.
Day 77: Bulk Data Processing with AI
Using AI add-ins to process hundreds or thousands of rows simultaneously. Batch text extraction, classification, and transformation. Creating AI-powered data enrichment workflows. Understanding API rate limits and best practices.
Day 78: Microsoft Copilot Preview
Exploring Microsoft 365 Copilot features within Excel (if available). Using natural language to create formulas, charts, and PivotTables. Understanding the future of AI integration in Excel. Comparing Copilot capabilities with ChatGPT approaches.
Day 79: Excel Productivity Shortcuts
Mastering keyboard shortcuts that drastically speed up work. Creating custom Quick Access Toolbar with frequently used commands. Using ChatGPT to suggest shortcuts based on your workflow. Building muscle memory for efficient Excel navigation.
Day 80: Power Query Basics
Understanding Power Query for advanced data transformation. Connecting to external data sources (databases, web, files). Creating repeatable transformation steps. Using AI to guide Power Query M language coding.
Day 81: Integration Project
Building a comprehensive solution using Excel, AI add-ins, macros, and Power Query together. Creating an end-to-end automated analytics pipeline. Documenting your workflow for portfolio purposes.

Week 12: Career Preparation and Job Readiness (Days 82-90)
Day 82: Building Your Excel Portfolio
Selecting your best 5-7 projects from the 90-day journey. Creating professional documentation for each project. Recording screen demonstrations of complex solutions. Preparing GitHub repository or portfolio website showcase. Understanding what employers look for in Excel portfolios.
Day 83: Resume Building for Excel Roles
Crafting achievement-focused resume bullet points highlighting Excel accomplishments. Quantifying results (e.g., “Automated monthly reporting saving 15 hours/week”). Using action verbs specific to data analysis and Excel work. Incorporating Excel with AI as a key skill differentiator. Getting resume templates optimized for ATS systems.
Day 84: LinkedIn Profile Optimization
Creating a compelling LinkedIn headline featuring Excel and AI expertise. Writing an engaging summary that tells your Excel learning journey story. Adding all relevant Excel skills and endorsements strategically. Showcasing projects with rich media (screenshots, videos). Optimizing profile for recruiter searches using keywords like “Excel automation,” “data analysis,” “AI-powered reporting”.

Day 85: Job Platform Mastery
Creating profiles on Naukri, LinkedIn Jobs, Indeed, and Glassdoor. Setting up job alerts for Excel analyst, data analyst, and MIS roles. Understanding how to filter jobs by skill requirements. Learning to customize applications for each position. Exploring company research techniques before applying.
Day 86: Excel-Specific Interview Preparation – Technical
Preparing for common Excel interview questions about formulas, functions, and features. Practicing live Excel tests and timed challenges. Understanding what interviewers assess during practical Excel demonstrations. Preparing examples from your projects for behavioral questions. Learning to explain complex Excel solutions in simple terms.
Day 87: Excel Interview Preparation – Communication
Practicing “Tell me about yourself” answers that highlight your Excel journey. Preparing stories using STAR method (Situation, Task, Action, Result) for behavioral questions. Developing responses about working under pressure, meeting deadlines, and solving data problems. Learning to discuss failures and challenges professionally. Practicing virtual interview etiquette and technical setup.
Day 88: Salary Negotiation and Job Offer Evaluation
Researching salary ranges for Excel-related positions in your city. Understanding compensation packages beyond base salary (insurance, leaves, growth opportunities). Learning negotiation techniques for first-time job seekers. Evaluating job offers based on learning opportunities and career growth. Understanding when to accept, negotiate, or decline offers.
Day 89: Final Assessment and Certification
Completing comprehensive 90-day assessment covering all modules. Building a capstone project that demonstrates mastery across all skill levels. Receiving personalized feedback on strengths and areas for continued growth. Obtaining course completion certificate from Frontlines Edutech. Planning your continued learning path beyond certification.
Day 90: Launch Your Career
Finalizing and publishing your LinkedIn profile and portfolio. Sending applications to targeted positions matching your skill level. Scheduling informational interviews with professionals in Excel-heavy roles. Joining online communities and forums for Excel professionals. Celebrating your transformation from beginner to certified Excel with AI professional.
Master Pivot Tables, Dashboards & Automation
Get hands-on with Pivot Tables, Pivot Charts, Power Query & Power Pivot in our
Advanced Excel Course.
4. Career Paths After Course Completion
Your Excel with AI certification from Frontlines Edutech opens doors to multiple high-demand career paths:
Entry-Level Positions (0-2 Years Experience)
Data Entry Specialist with Excel Expertise – Starting salary ₹2.5-4 LPA. Companies need accurate data handlers who can use Excel efficiently for organizing, validating, and maintaining databases.
MIS Executive – Starting salary ₹3-5 LPA. Management Information Systems roles require daily Excel reporting, dashboard creation, and data analysis for business decision-making.
Junior Data Analyst – Starting salary ₹3.5-6 LPA. Analyzing business data, creating visualizations, and supporting senior analysts with Excel-based insights.
Financial Analyst Trainee – Starting salary ₹4-6 LPA. Supporting financial modeling, budget analysis, and reporting tasks using advanced Excel functions.
Mid-Level Positions (2-5 Years Experience)
Business Analyst – Salary ₹6-12 LPA. Translating business requirements into data solutions, creating comprehensive reports, and driving process improvements through data insights.
Operations Analyst – Salary ₹5-10 LPA. Optimizing business operations using data analysis, creating efficiency metrics dashboards, and identifying cost-saving opportunities.
Marketing Analyst – Salary ₹5-11 LPA. Analyzing campaign performance, customer behavior, and ROI using Excel dashboards integrated with marketing platforms.
Senior Data Analyst – Salary ₹7-15 LPA. Leading data projects, mentoring junior analysts, creating complex analytical models, and presenting insights to stakeholders.
Advanced Positions (5+ Years Experience)
Data Analytics Manager – Salary ₹12-25 LPA. Managing analytics teams, setting department strategy, and overseeing enterprise-wide reporting initiatives.
Business Intelligence Lead – Salary ₹15-30 LPA. Architecting BI solutions combining Excel with Power BI, Tableau, and other tools for comprehensive business intelligence.
Financial Planning & Analysis Manager – Salary ₹15-35 LPA. Leading FP&A teams, creating financial models, conducting scenario planning, and supporting executive decision-making.
Industry Demand Across Sectors
Excel with AI skills are universally valuable across every industry sector:
Technology Companies (Infosys, TCS, Wipro, Cognizant, Accenture, IBM) need Excel professionals for client reporting, project tracking, resource allocation, and data analysis across global operations.
Financial Services (Banks, NBFCs, Insurance) require advanced Excel users for financial modeling, risk assessment, portfolio management, loan processing, and regulatory reporting.
E-commerce & Retail (Amazon, Flipkart, Reliance) depend on Excel for inventory management, sales forecasting, pricing optimization, and supply chain analytics.
Consulting Firms (Deloitte, PwC, EY, KPMG) hire Excel experts for client deliverables, financial analysis, market research, and strategic planning presentations.
Healthcare & Pharmaceuticals use Excel for patient data analysis, clinical trial tracking, hospital operations management, and pharmaceutical sales reporting.
Manufacturing requires Excel skills for production planning, quality control tracking, supply chain optimization, and operational efficiency metrics.
Startups across all sectors need versatile professionals who can handle multiple Excel-heavy responsibilities from finance to operations to marketing analytics.
Key Cities with Highest Excel Job Opportunities
Bangalore (Bengaluru) leads with technology and startup ecosystem demanding Excel professionals across all experience levels, offering competitive salaries and growth opportunities.
Hyderabad shows strong demand from IT services, pharmaceutical, and business process outsourcing sectors with attractive compensation packages.
Gurgaon (Gurugram) and Noida (NCR region) offer extensive opportunities in consulting, financial services, and corporate shared services centers.
Mumbai remains the financial capital with maximum opportunities in banking, finance, insurance, and media sectors requiring advanced Excel expertise.
Pune has growing demand from IT, automotive, and manufacturing industries with balanced cost of living and career growth prospects.
Chennai provides opportunities in automotive, manufacturing, IT services, and financial shared services with steady job market growth.
5. Why Choose Frontlines Edutech for Your Excel Journey?
At Frontlines Edutech, we understand the challenge of unemployment and the frustration of having skills but no opportunities. That’s why we’ve designed this comprehensive Excel with AI course to transform you from a beginner into an industry-ready professional in just 90 days.
What Makes Us Different
Industry-Standard Training delivered by experts from top companies who understand exactly what employers are looking for in candidates. Every lesson connects directly to real-world job requirements.
Solution-Focused Approach means we don’t just teach theory. Every day includes practical exercises, real business scenarios, and hands-on projects that build your portfolio while you learn.
Results-Driven Methodology ensures you’re not just completing lessons but actually mastering skills. Our assessment system tracks your progress and identifies areas needing more practice.
Affordable Education with flexible payment options because we believe financial constraints shouldn’t stop anyone from building their career. We’ve helped over 3,000 learners across the state achieve their professional goals.
Transparent Learning with clear day-by-day roadmap, defined learning outcomes, and honest expectations about effort required and results achievable.
Quality with Care for non-IT students who may find technical courses intimidating. We break down complex concepts into simple, understandable language anyone can grasp.
Complete Support System From Scratch to Master Level Training structured progressively so you’re never overwhelmed, starting from Excel basics and gradually building to advanced automation.
Daily Assignments reinforce learning and build confidence through practice, with solutions and personalized feedback.
Resume Building assistance that transforms your learning into professional credentials employers recognize and value.
LinkedIn Profile Building guidance to position yourself as an Excel with AI professional and attract recruiter attention.
Interview Guidance including mock interviews, common question preparation, and strategies for demonstrating your Excel skills effectively.
Course Completion Certificate recognized by employers across industries, validating your 90-day transformation.
Q&A Sessions with instructors to clarify doubts, discuss challenging concepts, and get personalized guidance.
Placement Updates keeping you informed about job opportunities matching your skill level and career goals.
On-Demand Video Access allowing you to learn at your own pace, revisit difficult topics, and balance learning with other commitments.
Downloadable Resources including practice datasets, formula cheat sheets, keyboard shortcut guides, and project templates.
🛣️ Explore Your Data Analyst Career Path
Go from Excel beginner → Advanced Excel → Power BI → Data Analyst using our
Data Analytics Career Path
Real Success Stories
Thousands of learners have trusted Frontlines Edutech to bridge the gap between their current situation and their dream career. Our students have successfully placed in companies like Infosys, TCS, Accenture, Capgemini, Wipro, Cognizant, IBM, and KPMG across various roles requiring Excel expertise.
What started as basic Excel knowledge transformed into powerful career tools that made them indispensable in their organizations. They went from manually creating reports to building automated dashboards that saved hours daily. They moved from entry-level positions to analyst roles with significant salary increases.
Their success isn’t luck – it’s the result of structured learning, dedicated practice, expert guidance, and the confidence that comes from mastering in-demand skills.
Your Investment in Your Future
This 90-day journey requires commitment. You’ll need to dedicate 2-3 hours daily for learning, practice, and assignments. Some days will feel challenging when formulas don’t work as expected or concepts seem complex.
But here’s the reality: 90 days is a tiny fraction of your professional life. Three months of focused effort can unlock decades of career opportunities. While others are still wondering what skills to learn, you’ll have a recognized certification, a portfolio of projects, and the confidence to apply for positions paying ₹3-6 LPA to start, with clear growth to ₹12-25 LPA as you gain experience.
The professionals earning those higher salaries didn’t start there. They invested time in learning, practiced consistently, and leveraged their skills to create value for employers. That’s exactly what this course prepares you to do.
Start Your Transformation Today
Every day you wait is another day someone else is learning these skills and moving ahead. The job market rewards those who act, who invest in themselves, who take that first step despite uncertainty.
Excel remains the most in-demand skill in 2025, appearing in over 531,000 job listings – more than any other technical skill including Python, SQL, or machine learning. Combined with AI capabilities, you’re learning the exact skill set employers are desperately seeking.
Frontlines Edutech has already empowered over 3,000 learners to transform their careers. We’ve seen students go from unemployment to placement, from unconfident beginners to skilled professionals, from struggling with basic formulas to building automated systems that wow their managers.
The question isn’t whether you can learn Excel with AI. The question is: when will you start?
This 90-day roadmap gives you everything – the structure, the support, the skills, and the career preparation. All that’s missing is your commitment to show up every day and do the work.
Ninety days from now, you could be applying to jobs with confidence, showcasing a portfolio of impressive Excel projects, and positioning yourself as a valuable professional companies actively want to hire. Or you could be in the same place you are today, still thinking about learning, still wondering if you can do it.
The choice is yours. The roadmap is ready. Your future career is waiting.
Enroll in Frontlines Edutech’s Excel with AI course today and transform from beginner to industry-ready professional in just 90 days.
Contact us at +91-83330 77727 or visit www.frontlinesedutech.com to start your journey. Your career transformation begins now.
🎯 Your Excel Career Starts Today
Choose your next step and begin your transformation with Frontlines Edutech.