
How to Use SQL to Explore an Analytics Dataset
Table of Contents
Receiving a new dataset can be confusing. You may have thousands of rows, unfamiliar columns, missing values, and several tables connected through IDs. Before building a dashboard or calculating business metrics, you first need to understand what the data actually contains.
That is where SQL data exploration becomes useful. SQL allows an analyst to inspect a dataset systematically: view sample records, understand categories, check missing information, filter relevant rows, summarise patterns, and connect related tables.
For beginners, exploration is one of the best ways to develop practical SQL ability because every query answers a clear question about the data.
Quick Answer: How Can SQL Be Used to Explore Data?
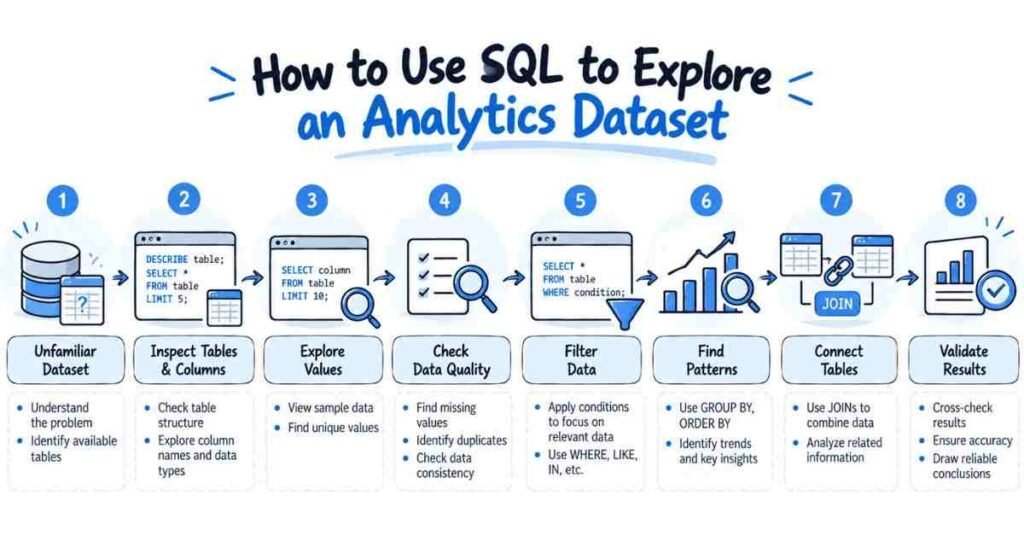
SQL can help you move through an unfamiliar dataset in stages.
You can use SELECT to inspect columns and records, WHERE to focus on relevant data, DISTINCT to discover available categories, aggregate functions to calculate summaries, GROUP BY to compare groups, and JOIN to bring information together from related tables.
PostgreSQL’s documentation describes SELECT as the SQL command used to specify queries and retrieve data from tables.
The important point is not to begin with a complex query. Good exploration starts with simple questions and gradually becomes more specific.
Start Your Data Analytics Journey
Learn Excel, SQL, Power BI, Python & AI with practical projects.
👉 Join Now
Start by Understanding What the Dataset Contains
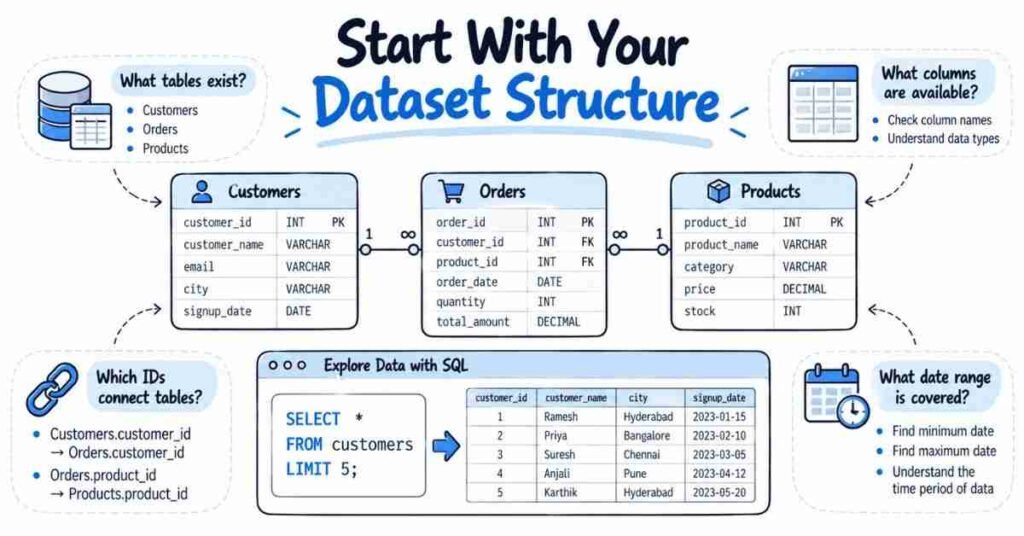
Before calculating anything, become familiar with the structure.
Imagine you receive an e-commerce database containing three tables:
- customers
- orders
- products
Your first questions should be basic.
What does each table represent? Which columns are available? Which field uniquely identifies a customer or order? Which columns connect one table to another? What date range does the dataset cover?
A simple query can give you your first look:
SELECT *
FROM orders
LIMIT 10;
This is not analysis yet. It is orientation.
Looking at a small sample can reveal column names, data formats, possible NULL values, and fields that may need further investigation.
For larger datasets, avoid treating SELECT * as your default analytical query. Once you know the structure, retrieve only the columns you actually need.
Explore the Values Inside Important Columns
Knowing a column name such as category, city, or status is not enough. You also need to understand which values occur inside it.
For example:
SELECT DISTINCT order_status
FROM orders;
A result might contain:
Completed, Cancelled, Returned, and Pending.
That immediately gives you useful context for later analysis.
The same method can be applied to locations, product categories, payment types, customer segments, or other categorical fields.
You can also count records to understand the size of a table:
SELECT COUNT(*) AS total_orders
FROM orders;
At this point, your goal is to become familiar with the dataset rather than prove a hypothesis.
Check Data Quality Before Looking for Insights
One of the most important parts of SQL dataset exploration is identifying problems that could affect the analysis.
Suppose you want to analyse customer locations. First check whether the location field is missing:
SELECT COUNT(*) AS missing_city
FROM customers
WHERE city IS NULL;
You can apply similar checks to dates, transaction amounts, categories, or other important fields.
Duplicate records also deserve attention. If order_id should be unique, you can test it:
SELECT order_id, COUNT(*)
FROM orders
GROUP BY order_id
HAVING COUNT(*) > 1;
This does not automatically mean every repeated value is an error. The meaning depends on how the database is designed. The query simply helps you identify records that require investigation.
This distinction matters in professional analytics: detecting something unusual is not the same as deciding it is wrong.
Use WHERE to Focus the Exploration
After understanding the overall dataset, you can narrow the analysis with WHERE.
Suppose the dataset contains orders from several states, but your question concerns Telangana.
SELECT order_id, order_date, order_value
FROM orders
WHERE state = ‘Telangana’;
Filters can also be combined.
You may want only completed orders above a certain value or records within a particular date range.
Using filters early keeps the analysis aligned with the actual business question instead of analysing every available record simply because it exists.
Use GROUP BY to Discover Patterns
Individual rows tell you what happened in individual transactions. Analysts usually need to move beyond that level and look for patterns across groups.
This is where GROUP BY and aggregation become particularly valuable.
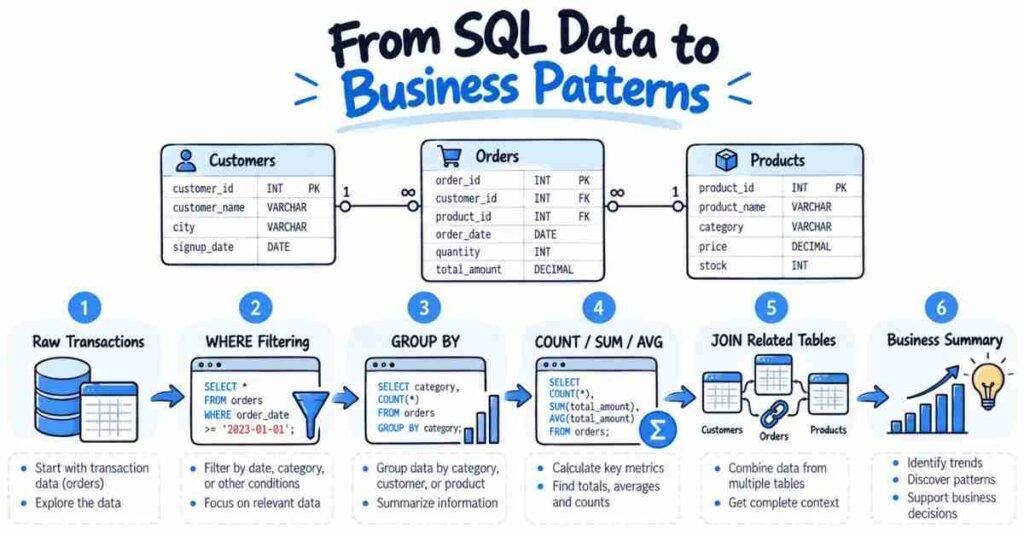
Suppose you want to compare revenue across product categories:
SELECT
category,
COUNT(*) AS total_orders,
SUM(order_value) AS revenue,
AVG(order_value) AS avg_order_value
FROM orders
GROUP BY category;
The result turns many individual transactions into a compact business summary.
PostgreSQL documents GROUP BY as a way of combining rows with common values into groups so that aggregates can be calculated for those groups. Aggregate functions such as COUNT, SUM, AVG, MIN, and MAX help summarise multiple records.
This is why aggregation plays such a central role in SQL data analysis.
Use JOIN When the Answer Is Spread Across Tables
Real analytical questions often require information stored in more than one table.
Imagine the orders table contains:
order_id, customer_id, order_value
while the customers table contains:
customer_id, city
To analyse revenue by customer city, the tables need to be connected.
SELECT
c.city,
COUNT(o.order_id) AS orders,
SUM(o.order_value) AS revenue
FROM customers c
JOIN orders o
ON c.customer_id = o.customer_id
GROUP BY c.city;
JOINs allow queries to combine matching records from different tables. PostgreSQL’s official documentation describes join queries as queries that access multiple tables and pair rows according to a specified relationship.
For beginners, understanding why two tables are connected is more important than memorising several JOIN types.
A Practical SQL Exploration Workflow
Consider a retail dataset that you have never seen before. Instead of immediately searching for “the best-selling product,” explore it in a controlled sequence.
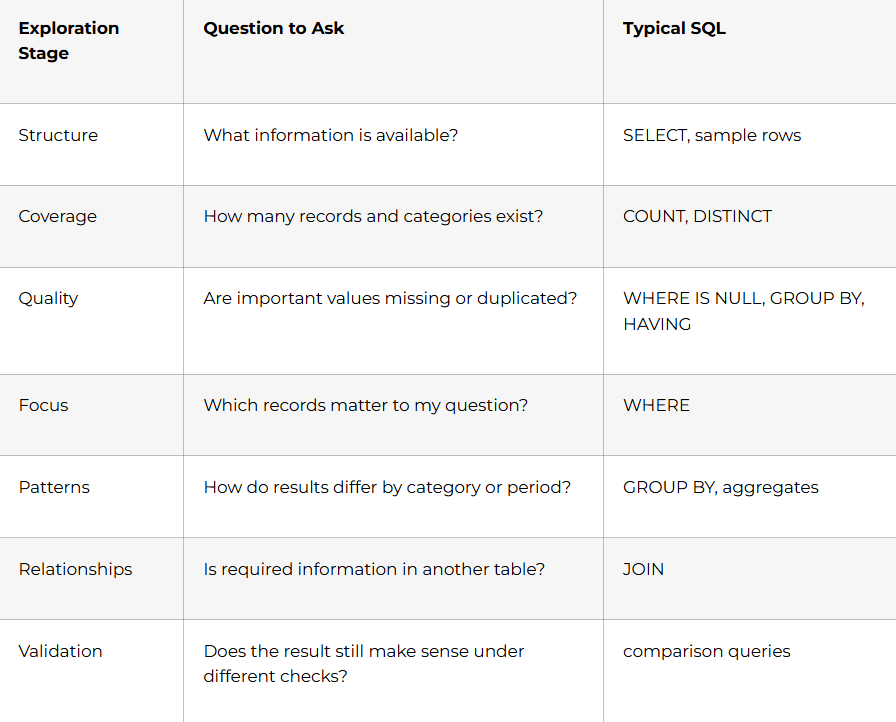
Following this order reduces the risk of drawing conclusions before understanding the dataset.
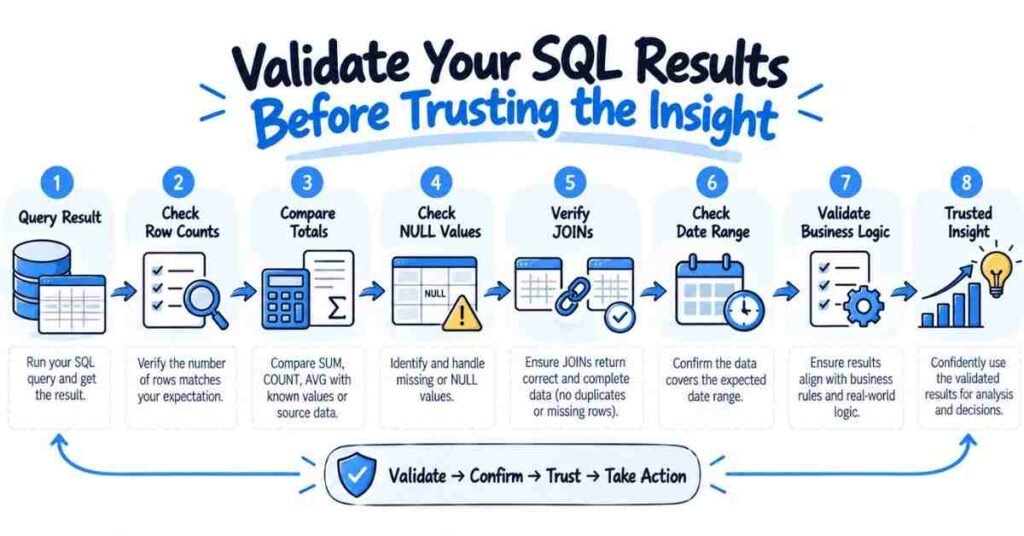
How Should You Validate SQL Results?
A query returning a result does not prove that the result is correct.
Validation should be part of exploration.
If a query says total revenue is ₹5 lakh, compare it with a simpler independent calculation where possible. If a JOIN suddenly increases the number of rows, investigate whether one record is matching multiple records in the other table.
Also compare:
- row counts before and after a JOIN,
- total values before and after filtering,
- grouped totals against overall totals,
- NULL counts in important fields,
- date ranges against the expected reporting period.
This habit becomes increasingly important as SQL queries for analytics become more complex.
Common Mistakes During SQL Data Exploration
A frequent beginner mistake is searching for insights too early. Looking for trends before understanding columns, categories, and data quality can produce misleading conclusions.
Another mistake is assuming every NULL value or duplicate is automatically an error. Context matters. A NULL may be valid, while repeated customer IDs may be expected if one customer places several orders.
JOINs also require care. Connecting tables with the wrong key can duplicate records and change totals without producing a SQL error.
Finally, avoid writing increasingly complicated queries simply to demonstrate SQL knowledge. The best exploratory query is usually the simplest query that answers the current question clearly.
FLM Framework: Explore Before You Explain
A practical way to remember the exploration process is:
Scan → Check → Filter → Summarise → Connect → Validate
Scan the structure and sample records.
Check categories, NULLs, duplicates, and ranges.
Filter the dataset to the relevant question.
Summarise using grouping and aggregation.
Connect related tables only when necessary.
Validate the final result before interpreting it.
This framework keeps exploration focused on understanding the data rather than simply writing more SQL.
Where to Go After Basic Dataset Exploration
Once you can explore datasets confidently, progress to CASE expressions, subqueries, common table expressions, date functions, and window functions.
More importantly, practise on datasets where you must decide which query to write rather than following a tutorial line by line.
For Telugu-speaking learners building SQL alongside Excel, Power BI, Python, statistics, and analytics projects, FLM’s AI Data Analytics Course currently includes SQL database fundamentals, filtering, joins, subqueries, CTEs, and AI-assisted query generation.
Conclusion
Effective SQL exploration is not about running the largest possible query. It is about learning enough about a dataset to trust the analysis that follows.
Begin by understanding the tables and columns. Inspect categories and missing data. Use filters to focus the dataset, aggregation to reveal patterns, JOINs to connect related information, and validation queries to check whether your results are reasonable.
When these habits become routine, SQL moves beyond being a language you study and becomes a practical way to investigate data.
Frequently Asked Questions
What is SQL data exploration?
It is the process of using SQL queries to understand a dataset’s structure, values, quality, patterns, and relationships before deeper analysis or reporting.
Which SQL commands are useful for exploring data?
SELECT, WHERE, DISTINCT, COUNT, SUM, AVG, GROUP BY, HAVING, and JOIN cover many common exploration tasks.
Should I clean data before analysing it?
You should at least investigate missing values, duplicates, inconsistent categories, and unusual ranges before relying on analytical results.
How does GROUP BY help with analysis?
GROUP BY allows analysts to summarise records by categories such as city, month, product, or customer segment.
Why are JOINs important?
JOINs are useful when the information required for one analysis is stored across multiple related tables.
How can I check whether a JOIN is correct?
Compare row counts and totals before and after the JOIN, inspect several matching records, and confirm that the join key represents the intended relationship.
Should beginners learn advanced SQL before exploring datasets?
No. Strong knowledge of filtering, grouping, aggregation, and basic JOINs is enough to perform meaningful exploration before moving to more advanced features.
Can AI help with SQL data exploration?
AI can help explain or draft queries, but the analyst should still understand the tables, verify the logic, and validate the results.
Build Your Learning Plan Around Practice
Learning SQL becomes more effective when each concept is connected to a real dataset rather than practised only as isolated syntax.
Start with a simple table and learn how to inspect records using SELECT, WHERE, and DISTINCT. Once you are comfortable understanding individual records, move to GROUP BY and aggregate functions such as COUNT, SUM, and AVG to answer business questions.
The next stage should introduce datasets with two or more related tables. Practise JOINs using examples such as customers and orders, products and categories, or campaigns and leads. The goal is to understand why tables need to be connected, not simply to memorise JOIN syntax.
A practical learning sequence can look like this:
Explore → Question → Query → Check → Explain
- Explore: Understand the tables, columns, categories, and data quality.
- Question: Decide what business question you want to answer.
- Query: Write the simplest SQL query that can answer it.
- Check: Validate row counts, totals, JOINs, NULL values, and filters.
- Explain: Describe what the result means in simple business terms.
For example, instead of practising GROUP BY without context, use a sales dataset and answer questions such as: Which category generates the highest revenue? Which city has the most orders? How does average order value differ by customer segment?
Once basic exploration becomes comfortable, gradually add CASE expressions, subqueries, CTEs, date functions, and window functions. Your progress should be measured by the problems you can solve independently—not by the number of SQL commands you have memorised.
This practical approach also strengthens portfolio and interview preparation because you learn how to move from a question to a query and then explain the result.
Ready to Become a Data Analyst
Build real-world skills and prepare for your analytics career.
👉 Join Our Data Analytics Program