
How to Validate AI-Generated Data Analysis Results
Table of Contents
Recommended Learning Path
What Is a Dataset ?
Understanding Data for Analytics Beginners
AI tools can make data analysis faster by helping with formulas, SQL queries, Python code, summaries, charts, and explanations. However, an AI-generated answer should not be treated as correct simply because it looks detailed or professional.
To validate AI data analysis, an analyst needs to go back to the original data and verify how the result was produced. This includes checking calculations, filters, assumptions, source values, and the logic behind the final conclusion.
For students, freshers, non-IT learners, and working professionals pursuing an AI Powered Data Analytics Course in Telugu, developing this validation habit is especially important. AI can support and speed up the analysis process, but the analyst is still responsible for checking the accuracy of the results and deciding whether the final conclusion makes sense.
Quick Answer
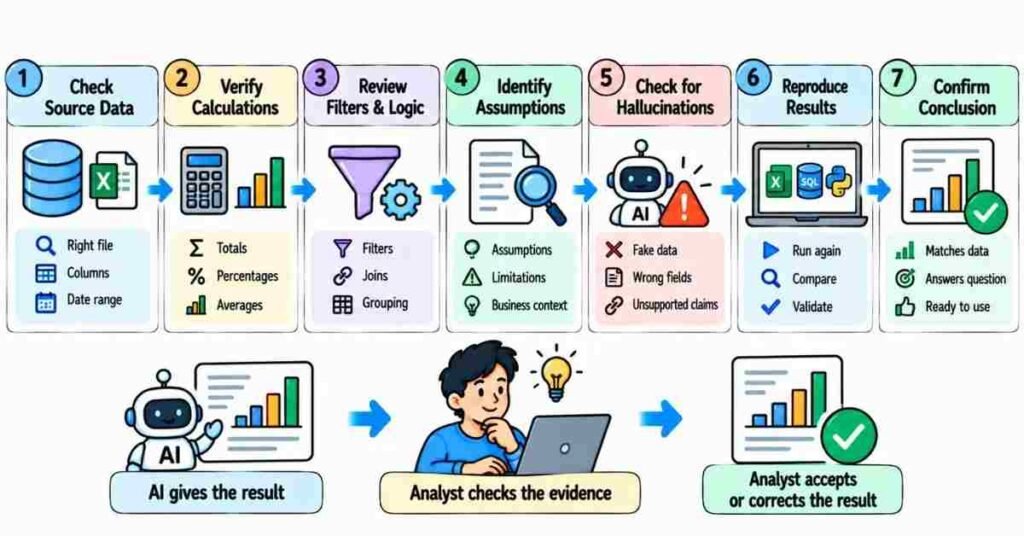
To validate AI-generated data analysis results:
- Check whether the correct source data was used.
- Verify important calculations independently.
- Review filters, joins, grouping, and missing values.
- Identify assumptions made by the AI.
- Compare the result with actual rows in the dataset.
- Look for unsupported or invented information.
- Reproduce important results using Excel, SQL, Python, or another trusted method.
- Confirm that the final conclusion matches the evidence.
A useful rule is:
AI gives the result → Analyst checks the evidence → Analyst accepts or corrects the result.
Start Your Journey with Data Analytics
Join Now –>
Why Should AI-Generated Analysis Be Validated?
Generative AI systems can sometimes produce incorrect information while presenting it confidently. NIST describes this behaviour as “confabulation,” commonly referred to as hallucination, where a generative AI system may produce false, inconsistent, or unsupported content.
In data analysis, that problem may appear in several forms:
- an incorrect percentage;
- a calculation based on the wrong column;
- an invented field name;
- an unnecessary filter;
- a misunderstanding of the business question;
- an incorrect SQL query;
- a conclusion that goes beyond what the data actually shows.
This is why AI analysis validation should focus on evidence rather than presentation.
An AI response may be well written and still be wrong.
Step 1: Check the Original Source Data
Start with the dataset rather than the AI answer.
Before trusting any result, confirm:
- Which file or table was analysed?
- What columns are available?
- What date range does the dataset cover?
- Are there missing values?
- Are there duplicate rows?
- Are numerical fields stored correctly?
- Are there inconsistent category names?
- Were any filters already applied?
Suppose an AI tool reports:
“Hyderabad generated the highest revenue in Q2.”
Before accepting that statement, check:
- whether the dataset includes all cities;
- whether Q2 means April to June in this context;
- whether cancelled transactions were removed;
- whether the revenue column contains valid numeric values.
If the input data is incomplete or incorrectly interpreted, even a mathematically correct calculation can produce a misleading result.
Practice Goal
Take a small sales dataset and note:
Rows → Columns → Date range → Missing values → Duplicate records → Key metrics
Do this before asking AI for insights.
Step 2: Verify Important Calculations Manually
You do not need to manually recalculate every number produced by AI.
Instead, identify the calculations that directly support the final conclusion.
Common values to verify include:
- totals;
- averages;
- percentages;
- percentage change;
- growth rates;
- counts;
- conversion rates;
- category totals;
- minimum and maximum values.
For example, suppose AI says:
“Sales increased by 25% from January to February.”
If January sales were ₹80,000 and February sales were ₹1,00,000, calculate:
Percentage change = (New Value − Old Value) ÷ Old Value × 100
That gives:
(1,00,000 − 80,000) ÷ 80,000 × 100 = 25%
Now the result can be independently confirmed.
Practice Goal
Choose three important values from an AI-generated analysis and reproduce them using Excel, SQL, Python, or a calculator.
The goal is not to avoid AI. The goal is to know whether its result can be verified.
Step 3: Check Filters, Joins, and Grouping
Sometimes the formula is correct, but the records included in the calculation are wrong.
This often happens with:
- date filters;
- product categories;
- regions;
- customer types;
- cancelled orders;
- null values;
- duplicate records;
- table joins.
Consider two tables:
Customers
Customer ID | City |
101 | Hyderabad |
102 | Vijayawada |
Orders
Order ID | Customer ID | Amount |
1 | 101 | 500 |
2 | 101 | 700 |
3 | 102 | 600 |
If a join is performed incorrectly, rows may be duplicated and revenue can appear higher than it really is.
When checking AI output, ask:
- What filter was applied?
- Which columns were joined?
- What was the grouping level?
- Were duplicate records created?
- Were null values excluded or converted?
- Was COUNT used when COUNT DISTINCT was required?
These questions help identify errors that may not be visible in the final chart.
Step 4: Identify the AI's Assumptions
AI may fill missing context with assumptions.
Suppose you ask:
“Which branch is performing best?”
The word “best” is unclear.
It might mean:
- highest revenue;
- highest profit;
- highest number of customers;
- highest growth;
- highest average order value;
- best conversion rate.
If the AI silently chooses revenue, its answer may be mathematically correct but still fail to answer your real question.
Before accepting a result, identify:
Metric → Time period → Population → Filters → Comparison method
If any of these are unclear, ask the AI to state its assumptions.
Then verify whether those assumptions match your requirement.
Step 5: Look for Hallucinations and Unsupported Claims
A common part of verify AI data insights work is checking whether every important statement can actually be traced back to the dataset.
Warning signs include:
- a column that does not exist;
- a number that cannot be reproduced;
- a category that is absent from the dataset;
- a formula that changes between responses;
- an explanation unsupported by the data;
- a causal claim based only on correlation;
- a trend mentioned without enough observations;
- a conclusion that contradicts the raw values.
One practical question to ask AI is:
“Show which columns, calculation, query, or rows support this conclusion.”
Then check that evidence yourself.
Google Cloud’s grounding documentation uses a similar principle: generated claims can be compared against supplied facts to determine whether the claims are actually supported by the reference information.
Step 6: Test the Result Using Another Method
A useful validation habit is to reproduce the same result independently.
For example:
- AI-generated Excel formula → check with PivotTable
- AI-generated SQL → compare with Excel totals
- AI-generated Python result → compare with SQL query
- AI-generated summary → inspect underlying rows
- AI-generated percentage → calculate manually
If both approaches produce the same answer, your confidence increases.
If they produce different answers, do not simply choose the result you prefer.
Investigate why they differ.
Practical Example: Validating an AI Sales Analysis
Suppose you upload a retail sales dataset and ask AI:
“Which city had the highest sales growth between January and February?”
The AI replies:
“Hyderabad had the highest growth at 32%.”
Instead of immediately adding this to your dashboard, follow this process.
1. Check the relevant columns
Confirm that the dataset contains:
- city;
- order date;
- sales amount;
- order status.
2. Check the date range
Make sure January and February data are both complete.
3. Check exclusions
Decide whether cancelled and refunded orders should be excluded.
4. Calculate monthly sales
Group sales by:
City + Month
5. Calculate growth independently
Use:
(February Sales − January Sales) ÷ January Sales × 100
6. Compare with AI
If Hyderabad’s actual growth is 24%, the AI result is incorrect.
Now inspect whether the AI:
- used the wrong denominator;
- included cancelled orders;
- compared different months;
- or misunderstood the request.
This is what practical AI result validation looks like.
The FLM “Source → Calculation → Logic → Evidence” Method
A simple framework for beginners is:
Source → Calculation → Logic → Evidence
Source
Is the underlying data correct?
Calculation
Was the number computed correctly?
Logic
Does the interpretation make sense?
Evidence
Can the conclusion be reproduced and explained?
For example:
AI Output: South region has the highest average order value.
Check it like this:
Source → Are all region records included?
Calculation → Was average calculated correctly?
Logic → Is average the right measure for the question?
Evidence → Can SQL or Excel reproduce the same value?
This method helps learners avoid blindly accepting generated answers.
What Should Analysts Check Manually?
Not every part of an analysis requires the same amount of manual review.
Check | Why It Matters |
Source data | Confirms the correct data was analysed |
Important totals | Detects incorrect aggregation |
Percentages | Checks numerator and denominator |
Filters | Confirms correct records were included |
Joins | Prevents duplicated or missing rows |
Assumptions | Ensures AI answered the intended question |
Final conclusion | Confirms the statement matches the evidence |
For practice datasets, spot-checking important results may be enough.
For business-critical analysis, the validation process should be more detailed and documented.
Common Mistakes When Checking AI Output
Trusting a Confident Answer
AI can present incorrect information confidently. Confidence in wording is not evidence of accuracy.
Asking AI to Validate Itself
You can ask AI to review its own answer, but that should not be your only validation method.
Always compare important results against the original data.
Checking Only the Final Chart
A chart can look correct even if the query, filter, or calculation behind it is wrong.
Ignoring Business Definitions
“Revenue,” “customer,” “conversion,” or “active user” may have specific definitions inside an organization.
AI needs those definitions to analyse the data correctly.
Copying Generated SQL Without Reading It
A SQL query that runs successfully is not automatically the right query.
Check the SELECT fields, WHERE conditions, JOIN logic, GROUP BY, and aggregation functions.
A Beginner Workflow for Validating AI Analysis
Use this sequence whenever AI supports your analytics work:
Question → Data → AI Analysis → Verification → Correction → Final Insight
More practically:
- Define the business question.
- Inspect the source dataset.
- Ask AI to explain its method.
- Check important calculations.
- Verify filters and assumptions.
- Compare selected results with another method.
- Investigate mismatches.
- Document the final validated result.
This process builds analytical judgement rather than simple tool dependency.
Why Validation Is an Important Data Analytics Skill
Learning AI tools is useful, but a data analyst also needs to understand why a result is correct.
In real analytics work, someone may ask:
“How did you calculate this?”
A strong analyst should be able to explain:
- what data was used;
- which filters were applied;
- how the metric was calculated;
- what assumptions were made;
- and why the conclusion is reasonable.
That is why AI should support analytical thinking rather than replace it.
FAQs
How can you verify AI-generated analysis?
Compare the result with the original dataset, verify important calculations, review filters and assumptions, and reproduce important findings using Excel, SQL, Python, or another reliable method.
What should be checked manually in AI analysis?
Check important totals, percentages, filters, joins, assumptions, source values, and conclusions that affect the final recommendation.
How can analysts detect incorrect AI outputs?
Look for numbers that cannot be reproduced, nonexistent fields, inconsistent totals, unsupported conclusions, unexplained assumptions, and outputs that contradict the source data.
Can AI hallucinate while analysing data?
Yes. Generative AI can sometimes produce false or unsupported information and present it confidently. Important results should therefore be checked against the original data.
Should every AI-generated calculation be checked?
Not necessarily. Prioritize calculations that directly affect the main conclusion, especially totals, percentages, averages, growth rates, joins, and grouped results.
Can another AI tool validate the result?
A second AI tool can provide another perspective, but it should not replace checking the result against the source data or reproducing the calculation independently.
Which tools can be used for AI analysis validation?
Depending on the task, you can use Excel, SQL, Python, Power BI, calculators, PivotTables, or direct inspection of the source dataset.
What is the simplest validation rule for beginners?
Use this rule:
Do not accept an important AI-generated insight until you can trace it back to the data.
Related Career Guides
Useful follow-up topics include:
- How Does AI-Powered Data Analytics Work?
- What Is Data Cleaning in Data Analytics?
- What Is Exploratory Data Analysis (EDA)?
- How to Use SQL to Explore an Analytics Dataset
- How to Create a Data Analysis Report Step by Step